

[COVID-19 mortality prediction. Comparison between two scales]
- PMID: 35816690
- PMCID: PMC10395975
[COVID-19 mortality prediction. Comparison between two scales]
Abstract
Background: The prognosis and mortality in patients with COVID-19 are variable. The NEWS2 (National Early Warning Score) and REMS (Rapid Emergency Medicine Score) scales can be used quickly at hospital admission to predict mortality, no studies have been found that compare their predictive performance in our population.
Objective: To compare NEWS2 and REMS to predict mortality in patients with COVID-19.
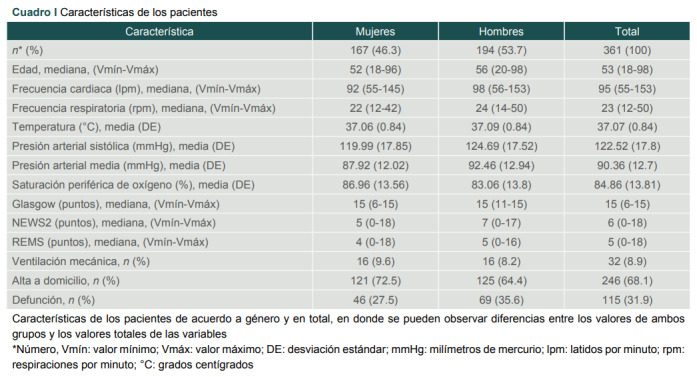
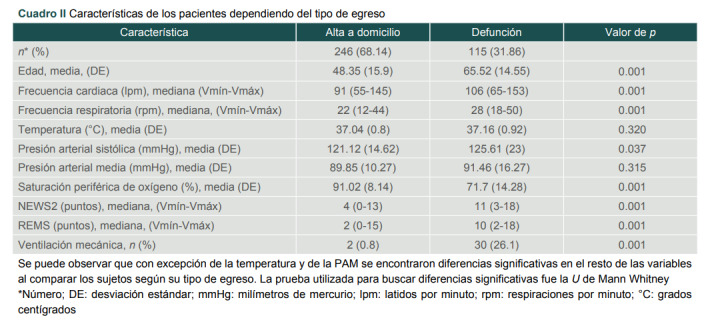
Material and methods: Retrospective cohort with 361 patients. The variables were collected to calculate the NEWS2 and REMS scales and the reason for hospital discharge. The predictive value for mortality was analyzed using the ROC curve, establishing the area under the curve (AUC) with 95% confidence intervals (95% CI). The cut-off point (PC) with the best sensitivity and specificity, positive predictive value (PPV) and negative predictive value (NPV), as well as relative risk (RR) with 95% CI.
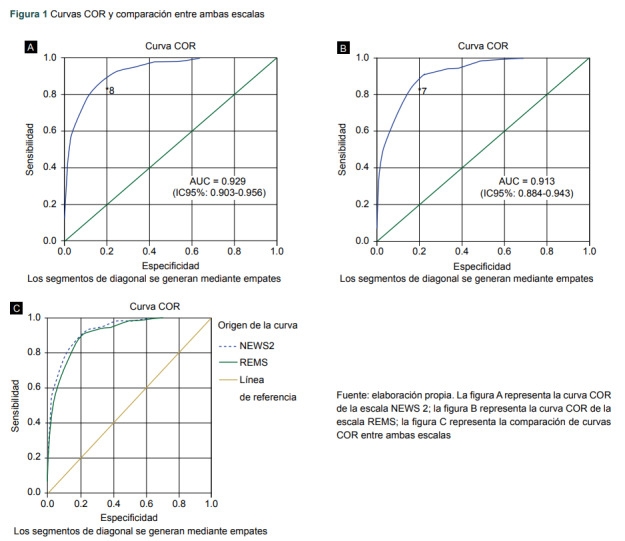
Results: The AUC of NEWS2 and REMS were 0.929 (95% CI: 0.903-0.956) and 0.913 (95% CI: 0.884-0.943), respectively. The PC of the NEWS2 scale was 8 points, with sensitivity 87.8% and specificity 82.1%, PPV 69.7% and NPV 93.5% and of the REMS scale of 7 points, with sensitivity 83.5% and specificity 83.7%, PPV 70.5% and NPV 91.6%. 8 or more points on the NEWS2 scale presenting a RR of 10.74 (95% CI: 6.4-18.03), and REMS 7 or more points RR 8.36 (95% CI: 5.36-13.02).
Conclusion: Both tests presented good discriminative ability to predict mortality, being better according to AUC and RR in the NEWS2 scale.
Introducción: el pronóstico y mortalidad en pacientes con COVID-19 son variables. Las escalas NEWS2 (National Early Warning Score) y REMS (Rapid Emergency Medicine Score) pueden ser utilizadas rápidamente al ingreso hospitalario para predecir mortalidad, sin embargo no se encuentran estudios que comparen su rendimiento predictivo en nuestra población.
Objetivo: comparar las escalas NEWS2 y REMS para predecir mortalidad en pacientes con COVID-19.
Material y métodos: cohorte retrospectiva con 361 pacientes. Se recabaron las variables para calcular las escalas NEWS2 y REMS y el motivo de egreso hospitalario. El valor predictivo para mortalidad se analizó mediante curva COR, estableciendóse área bajo la curva (AUC) con intervalos de confianza al 95% (IC95%). Se determinó el punto de corte (PC) con la mejor sensibilidad y especificidad, valor predictivo positivo (VPP) y valor predictivo negativo (VPN), además de riesgo relativo (RR) con IC95%.
Resultados: las AUC de NEWS2 y REMS fueron de 0.929 (IC95%: 0.903 - 0.956) y 0.913 (IC95%: 0.884 - 0.943), respectivamente. El PC de la escala NEWS2 fue de 8 puntos, con sensibilidad de 87.8% y especificidad de 82.1%, el VPP de 69.7% y el VPN de 93.5%; mientras que de la escala REMS fue de 7 puntos, con sensibilidad de 83.5% y especificidad de 83.7%, el VPP de 70.5% y el VPN de 91.6%. Un total de 8 o más puntos en la escala NEWS2 presentan un RR de 10.74 (IC95%: 6.4 - 18.03), y REMS de 7 o más puntos un RR de 8.36 (IC95%: 5.36 - 13.02).
Conclusión: ambas pruebas presentaron buena capacidad discriminativa para predecir mortalidad, siendo mejor de acuerdo con AUC y RR en la escala NEWS2.
Keywords: Coronavirus Infections; Emergency Medicine; Hospital Mortality.
© 2022 Revista Medica del Instituto Mexicano del Seguro Social.
Conflict of interest statement
los autores han completado y enviado la forma traducida al español de la declaración de conflictos potenciales de interés del Comité Internacional de Editores de Revistas Médicas, y no fue reportado alguno que tuviera relación con este artículo.
Figures
Similar articles
-
[The predictive value of warning scores for intensive care unit admission in coronavirus disease 2019 patients].Zhonghua Nei Ke Za Zhi. 2023 Apr 1;62(4):433-437. doi: 10.3760/cma.j.cn112138-20220414-00277. Zhonghua Nei Ke Za Zhi. 2023. PMID: 37032140 Chinese.
-
National Early Warning Score 2 (NEWS2) on admission predicts severe disease and in-hospital mortality from Covid-19 - a prospective cohort study.Scand J Trauma Resusc Emerg Med. 2020 Jul 13;28(1):66. doi: 10.1186/s13049-020-00764-3. Scand J Trauma Resusc Emerg Med. 2020. PMID: 32660623 Free PMC article.
-
Evaluation of Early Warning Scores on In-Hospital Mortality in COVID-19 Patients: A Tertiary Hospital Study from Taiwan.Medicina (Kaunas). 2023 Feb 26;59(3):464. doi: 10.3390/medicina59030464. Medicina (Kaunas). 2023. PMID: 36984465 Free PMC article.
-
The Prognostic Accuracy of National Early Warning Score 2 on Predicting Clinical Deterioration for Patients With COVID-19: A Systematic Review and Meta-Analysis.Front Med (Lausanne). 2021 Jul 9;8:699880. doi: 10.3389/fmed.2021.699880. eCollection 2021. Front Med (Lausanne). 2021. PMID: 34307426 Free PMC article.
-
The use of early warning system scores in prehospital and emergency department settings to predict clinical deterioration: A systematic review and meta-analysis.PLoS One. 2022 Mar 17;17(3):e0265559. doi: 10.1371/journal.pone.0265559. eCollection 2022. PLoS One. 2022. PMID: 35298560 Free PMC article.
References
-
- Velázquez R. Historia de las infecciones por coronavirus y epidemiología de la infección por SARS-CoV-2. Rev Mex Traspl. 2020;9(S2):s149–s159.
-
- World Health Organization. This statement is updated on an ongoing basis, in response to evolving events and common media queries. 2020. Disponible en: www.who.int/news-room/detail/27-04-2020-who-timeline---covid-19 .
-
- World Health Organization. Coronavirus (COVID-19) Dashboard. 2021. citado en Mayo del 2021. Disponible en: covid19.who.int .
-
- Ramiro M. Epidemiología del SARS-CoV-2. Acta Pediatr Mex. 2020;41(Supl 1):S8–S14.
-
- World Health Organization. Coronavirus (COVID-19) Dashboard. 2021. Consultado en Mayo del 2021. Disponible en: covid19.who.int .
MeSH terms
LinkOut - more resources
Full Text Sources
Medical