

Identification of potential biomarkers and immune infiltration characteristics in severe asthma
- PMID: 35817495
- PMCID: PMC9280849
- DOI: 10.1177/03946320221114194
Identification of potential biomarkers and immune infiltration characteristics in severe asthma
Abstract
Objectives: We hope to identify key molecules that can be used as markers of asthma severity and investigate their correlation with immune cell infiltration in severe asthma.
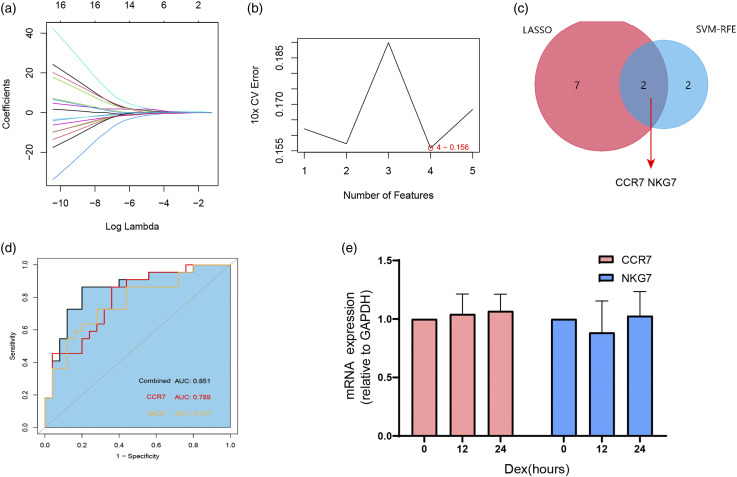
Methods: An asthma dataset was downloaded from the Gene Expression Omnibus database and then processed by R software to obtain differentially expressed genes (DEGs). First, multiple enrichment platforms were applied to analyze crucial biological processes and pathways and protein-protein interaction networks related to the DEGs. We next combined least absolute shrinkage and selection operator logistic regression and the support vector machine-recursive feature elimination algorithms to screen diagnostic markers of severe asthma. Then, a local cohort consisting of 40 asthmatic subjects (24 with moderate asthma and 16 with severe asthma) was used for biomarker validation. Finally, infiltration of immune cells in asthma bronchoalveolar lavage fluid and their correlation with the screened markers was evaluated by CIBERSORT.
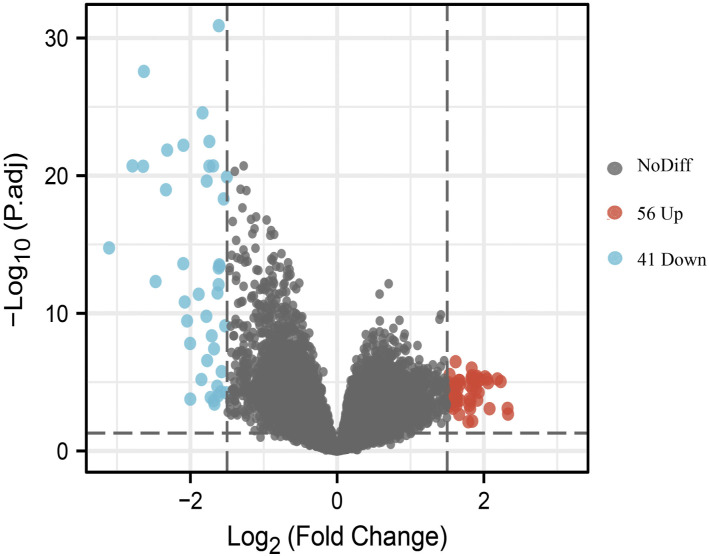
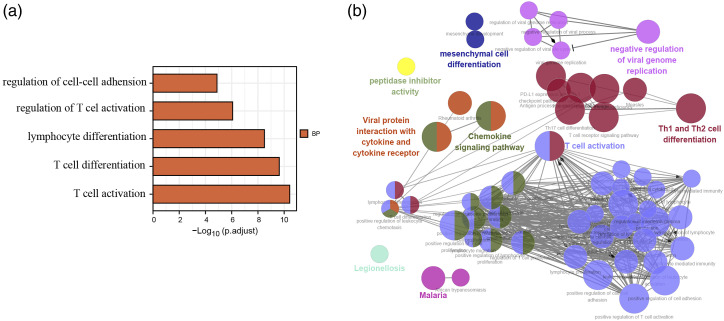
Results: A total of 97 DEGs were identified in this study. Most of these genes are enriched in T cell activation and immune response in the asthma biological process. CC-chemokine receptor 7 (CCR7) and natural killer cell protein 7(NKG7) were identified as markers of severe asthma. The highest area under the ROC curve (AUC) was from a new indicator combining CCR7 and NKG7 (AUC = 0.851, adj. p < 0.05). Resting and activated memory CD4 T cells, activated NK cells, and CD8 T cells were found to be significantly higher in the severe asthma group (adj. p < 0.01). CCR7 and NKG7 were significantly correlated with these infiltrated cells that showed differences between the two groups. In addition, CCR7 was found to be significantly positively correlated with eosinophils (r = 0.38, adj. p < 0.05) infiltrated in bronchoalveolar lavage fluid.
Conclusion: CCR7 and NKG7 might be used as potential markers for asthma severity, and their expression may be associated with differences in immune cell infiltration in the moderate and severe asthma groups.
Keywords: asthma treatment; eosinophil asthma; eosinophils; glucocorticoid; immune infiltration.
Conflict of interest statement
Figures


Similar articles
-
Identification of Potential Biomarkers and Immune Infiltration Characteristics in Idiopathic Pulmonary Arterial Hypertension Using Bioinformatics Analysis.Front Cardiovasc Med. 2021 Feb 1;8:624714. doi: 10.3389/fcvm.2021.624714. eCollection 2021. Front Cardiovasc Med. 2021. PMID: 33598484 Free PMC article.
-
GRB10 and E2F3 as Diagnostic Markers of Osteoarthritis and Their Correlation with Immune Infiltration.Diagnostics (Basel). 2020 Mar 22;10(3):171. doi: 10.3390/diagnostics10030171. Diagnostics (Basel). 2020. PMID: 32235747 Free PMC article.
-
Predicting diagnostic gene expression profiles associated with immune infiltration in patients with lupus nephritis.Front Immunol. 2022 Dec 2;13:839197. doi: 10.3389/fimmu.2022.839197. eCollection 2022. Front Immunol. 2022. PMID: 36532018 Free PMC article.
-
Identification of TYR, TYRP1, DCT and LARP7 as related biomarkers and immune infiltration characteristics of vitiligo via comprehensive strategies.Bioengineered. 2021 Dec;12(1):2214-2227. doi: 10.1080/21655979.2021.1933743. Bioengineered. 2021. PMID: 34107850 Free PMC article.
-
CD6 and CCR7 as Genetic Biomarkers in Evaluating Intracranial Aneurysm Rupture Risk.J Integr Neurosci. 2024 Mar 11;23(3):55. doi: 10.31083/j.jin2303055. J Integr Neurosci. 2024. PMID: 38538213
Cited by
-
Integrated study of systemic and local airway transcriptomes in asthma reveals causal mediation of systemic effects by airway key drivers.Genome Med. 2023 Sep 20;15(1):71. doi: 10.1186/s13073-023-01222-2. Genome Med. 2023. PMID: 37730635 Free PMC article.
-
Investigating Forkhead Box O Transcription Factor 1 Gene's Relation to Immunoglobulin E in House Dust Mite-Allergic Asthma Patients.Adv Respir Med. 2023 Nov 15;91(6):532-545. doi: 10.3390/arm91060039. Adv Respir Med. 2023. PMID: 37987301 Free PMC article.
References
-
- Hammad H, Lambrecht BN. (2021) The basic immunology of asthma. Cell 184(6): 1469–1485. - PubMed
MeSH terms
Substances
LinkOut - more resources
Full Text Sources
Medical
Research Materials
