. 2022 Jul 25;9(4):ENEURO.0027-22.2022.
doi: 10.1523/ENEURO.0027-22.2022. Print 2022 Jul-Aug.

Inter-Animal Variability in Activity Phase Is Constrained by Synaptic Dynamics in an Oscillatory Network

Affiliations

Inter-Animal Variability in Activity Phase Is Constrained by Synaptic Dynamics in an Oscillatory Network

Haroon Anwar et al. eNeuro. .

Abstract

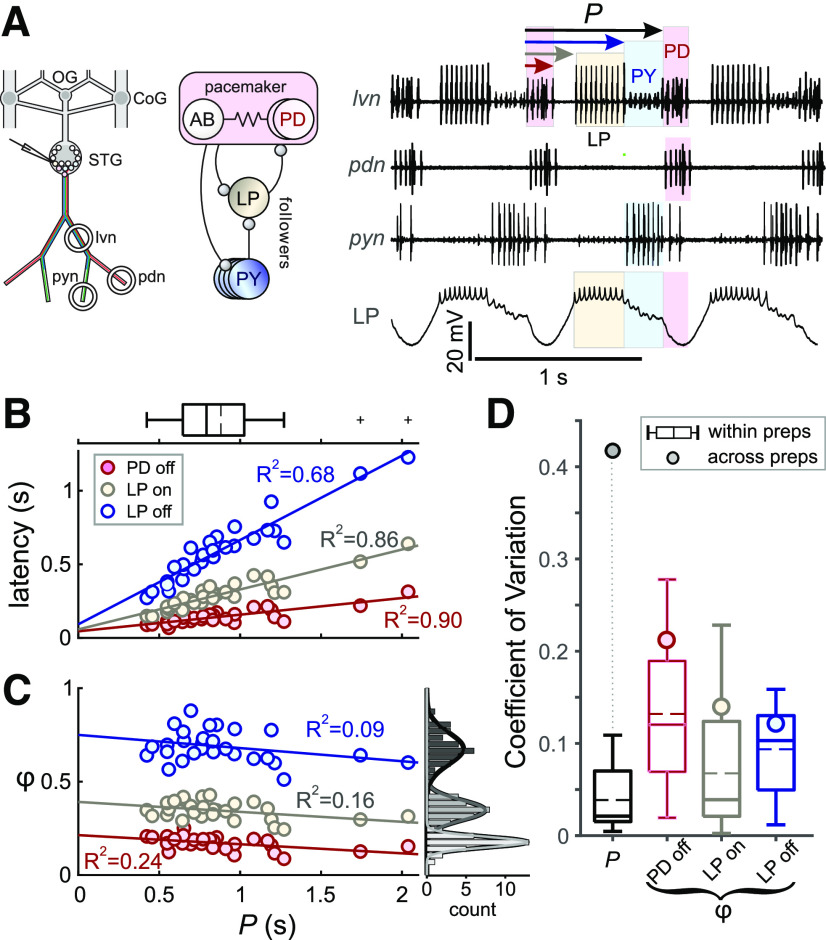
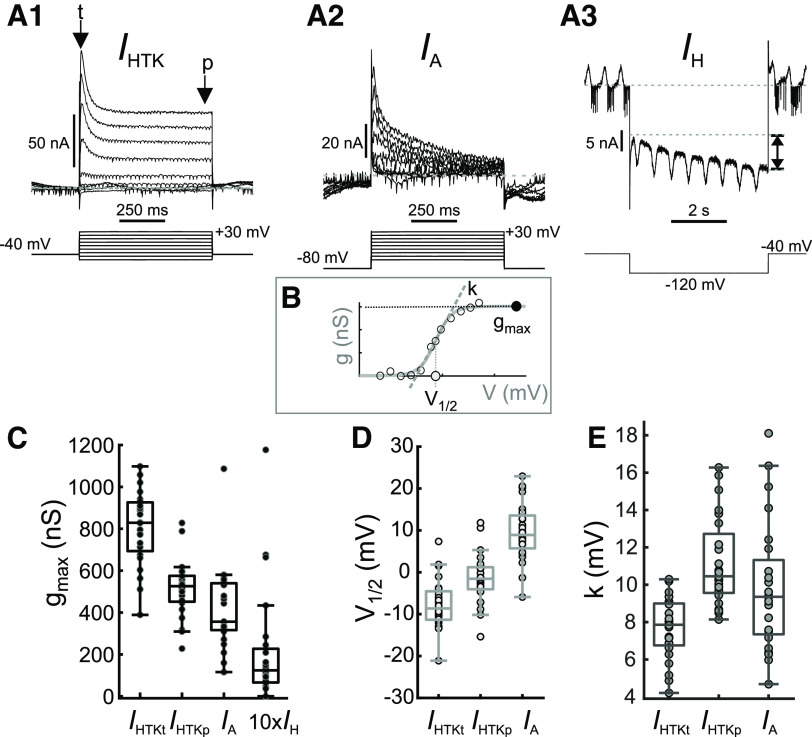
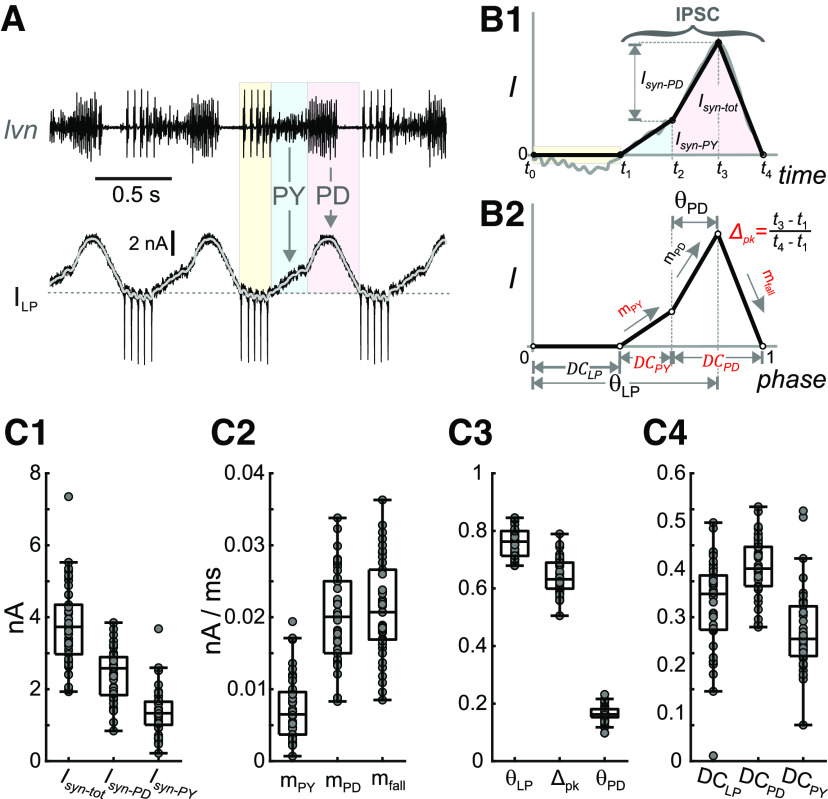
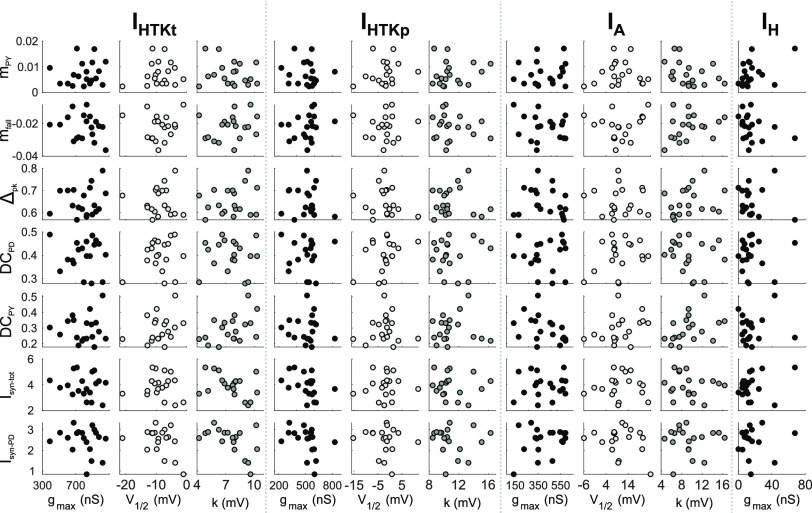
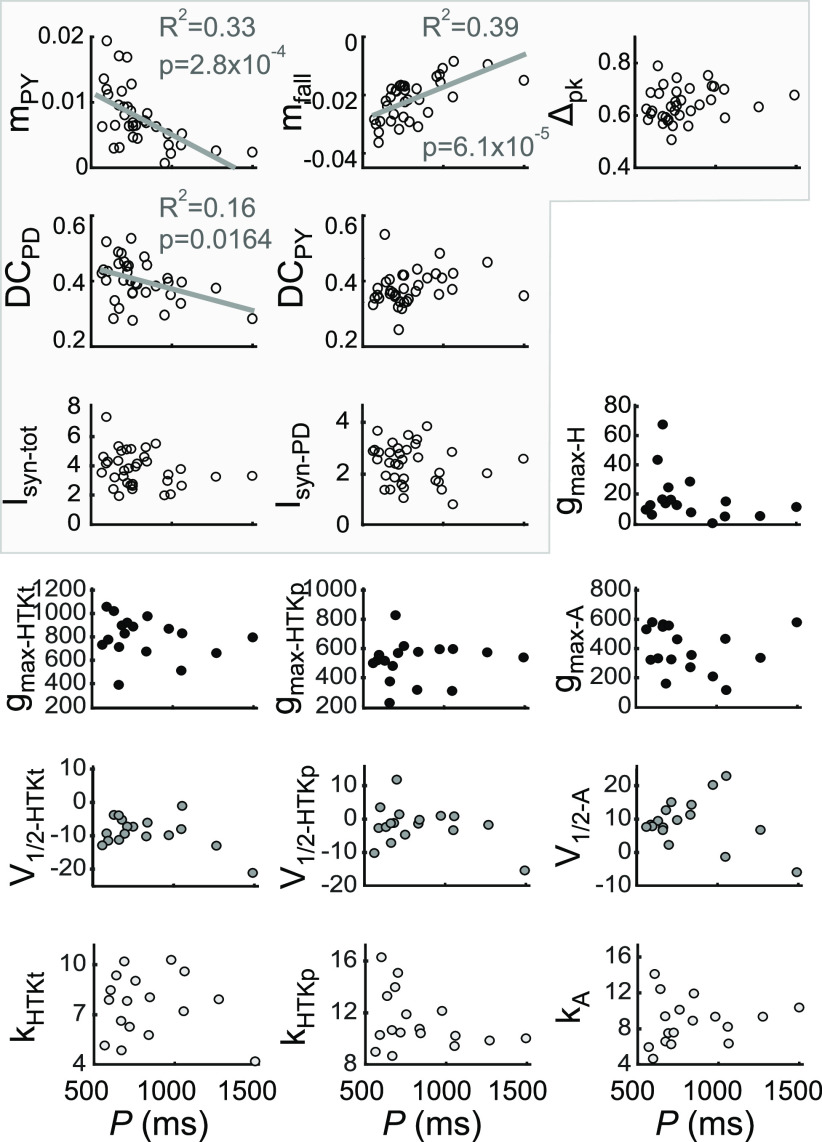
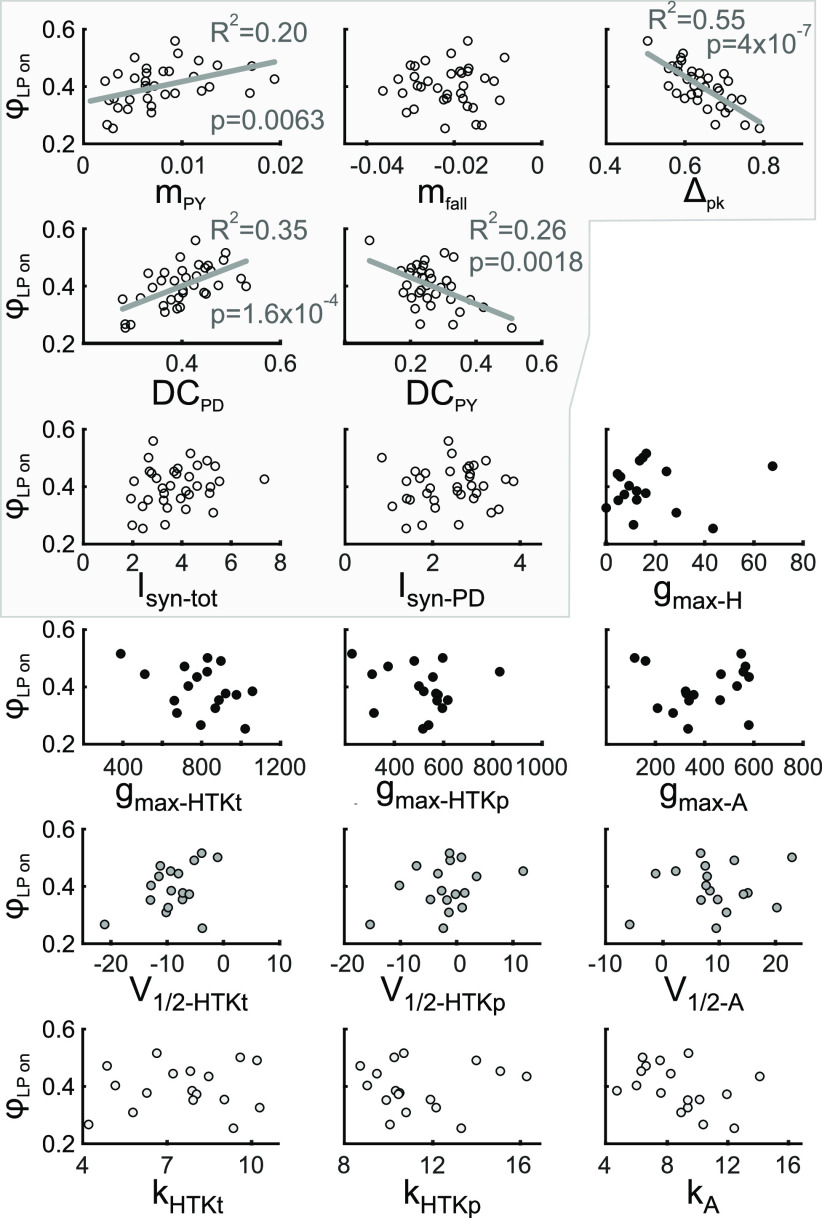
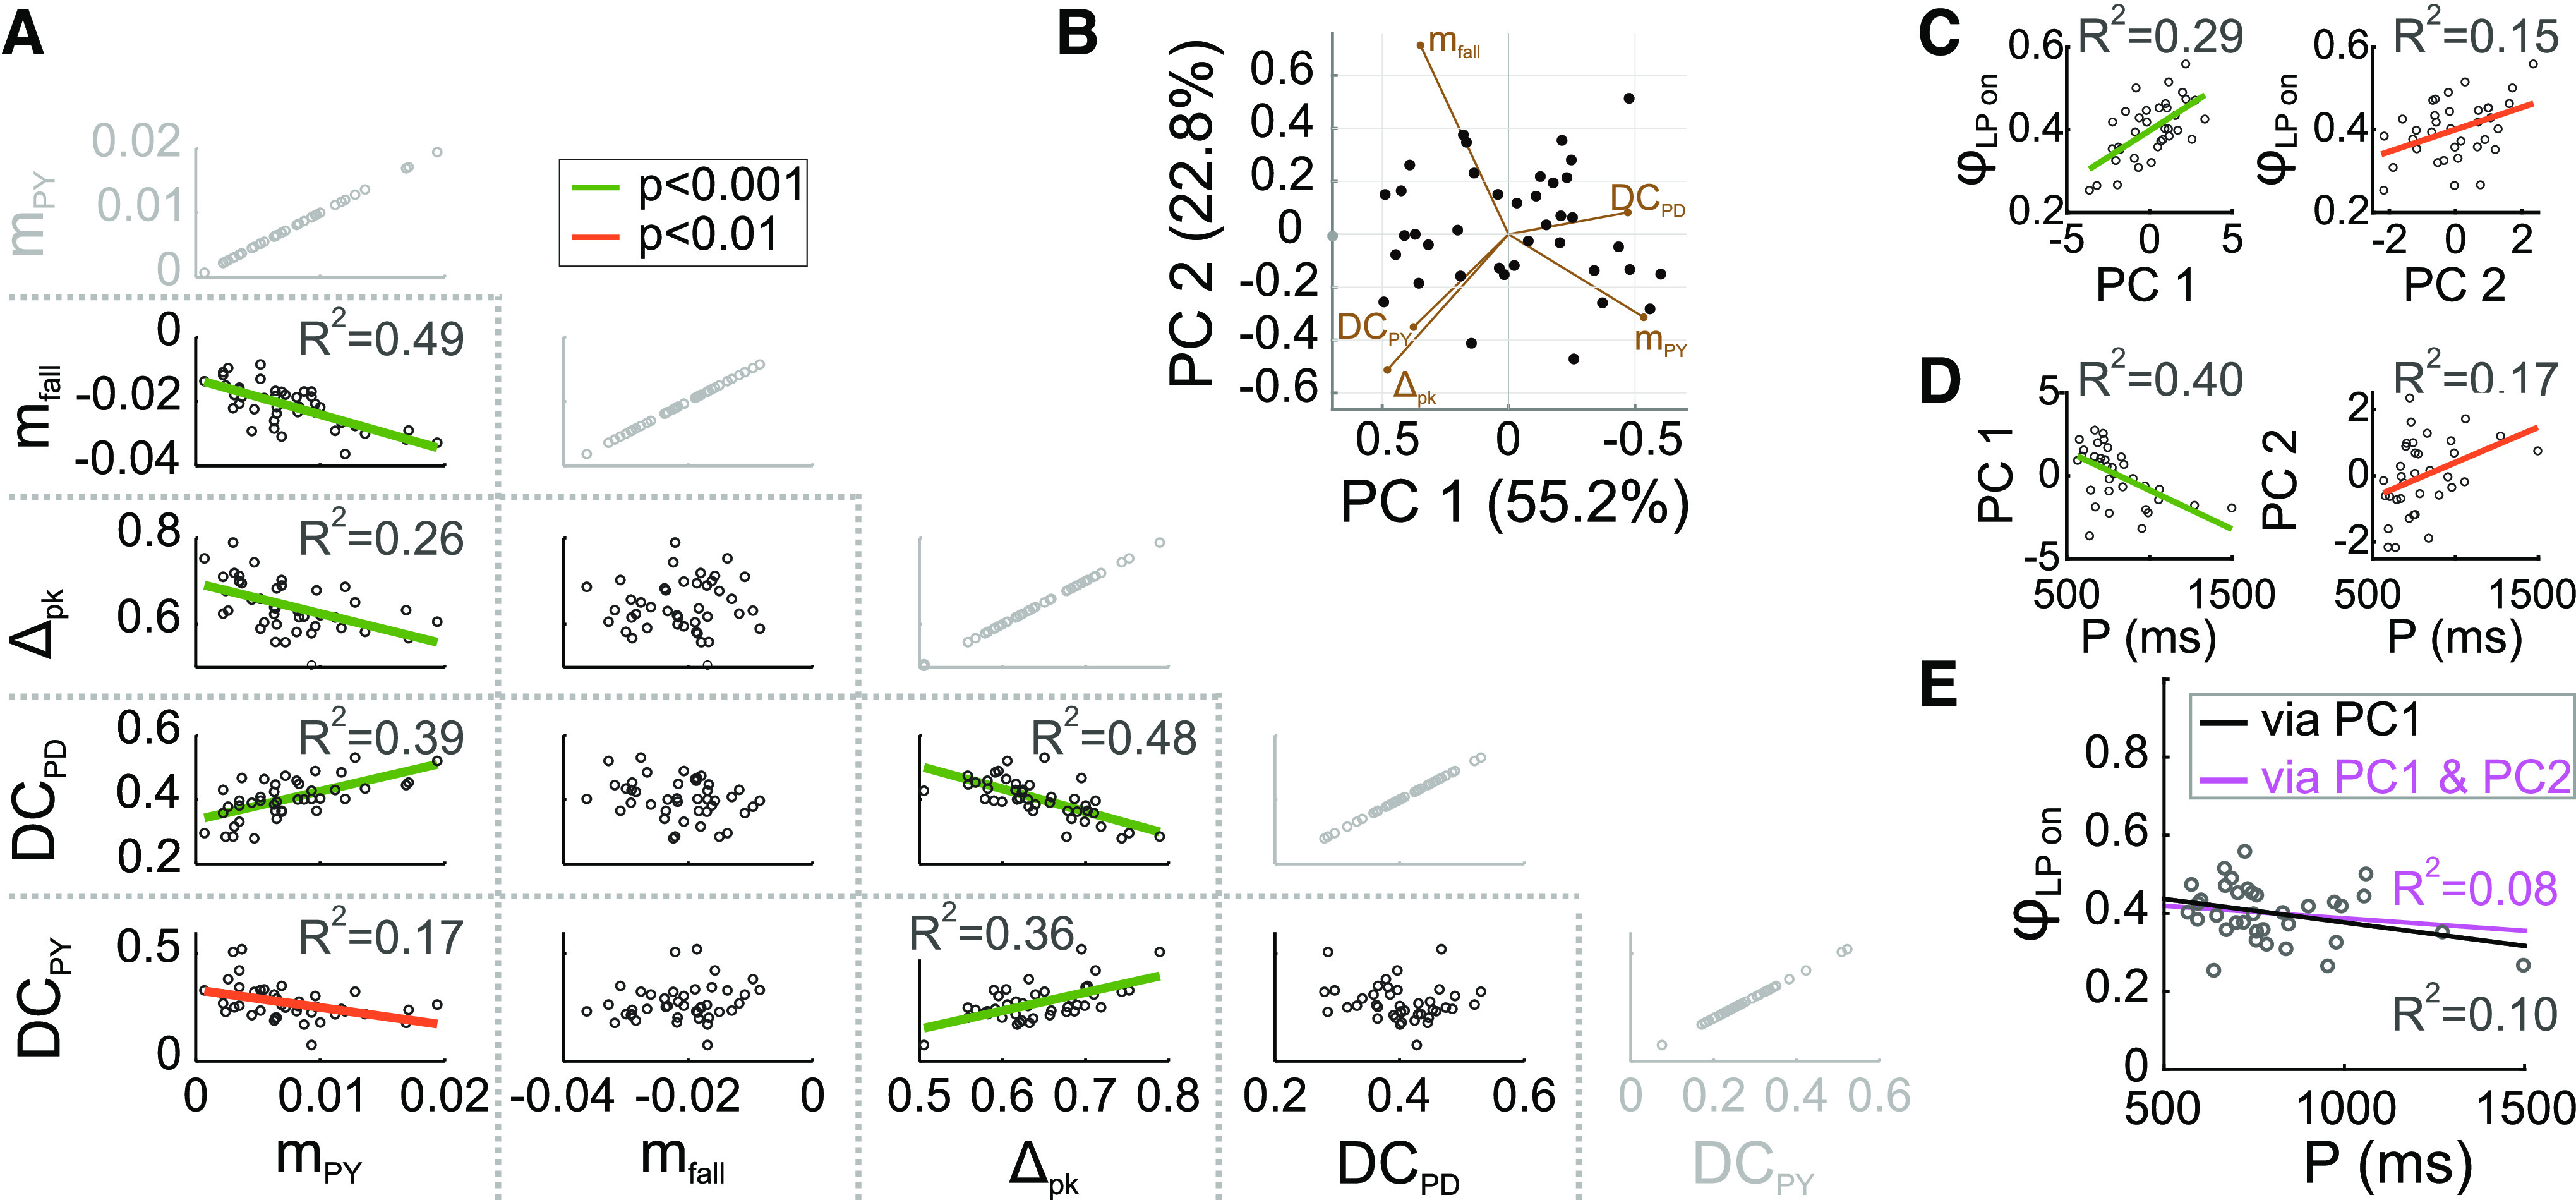
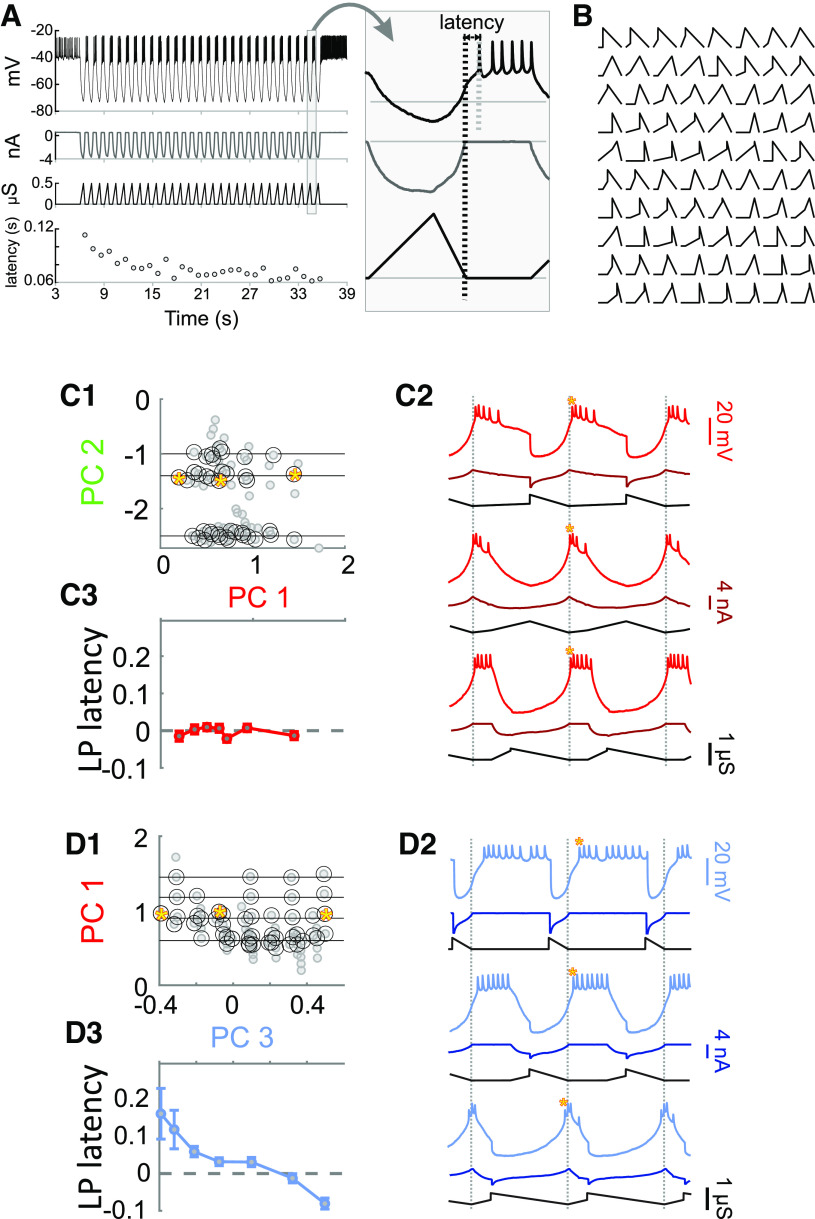
The levels of voltage-gated and synaptic currents in the same neuron type can vary substantially across individuals. Yet, the phase relationships between neurons in oscillatory circuits are often maintained, even in the face of varying oscillation frequencies. We examined whether synaptic and intrinsic currents are matched to maintain constant activity phases across preparations, using the lateral pyloric (LP) neuron of the stomatogastric ganglion (STG) of the crab, Cancer borealis LP produces stable oscillatory bursts on release from inhibition, with an onset phase that is independent of oscillation frequency. We quantified the parameters that define the shape of the synaptic current inputs across preparations and found no linear correlations with voltage-gated currents. However, several synaptic parameters were correlated with oscillation period and burst onset phase, suggesting they may play a role in phase maintenance. We used dynamic clamp to apply artificial synaptic inputs and found that those synaptic parameters correlated with phase and period were ineffective in influencing burst onset. Instead, parameters that showed the least variability across preparations had the greatest influence. Thus, parameters that influence circuit phasing are constrained across individuals, while those that have little effect simply co-vary with phase and frequency.

Keywords: correlations; dynamic clamp; oscillation; phase maintenance; stomatogastric; synaptic dynamics.


Figures

Figure 1.
Figure 1.
Pyloric activity phases are variable but not correlated with the cycle period. A, Left, Schematic diagram shows the layout of the STNS in vitro and the locations of intracellular (electrode) and extracellular (circles) recordings. OG: esophageal ganglion, CoG: commissural ganglion, STG: stomatogastric ganglion, lvn: the lateral ventricular nerve, pdn: PD nerve, pyn: pyloric nerve. Middle, Schematic diagram shows a simplified circuit diagram of the neurons recorded. Ball-and-stick symbols are inhibitory chemical synapses. Resistor denotes electrical coupling. Right, Simultaneous extracellular and intracellular recordings show the regular triphasic oscillations of the pyloric circuit. Shown are bursting activity of pacemaker neuron PD and follower neurons LP and PY. Cycle period (P) and latencies of the onset and end of each burst (arrows) are calculated from the onset of the PD burst. Extracellular recordings are from the lvn (showing the LP, PD and PY spikes), the pdn (showing the PD spikes), and pyn [showing the PY and the lateral posterior gastric (LPG) neuron spikes]. Intracellular recording from the LP neuron shows bursting activity (yellow) and slow wave oscillations, as well as timing of IPSPs from the PY (light blue) and PD (pink) neurons. B, Burst latencies of the PD and LP neuron in reference to PD burst onset, as marked in panel A, shown versus P. Quartile plot shows the distribution of P, with the dashed line indicating the mean value. Lines indicate best linear fit, showing that latencies grow proportionally with P. C, Phase values (φ = latency/P) shown versus P. Histograms show distribution of φ values. Linear fits indicate a lack of correlation between all φ values and P. D, CV of P and φ values shown to compare variability of the values within preparations (quartile plots) to their variability across preparations (circles).
Figure 2.
Figure 2.
Parameters defining voltage-gated currents IHTK, IA, and IH show considerable variability. A, Example voltage clamp recordings of high-threshold potassium currents [IHTK, A1; arrows indicate the transient (t) and persistent (p) components], the transient potassium A current (IA, A2) and the H current (IH, A3). Double-arrow in A3 indicates the measured amplitude of IH. B, Schematic diagram of fits in each experiment to the IHTK and IA conductances (g, measured by dividing current by the driving force, assuming EK = −80 mV). Fits were used to calculate maximum conductance (gmax), half-activation voltage (V1/2), and activation slope factor (k, measured from the slope of the dashed line). C, Maximal conductances of the transient and persistent components of IHTK, IA, and IH across preparations. D, Half-activation voltage of the transient and persistent components of IHTK and of IA across preparations. E, Activation slope factor of the transient and persistent components of IHTK and of IA across preparations. Among these parameters, there were some pairwise correlations among the gmax values as well as the parameters V1/2 and k (see Extended Data Fig. 2-1 for plots and Extended Data Fig. 2-2 for all p and R values).
Figure 3.
Figure 3.
Parameters that define the synaptic input show considerable variability. A, Total current measured in the LP neuron voltage clamped at a holding potential of −50 mV during the ongoing pyloric rhythm. The pyloric rhythm is recorded extracellularly (lvn), indicating the timing of the LP, PY, and PD neuron bursts. LP action potentials escape the voltage clamp and can be seen in the current and extracellular recordings (pale yellow). The portion of the current outside this range is because of synaptic input (downward arrows) from the PY (light blue) and pacemaker (PD, pink) neurons. The gray curve is the current low-pass filtered (<20 Hz). B1, The synaptic waveform shape (gray curve) during a single cycle of oscillation is approximated by a piecewise-linear curve (black curve), marked by five time points (t0t4) denoting the borders of the colored regions in panel A. The time range of the IPSC and the amplitudes of the synaptic currents because of the pacemaker neurons (Isyn-PD), because of the PY neurons (Isyn-PY), and the sum of the two (Isyn-tot) are marked. B2, The piecewise-linear curve of B1 shown in phase (time/period). This normalized curve is used to define the parameters of synaptic input to the LP neuron. For definitions, please refer to the main text. Five primary parameters (in red) are chosen for further analysis. C, The interindividual variability of different synaptic parameters, including current amplitudes (C1), slopes (C2), peak phases (C3), and duty cycles (C4).
Figure 4.
Figure 4.
There are no pairwise linear correlations between any of the synaptic parameters and parameters of the voltage-gated ionic currents. Data shown are from experiments in which every parameter was measured in a single preparation (N = 19). The parameters are defined in Figures 2 and 3. Each dot represents an LP neuron from an individual animal.
Figure 5.
Figure 5.
A subset of the LP neuron synaptic, but not intrinsic, parameters are correlated with the pyloric cycle period. The five primary synaptic parameters, the amplitudes of the total and pacemaker-component of the synaptic current, and the intrinsic current parameters are compared with the pyloric cycle period (P) across preparations. Three synaptic parameters, but no intrinsic parameter, covary with P. The synaptic parameters are highlighted.
Figure 6.
Figure 6.
The LP neuron burst onset phase is correlated with multiple synaptic, but not intrinsic, parameters. The LP burst onset phase (φLP on) is compared with the five primary synaptic parameters, the amplitudes of the total and pacemaker-component of the synaptic current, and the intrinsic current parameters across preparations. φLP on covaries with four synaptic parameters, but not with intrinsic parameters. The synaptic parameters are highlighted.
Figure 7.
Figure 7.
The primary synaptic parameters are correlated. A, The five primary synaptic parameters were compared pairwise across preparations. Of the 10 nontrivial comparisons (shown in black), 6 showed significant correlations. The trivial comparisons (gray) are shown for clarity. B, PCA was used to find directions of largest variability among the five synaptic parameters. The first two principal components described 78% of the variability in synaptic parameters. Filled circles show all recorded synaptic waveforms, projected down to the PC1-PC2 plane. Percentages on axis labels indicate the extent of variability in the direction of the PC. The directions of the five primary synaptic parameters in the PC1-PC2 plane are indicated by brown line segments (biplot). See Extended Data Figure 7-1 for projections onto all PC subplanes. C, Across preparations, the LP burst onset phase (ϕLP) is correlated with both PC1 and PC2 (but not PC3, PC4, or PC5). D, Across preparations, both PC1 and PC2 (but not PC3, PC4, or PC5) are correlated with the pyloric cycle period (P). E, Using the PC1 and PC2 correlations with ϕLP and P (lines in left graphs of panels C, D) to calculate a linear relationship (black line) between ϕLP and P correctly predicts a lack of correlation between these two factors. Including both the PC1 and PC2 correlations (all lines in panels C, D) to do the linear prediction (magenta line) does not greatly improve the prediction.
Figure 8.
Figure 8.
Using dynamic clamp to inject a periodic synaptic conductance waveform into the synaptically-isolated LP neuron to measure the latency of LP burst onset. A, A predetermined conductance waveform (one of 80) is injected into the synaptically-isolated LP neuron as an inhibitory synapse for 30 cycles at a cycle period of 1 s. The latency of the LP burst onset, measured form the end of the conductance waveform (long vertical dashed line in inset), reaches a steady state value after several cycles. Inset shows the last cycle. B, A total of 80 synaptic conductance waveforms were used periodic dynamic clamp injection in each LP neuron, as described in A. C, An example analysis of the sensitivity of LP burst onset latency to changes in synaptic waveform shape along PC1, while PC2 remains constant (but other PCs vary freely). C1, The 80 synaptic waveforms (gray filled circles) used in dynamic clamp experiments were sorted by projecting the shape down to the PC1-PC2 plane. Pairs of waveforms (black circles) that fell along horizontal lines of constant PC2 (and were apart by at least 0.05 in PC1 units) were chosen for sensitivity analysis. C2, Example responses of the LP neuron to dynamic clamp injection of synaptic conductance waveforms marked by the yellow stars in C1. C3, The change in LP burst latency (see A) as a function of the change in PC1 value (in bins of 0.1), averaged across constant PC2. The slope of this change (Δlatency/ΔPC) is used as a measure of sensitivity. D, Same as C, but changing the waveform along PC3 while keeping PC1 constant.
Figure 9.
Figure 9.
Varying synaptic waveform shape along each principal component while keeping another principal component constant. A, Graphical representation of how the shape of a representative synaptic waveform (black) changes when synaptic parameters are shifted by 25% in the direction of each principal component (in the direction of the arrow). B1, Sensitivity of LP burst onset latency to changing the principal component along a single PC (marked by gray box in each panel) while a single other PC is kept constant (and the other three are not controlled). Examples of the process (marked by arrows) are shown in Figure 8C,D. In these panels, quartile plots are from data including every individual sensitivity value (200–500 data points) in each experiment (N = 10 animals). Black squares show mean values. B2, The same data as in B1, reorganized so that each panel shows data when a single PC (gray box) is kept constant while a single other PC is varied (and the other 3 are not controlled). The red and blue arrows point to the same data as they do in B1. C, Overall sensitivity of LP burst latency (Fig. 8) to changing the synaptic waveform along each PC, measured as an overall average of the values shown in panel B. In this graph, only the mean sensitivity values in each experiment are used as data points (N = 10). These sensitivities were significantly different (one-way RM-ANOVA p < 0.001). Different letters (a–d) indicate p < 0.01 with post hoc Tukey’s test; shared letters indicate p > 0.05. Asterisks indicate post hoc analysis indicating whether the mean value (μ) ≠ 0, **p < 0.001, ***p < 0.0001. D, Statistical summary of panel A data, indicating how varying one PC, while keeping another PC constant (and not controlling others), would produce a change in LP burst latency. Asterisks indicate post hoc analysis indicating whether μ ≠ 0, *p < 0.01, **p < 0.001, ***p < 0.0001. E, The direction of DC is marked as PC3 for visual comparison with PC3 in panels A–D. The other PCs are roughly (but not exactly) in similar directions as the corresponding PCs of A–D. F1, Sensitivity of LP burst onset latency to changing the principal component along a single PC (marked by gray box in each panel) while a single other PC is kept constant (and the other three are not controlled). Data are the same as in B. Black squares show mean values. F2, The same data as in F1, reorganized so that each panel shows data when a single PC (gray box) is kept constant while a single other PC is varied (and the other 3 are not controlled). G, Overall sensitivity of LP burst latency to changing the synaptic waveform along each PC (as in panel F), measured as an overall average of the values shown in F. Notations the same as in C. See Extended Data Figure 9-1 for values of PCs and PCs.

References

    1. Abbott LF, Marder E, Hooper SL (1991) Oscillating networks: control of burst duration by electrically coupled neurons. Neural Comput 3:487–497. 10.1162/neco.1991.3.4.487 - DOI - PubMed
    1. Ainsworth M, Lee S, Cunningham MO, Traub RD, Kopell NJ, Whittington MA (2012) Rates and rhythms: a synergistic view of frequency and temporal coding in neuronal networks. Neuron 75:572–583. 10.1016/j.neuron.2012.08.004 - DOI - PubMed
    1. Bartos M, Manor Y, Nadim F, Marder E, Nusbaum MP (1999) Coordination of fast and slow rhythmic neuronal circuits. J Neurosci 19:6650–6660. 10.1523/JNEUROSCI.19-15-06650.1999 - DOI - PMC - PubMed
    1. Bidaye SS, Bockemühl T, Büschges A (2018) Six-legged walking in insects: how CPGs, peripheral feedback, and descending signals generate coordinated and adaptive motor rhythms. J Neurophysiol 119:459–475. 10.1152/jn.00658.2017 - DOI - PubMed
    1. Bose A, Manor Y, Nadim F (2004) The activity phase of postsynaptic neurons in a simplified rhythmic network. J Comput Neurosci 17:245–261. 10.1023/B:JCNS.0000037685.71759.1a - DOI - PubMed

Publication types

LinkOut - more resources