. 2022 Oct 3;99(14):e1499-e1510.
doi: 10.1212/WNL.0000000000200913.

Natural History of Friedreich Ataxia: Heterogeneity of Neurologic Progression and Consequences for Clinical Trial Design

Affiliations

Natural History of Friedreich Ataxia: Heterogeneity of Neurologic Progression and Consequences for Clinical Trial Design

Christian Rummey et al. Neurology. .

Abstract

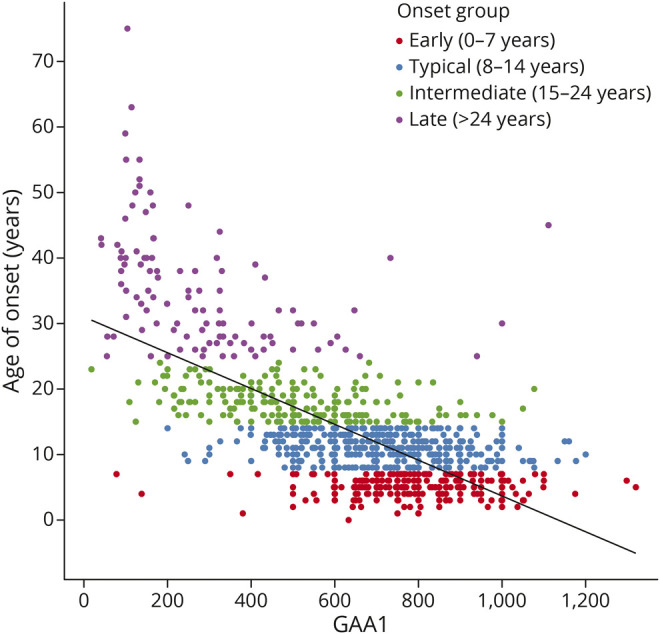
Background and objectives: The understanding of the natural history of Friedreich ataxia (FRDA) has improved considerably recently, but patterns of neurologic deterioration are not fully clarified, compromising the assessment of the clinical relevance of effects and guidance for study design. The goal of this study was to acknowledge the broad genetic diversity of the population, especially for younger individuals, and to provide analyses stratified by age to guide population selection in future studies.

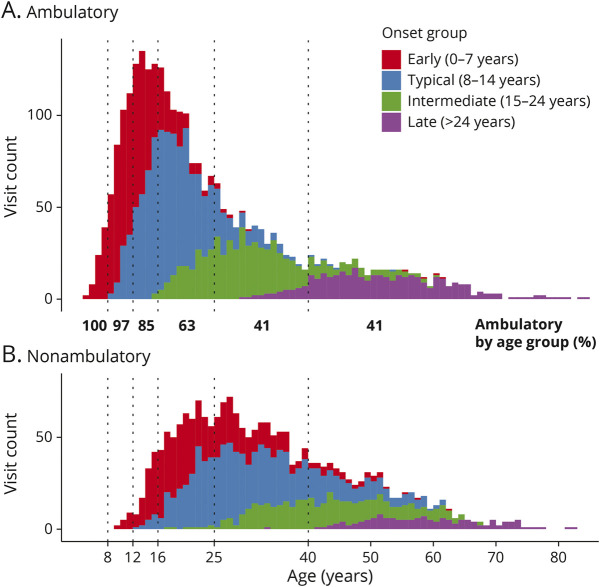
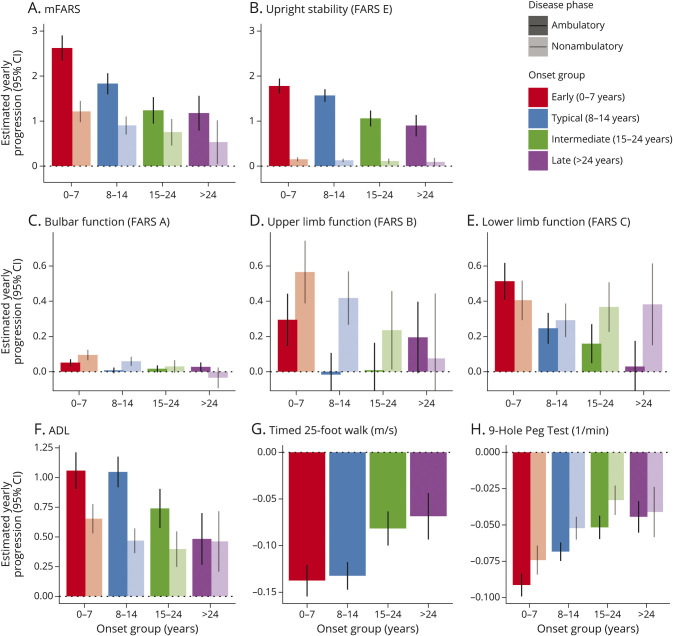
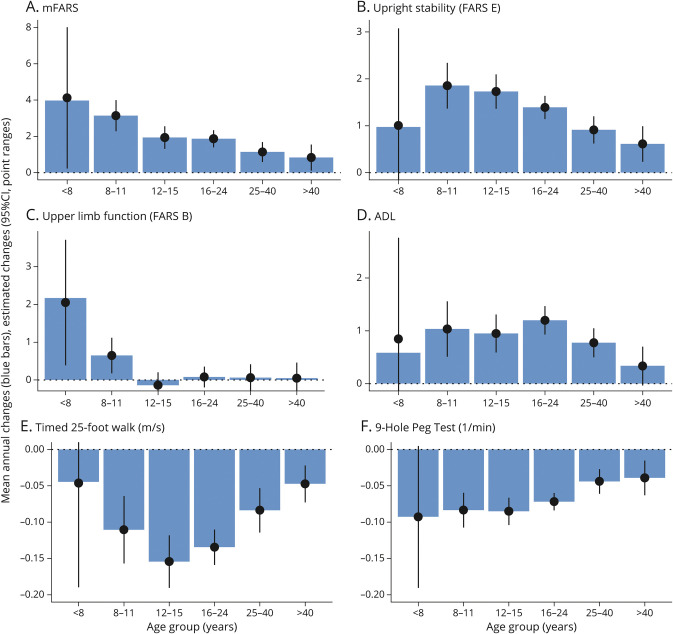
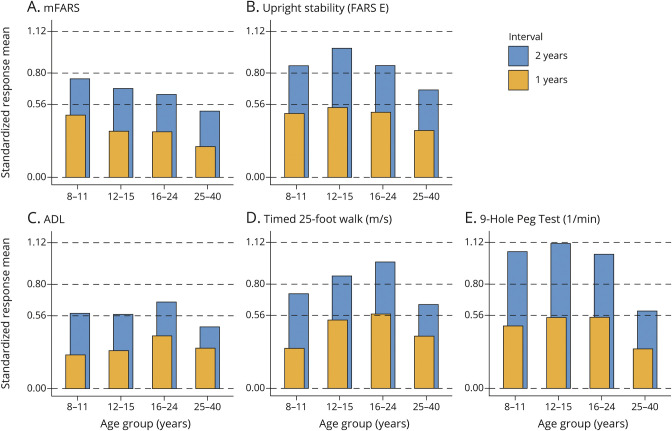
Methods: Based on a large natural history study, the FRDA Clinical Outcome Measures study that at the current data cut enrolled 1,115 participants, followed up for 5,287 yearly visits, we present results from the modified FRDA Rating Scale and its subscores. The secondary outcomes included the patient-reported activities of daily living scale, the timed 25-foot walk, and the 9-hole peg test. Long-term progression was modeled using slope analyses within early-onset, typical-onset, intermediate-onset, and late-onset FRDA. To reflect recruitment in clinical trials, short-term changes were analyzed within age-based subpopulations. All analyses were stratified by ambulation status.

Results: Long-term progression models stratified by disease severity indicated highly differential disease progression, especially at earlier ages at onset. In the ambulatory phase, decline was driven by axial items assessed by the Upright Stability subscore of the mFARS. The analyses of short-term changes showed slower progression with increasing population age due to decreasing genetic severity. Future clinical studies could reduce population diversity, interpatient variability, and the risk of imbalanced treatment groups by selecting the study population based on the functional capacity (e.g., ambulatory status) and by strict age-based stratification.

Discussion: The understanding of the diversity within FRDA populations and their patterns of functional decline provides an essential foundation for future clinical trial design including patient selection and facilitates the interpretation of the clinical relevance of progression detected in FRDA.


Figures

Figure 1
Figure 1. Correlation of Age at Onset (AOO) With the Length of the Shorter FXN Gene GAA Repeat Expansion (GAA1)
Figure 2
Figure 2. Visit Structure of the FACOMS Cohort
Number of visits by ambulation, onset features, and current age. Age groups (see text) are enclosed by vertical dotted lines. Bold numbers show percentages of visits performed ambulatory within age groups. FACOMS = Friedreich Ataxia Clinical Outcome Measures Study.
Figure 3
Figure 3. Estimated Yearly Progression by Onset Group and Ambulation Status
mFARS (A), upright stability/FARS E (B), and FARS a, B, and C (C–E) activities of daily living (F), the timed 25-foot walk (G), 9-hole peg test (H). Note the differential y-axis scaling error bars represent 95% CIs. mFARS = modified Friedreich Ataxia Rating Scale.
Figure 4
Figure 4. The Mean Annual Changes in Ambulatory Patients by Current Age Group
mFARS (A), upright stability/FARS E (B), upper limb function/FARS B (C), activities of daily living (D), the timed 25-foot walk (E), 9-hole peg test (F). mFARS = modified Friedreich Ataxia Rating Scale.
Figure 5
Figure 5. Responsiveness of Selected Endpoints as Expressed by Standard Response Mean Values
One-year and 2-year intervals, for ambulatory patients with current age 8–40 years. Using typical assumptions (80% power, α = 0.05, a treatment reduces progression by 50%), the y-axis labels correspond to 200 patients (SRM = 0.56), 100 patients (SRM = 0.80) and 50 patients (SRM = 1.12). SRM = standard response mean.

References

    1. Delatycki MB, Bidichandani SI. Friedreich ataxia- pathogenesis and implications for therapies. Neurobiol Dis. 2019;132:104606. doi: 10.1016/j.nbd.2019.104606. - DOI - PubMed
    1. Galea CA, Huq A, Lockhart PJ, et al. . Compound heterozygous FXN mutations and clinical outcome in friedreich ataxia: insights from Frataxin Structure and Function. Ann Neurol. 2016;79(3):485-495. doi: 10.1002/ana.24595. - DOI - PubMed
    1. Rodden LN, Chutake YK, Gilliam K, et al. . Methylated and unmethylated epialleles support variegated epigenetic silencing in Friedreich ataxia. Hum Mol Genet. 2021;29(23):3818-3829. doi: 10.1093/hmg/ddaa267. - DOI - PMC - PubMed
    1. Metz G, Coppard N, Cooper JM, et al. . Rating disease progression of Friedreich's ataxia by the international cooperative ataxia rating scale: analysis of a 603-patient database. Brain. 2013;136(pt 1):259-268. doi: 10.1093/brain/aws309. - DOI - PMC - PubMed
    1. Reetz K, Dogan I, Costa AS, et al. . Biological and clinical characteristics of the European Friedreich's Ataxia Consortium for Translational Studies (EFACTS) cohort: a cross-sectional analysis of baseline data. Lancet Neurol. 2015;14(2):174-182. doi: 10.1016/S1474-4422(14)70321-7. - DOI - PubMed