. 2022 Jul 11;13(1):4007.
doi: 10.1038/s41467-022-31248-w.

Blocking glycine utilization inhibits multiple myeloma progression by disrupting glutathione balance

Affiliations

Blocking glycine utilization inhibits multiple myeloma progression by disrupting glutathione balance

Jiliang Xia et al. Nat Commun. .

Abstract

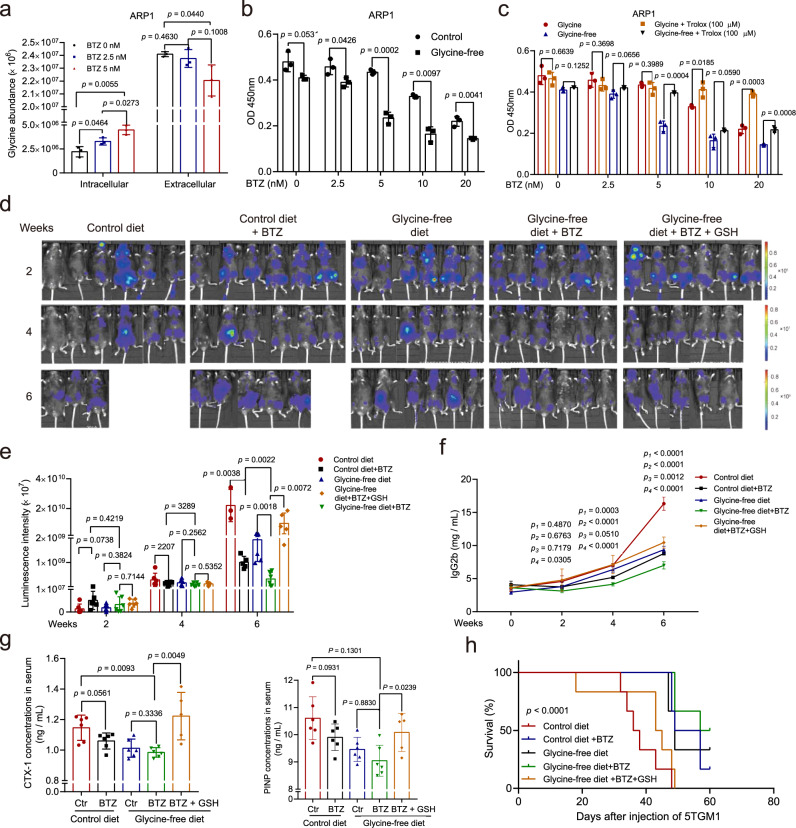
Metabolites in the tumor microenvironment are a critical factor for tumor progression. However, the lack of knowledge about the metabolic profile in the bone marrow (BM) microenvironment of multiple myeloma (MM) limits our understanding of MM progression. Here, we show that the glycine concentration in the BM microenvironment is elevated due to bone collagen degradation mediated by MM cell-secreted matrix metallopeptidase 13 (MMP13), while the elevated glycine level is linked to MM progression. MM cells utilize the channel protein solute carrier family 6 member 9 (SLC6A9) to absorb extrinsic glycine subsequently involved in the synthesis of glutathione (GSH) and purines. Inhibiting glycine utilization via SLC6A9 knockdown or the treatment with betaine suppresses MM cell proliferation and enhances the effects of bortezomib on MM cells. Together, we identify glycine as a key metabolic regulator of MM, unveil molecular mechanisms governing MM progression, and provide a promising therapeutic strategy for MM treatment.


Conflict of interest statement

The authors declare no competing interests.

Figures

Fig. 1
Fig. 1. Glycine is elevated in the BM microenvironment and linked to poor prognosis in MM.
a, b (a) Plots of OPLS-DA scores for the BM liquid and PB plasma derived from MM patients and HDs (BM-training set: n = 10 in HD group, n = 20 in MM group; BM-validation set: n = 11 in HD group, n = 30 in MM group; PB: n = 26 in HD group, n = 31 in MM group), and (b) differential metabolites in all sets based on VIP, FC, and p-value (MetaboAnalyst 5.0 software with unpaired two-sided t-test). c Left: targeted metabolomics assays of glycine in the BM liquid derived from HDs (n = 31) and newly diagnosed MM patients (n = 110); Right: targeted metabolomics assays of glycine in the PB plasma derived from HDs (n = 31) and newly diagnosed MM patients (n = 110). Results represent means ± SD; A unpaired two-sided t-test was applied. d The correlation of glycine concentrations from the BM liquid and PB plasma (n = 110; two- sided Pearson correlation analysis). e ROC curves drawn based on glycine concentrations using subjects derived from HDs and newly diagnosed MM patients (n = 110). Source data are provided as a Source Data file.
Fig. 2
Fig. 2. Deprivation of exogenous glycine inhibits MM cell growth both in vitro and in vivo.
a Targeted assays of glycine in ARP1, MM1.S, and 5TGM1 cells cultured in RPMI 1640 media supplemented with or without glycine (10 mg/L). b Growth curves of ARP1, MM1.S, and 5TGM1 cells cultured in RPMI 1640 media supplemented with or without glycine (10 mg/L). n = 3 independent experiments; Results represent means ± SD; Significance was analyzed with an unpaired two-sided t-test in (a, b). c Clonogenic analysis of ARP1, MM1.S, and 5TGM1 cells cultured in RPMI 1640 media with or without glycine supplementation (10 mg/L) (n = 3 independent experiments; Results represent means ± SD). d Schematic of in vivo experiments. e Targeted assays of glycine in serum derived from 5TGM1 MM mice fed with control diet (n = 6 at week 0, n = 4 at week 6) or glycine-free diet (n = 6 at week 0 and 6). f Tumor-associated luminescence intensity in live 5TGM1 MM mice fed with control diet or glycine-free diet. g Quantification of luminescence intensity in 5TGM1 MM mice fed with control diet or glycine-free diet at 2, 4, 6, and 8 weeks. h The concentrations of IgG2b in mouse serum as detected with ELISA (Week 0: n = 6 in each group, Week 2: n = 6 in each group, Week 4: n = 4 in control diet group, n = 6 in glycine-free group, Week 8: n = 2 in control diet group, n = 6 in glycine-free group). i Micro-CT images of femurs derived from 5TGM1 MM mice fed with control diet or glycine-free diet. j Quantification of bone microstructural parameters, namely BV/TV, Tb. N, Tb. Sp, and Tb. Th (n =  5 in each group). k, l Quantification of bone resorption marker CTX-I and bone formation marker PINP (n = 4 in control diet group, n = 6 in glycine-free diet group). Results represent means ± SD; Significance was analyzed with an unpaired two-sided t-test in (e, g, h, jl). m The survival curves of 5TGM1 MM mice fed with control diet or glycine-free diet (Log-rank test). Source data are provided as a Source Data file.
Fig. 3
Fig. 3. Glycine-derived GSH contributes to the proliferation of MM cells.
a Schematic of the glycine metabolic flux experiments. b Schematic of glycine metabolism in MM cells. c Growth curves of ARP1 cells cultured with glycine-free media treatment with or without GSH. d GSH levels in ARP1 cells cultured with different doses of glycine for 24 h. n = 3 independent experiments; Results represent means ± SD; Unpaired two-sided t-test was used in (c, d). e GSH levels in tumor knots derived from B-NDG mice fed with control diet or glycine-free diet (n =  3 mice; Unpaired two-sided t-test). f Live imaging of the tumor-associated luminescence intensity of 5TGM1 MM mice. g Quantification of tumor-associated luminescence intensity in the 5TGM1 MM mice cohorts shown in panel (f). h The concentrations of IgG2b in mouse serum as detected with ELISA (Week 0 and 2: n = 6 in each group, Week 4: n = 5 in control + GSH group, n = 6 in other groups, Week 6: n = 6 in control group and glycine-free group, n = 2 in control + GSH group, n = 5 in glycine-free + GSH group, p1 represent the significance between control group and control + GSH group, p2 represent the significance between glycine-free group and glycine-free + GSH group). Results represent means ± SD; Unpaired two-sided t-test was used in (g, h). i The survival curves of 5TGM1 MM mice fed with the control or glycine-free diets with or without GSH (n = 6 for each group; Log-rank test). j The expression profile of glycine metabolism-related genes in ARP1 cells cultured with or without glycine. k Schematic of glycine metabolism. l Representative images of the immunofluorescence analysis of γ-H2AX (red) protein expression in ARP1 cells cultured with or without glycine for 48 h (n = 50 images in each group; Results represent means ± SD; Unpaired two-sided t-test). m Western blotting of γ-H2AX, p-ATR, p-ATM, p-CHK1, p-CHK2, CDC25A, and β-actin in ARP1 cells cultured with or without glycine and/or GSH for 48 h. Source data are provided as a Source Data file.
Fig. 4
Fig. 4. Knockdown of GLDC impairs the proliferation of MM cells.
a Schematic of the glycine cleavage system. b The ratio of NADH/NAD + in ARP1 and 5TGM1 cells cultured with or without exogenous glycine. c Western blotting of GLDC, GCSH, DLD, AMT, and β-actin in ARP1 cells cultured with or without glycine for 24 h. d Western blotting of GLDC and β-actin in ARP1 cells with Scramble (Scr), GLDC shRNA1 (GLDCsh1) and GLDCsh2. e Growth curves of ARP1 cells with Scr, GLDCsh1, or GLDCsh2. f GSH levels in ARP1 cells with Scr and GLDCsh1. g The ratio of NADH / NAD+ in ARP1 cells with Scr or GLDCsh1. h Growth curves of ARP1 cells with Scr or GLDCsh1 with or without GSH treatment. i Clonogenic analysis of ARP1 cells with Scr or GLDCsh1 with or without GSH treatment. n = 3 independent experiments; Results represent means ± SD; Significance was analyzed with unpaired two-sided t-test in (b, fh) (p1 represent the significance between Scr and GLDCsh1, p2 represent the significance between GLDCsh1 and GLDCsh1 + GSH), with ANOVA one-way test in (e). j Western blotting of GLDC, p-ATR, p-CHK1, CDC25A, γ-H2AX, and β-actin in ARP1 cells with Scr or GLDCsh1 with or without GSH. k Tumor knots developed in B-NDG mice injected with ARP1 cells with Scr (n = 3 mice), GLDCsh1 without GSH treatment (n = 3 mice), or GLDCsh1 cells with GSH treatment (2 mg/kg) (n = 3 mice). l Analysis of tumor volumes in Scr, ARP1 GLDCsh1, and ARP1 GLDCsh1 + GSH mice. m GSH levels in tumor knots derived from Scr, ARP1 GLDCsh1, and ARP1 GLDCsh1 + GSH mice. n = 3 mice; Results represent means ± SD; Significance was analyzed with an unpaired two-sided t-test in (l) (p1 represent the significance between Scr and GLDCsh1, p2 represent the significance between GLDCsh1 and GLDCsh1 + GSH), m. n Western blotting of GLDC, p-ATR, p-CHK1, CDC25A, γ-H2AX, and β-actin in tumor knots derived from Scr, ARP1 GLDCsh1, and ARP1 GLDCsh1 + GSH mice. Source data are provided as a Source Data file.
Fig. 5
Fig. 5. Glycine deprivation sensitizes MM cells to BTZ.
a Intracellular and extracellular glycine concentrations in ARP1 cells treated with different doses of BTZ (0, 2.5, or 5 nM) for 24 hr. b ARP1 cells cultured with (10 mg/L) or without exogenous glycine were treated with different doses of BTZ (0, 2.5, 5, 10, or 20 nM) for 48 h, followed by a CCK-8 assay. c ARP1 cells cultured with (10 mg/L) or without exogenous glycine were treated with different doses of BTZ (0, 2.5, 5, 10, or 20 nM) and with or without Trolox (100 μM) for 48 hr, followed by a CCK-8 assay. n = 3 independent experiments; Results represent means ± SD; Significance was analyzed with an unpaired two-sided nonparametric t-test in (ac). d Live imaging of tumor-associated luminescence intensity in 5TGM1 MM mice in the groups fed with the control diet (n = 6 mice), fed with control diet and treated with BTZ (1 mg/kg, 3 times/week, n = 6 mice), fed with glycine-free diet (n = 6 mice), fed with glycine-free diet and treated with BTZ (1 mg/kg, 3 times/week, n = 6 mice), or fed with glycine-free diet and treated with BTZ (1 mg/kg, 3 times/week) plus GSH (2 mg/kg, 3 times/week) (n = 6 mice). e, f The luminescence intensities and serum IgG2b concentrations of the five groups of 5TGM1 MM mice. g Quantification of bone resorption marker CTX-I and formation marker PINP. Results represent means ± SD; Significance was analyzed with an unpaired two-sided nonparametric t-test in e, f (p1 represent the significance between contro and control + BTZ, p2 represent the significance between glycine-free and glycine-free + BTZ, p3 represent the significance between control + BTZ and glycine-free + BTZ, p4 represent the significance between glycine-free + BTZ and glycine-free + BTZ + GSH), g. h The survival curves of the five groups of 5TGM1 MM mice (Log-rank test). Source data are provided as a Source Data file.
Fig. 6
Fig. 6. Inhibiting glycine utilization via SLC6A9 knockdown or betaine treatment reduces proliferation and enhances the effect of BTZ on MM cells.
a SLC6A5 and SLC6A9 expression in ARP1 treated with BTZ. b Glycine concentrations in ARP1 Scr, ARP1 SLC6A9sh1, and ARP1 SLC6A9sh2 cells. c GSH levels in ARP1 Scr, ARP1 SLC6A9sh1, and ARP1 SLC6A9sh2 cells. d Clonogenic analysis of ARP1 Scr, ARP1 SLC6A9sh1, and ARP1 SLC6A9sh2 cells with or without BTZ treatment. e CCK-8 assay of ARP1 Scr, ARP1 SLC6A9sh1, and ARP1 SLC6A9sh2 cells treated with different doses of BTZ. f The chemical structures of glycine, N,N-Dimethylglycine, and betaine. g Cell viability of ARP1 and 5TGM1 treated with N,N-Dimethylglycine or betaine. h Glycine levels in ARP1 and 5TGM1 cells with or without betaine treatment. i GSH levels in ARP1 and 5TGM1 with or without betaine treatment. j Live imaging luminescence intensity in 5TGM1 MM mice treated with physiological saline, BTZ (1 mg/kg), or betaine (500 mg/kg) (n =  5 for each group). k Quantification of tumor-associated luminescence intensity in 5TGM1 MM mice at 2 (n = 5 in each group), 4 (n = 5 in each group), and 6 (n = 4 in control group, n = 5 in other groups) weeks. l IgG2b concentrations in 5TGM1 MM mice treated with physiological saline, BTZ, or betaine. m The survival curves of 5TGM1 MM mice (Log-rank test). n The combination index of betaine and BTZ treatment in ARP1 was analyzed by the Chou–Talalay method. o The ROS levels in ARP1 cells with or without BTZ and betaine treatment. p CCK-8 assays of ARP1 treated with different doses of BTZ and with or without betaine and GSH. q Western blotting of cleaved caspase3, PARP, γ-H2AX, and β-actin in ARP1 and 5TGM1 with or without BTZ, betaine and GSH. n = 3 independent experiments; Results represent means ± SD in (ae, gi, o, p). Unpaired two-sided t-test was used in (ac, e, h, i, k, o, p); paired two-sided t-test was used in was applied in (l). Source data are provided as a Source Data file.
Fig. 7
Fig. 7. Bone collagen degradation, mediated by MM cell-secreted MMP13, increases glycine levels in MM patients.
a Schematic of the components of the bone matrix. b Untargeted metabolomics assays of glycine, l-proline, l-glutamic acid, and l-alanine in BM liquid derived from MM patients (n = 20 in training set group, n = 30 in validation set group;) and HDs (n = 10 in training set group, n = 11 in validation set group). c Serum glycine concentrations in MM patients with (n = 12) or without (n = 24) bone destruction. d The correlations between serum glycine concentrations and serum CTX-I or PINP in MM patients (n = 26). e The correlation between serum MMP13 and serum glycine concentrations in MM patients (n = 87). Two-sided Pearson correlation analysis was applied in (d, e). f Schematic of in vivo experimental workflow. g Tumor-associated luminescence intensity in 5TGM1 MM mice treated with physiological saline (Control) or CL-82198 (2 mg/kg) (n = 4 for each group). h Quantification of the tumor-associated luminescence intensity shown in panel g (n =  4 for each group). i Micro-CT images of femurs derived from 5TGM1 MM mice fed with control diet or glycine-free diet. j Quantification of bone microstructural parameters, including BV/TV, Tb. N, Tb. Sp, and Tb. Th (n =  4 for each group). k Quantification of serum CTX-I and PINP in mice with or without CL-82198 treatment (n =  4 for each group). l Glycine concentrations in serum derived from 5TGM1 MM mice treated with physiological saline or CL-82198 (2 mg/kg) (n =  4 for each group). m Schematic of our working hypothesis. Results represent means ± SD; Significance was analyzed with an unpaired two-sided t-test in (b, c, j, h, k, l). Source data are provided as a Source Data file.

References

    1. Palumbo A, Anderson K. Multiple myeloma. N. Engl. J. Med. 2011;364:1046–1060. doi: 10.1056/NEJMra1011442. - DOI - PubMed
    1. Zhou W, et al. NEK2 induces drug resistance mainly through activation of efflux drug pumps and is associated with poor prognosis in myeloma and other cancers. Cancer Cell. 2013;23:48–62. doi: 10.1016/j.ccr.2012.12.001. - DOI - PMC - PubMed
    1. DeBerardinis, R. J., Lum, J. J., Hatzivassiliou, G. & Thompson, C. B. The biology of cancer: metabolic reprogramming fuels cell growth and proliferation. Cell Metab.7, 11–20 (2008). - PubMed
    1. Loo JM, et al. Extracellular metabolic energetics can promote cancer progression. Cell. 2015;160:393–406. doi: 10.1016/j.cell.2014.12.018. - DOI - PMC - PubMed
    1. Ward PS, Thompson C. Metabolic reprogramming: a cancer hallmark even warburg did not anticipate. Cancer Cell. 2012;21:297–308. doi: 10.1016/j.ccr.2012.02.014. - DOI - PMC - PubMed

Publication types