. 2022 Jul 11;12(1):11748.
doi: 10.1038/s41598-022-15640-6.

Simple gene signature to assess murine fibroblast polarization

Affiliations

Simple gene signature to assess murine fibroblast polarization

Emmanuel Ledoult et al. Sci Rep. .

Abstract

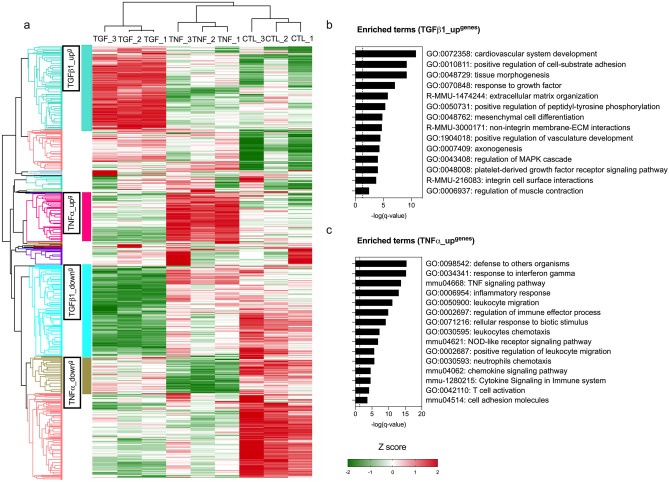
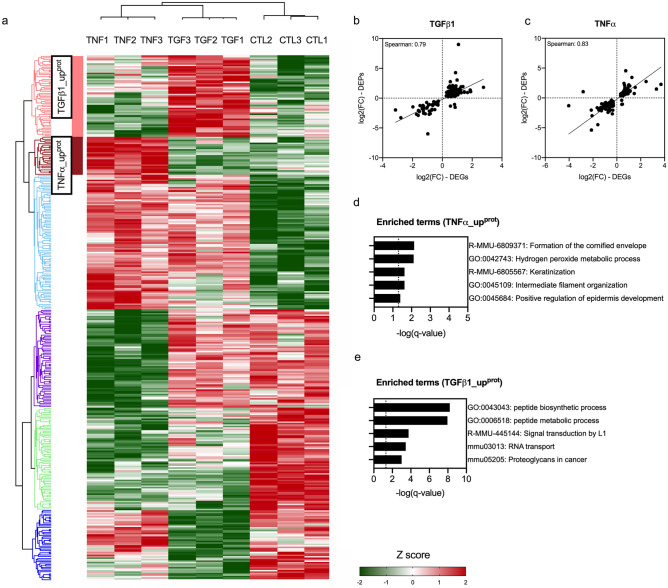
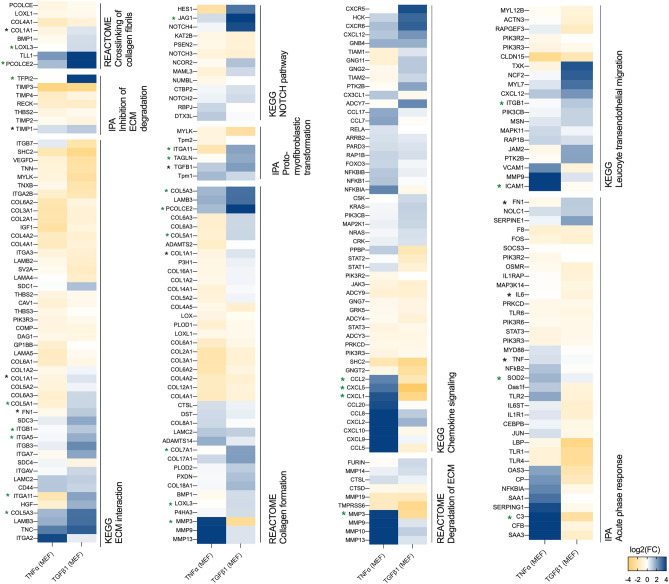
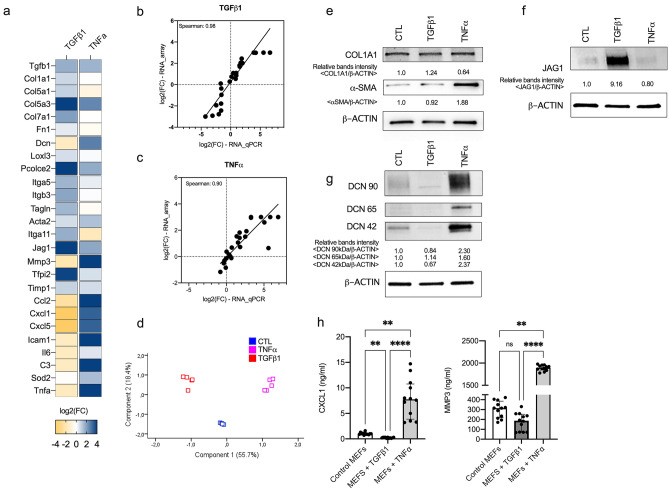
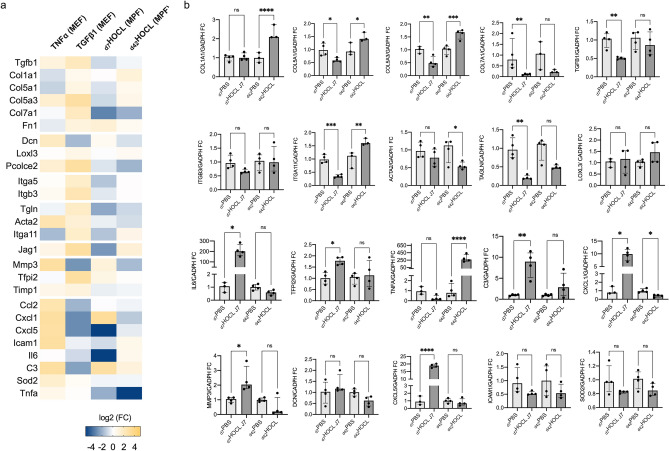
We provide an original multi-stage approach identifying a gene signature to assess murine fibroblast polarization. Prototypic polarizations (inflammatory/fibrotic) were induced by seeded mouse embryonic fibroblasts (MEFs) with TNFα or TGFß1, respectively. The transcriptomic and proteomic profiles were obtained by RNA microarray and LC-MS/MS. Gene Ontology and pathways analysis were performed among the differentially expressed genes (DEGs) and proteins (DEPs). Balb/c mice underwent daily intradermal injections of HOCl (or PBS) as an experimental murine model of inflammation-mediated fibrosis in a time-dependent manner. As results, 1456 and 2215 DEGs, and 289 and 233 DEPs were respectively found in MEFs in response to TNFα or TGFß1, respectively. Among the most significant pathways, we combined 26 representative genes to encompass the proinflammatory and profibrotic polarizations of fibroblasts. Based on principal component analysis, this signature deciphered baseline state, proinflammatory polarization, and profibrotic polarization as accurately as RNA microarray and LC-MS/MS did. Then, we assessed the gene signature on dermal fibroblasts isolated from the experimental murine model. We observed a proinflammatory polarization at day 7, and a mixture of a proinflammatory and profibrotic polarizations at day 42 in line with histological findings. Our approach provides a small-size and convenient gene signature to assess murine fibroblast polarization.


Conflict of interest statement

The authors declare no competing interests.

Figures

Figure 1
Figure 1
Transcript expression profiles of control, TGFß1-treated and TNFα-treated MEFs using RNA microarrays. (a) Heatmap summarizing DEGs in TGFß1- (5 ng/ml) or TNFα- (10 ng/ml) treated MEFs for 24 h compared to controls (untreated MEFs) (q-value < 0.05) after normalization with Z-score. Hierarchical clustering was constructed with Euclidean distance using R software. N = 3 biological replicas (3 independent experiments). (bc) Enrichment analysis summarizing the most representative up-regulated pathways in TGFß1_upgenes (b) and TNFα_upgenes (c) using Metascape (http://metascape.org/gp/index.html#/main/step1).
Figure 2
Figure 2
Proteome analysis of control, TGFß1- and TNFα-treated MEFs using LC–MS/MS. (a) Heatmap summarizing DEPs in TGFß1- (5 ng/ml) or TNFα- (10 ng/ml) treated MEFs for 72 h compared to untreated MEFs (controls; q-value < 0.05) after normalization with Z-score. Hierarchical clustering was constructed with Euclidean distance using Perseus software (https://maxquant.net/perseus). (bc) Spearman correlation of DEGs expressed as log2(FC) assessed by RNA microarrays and DEPs as log2(FC) assessed by LC–MS/MS in TGFß1 (b; n = 150) and TNFα- treated (c; n = 110) MEFs compared to control MEFs. (de) Enrichment analysis summarizing the most representative up-regulated pathways in TGFß1_upprot and in TNFα_upprot (q-value < 0.05) using Metascape (http://metascape.org/gp/index.html#/main/step1). N = 3 biological replicas (3 independent experiments).
Figure 3
Figure 3
Gene expression of pathways related to the inflammatory response and to ECM organization in TGFß1- and TNFα-treated MEFs. Gene expression of pathways in TGFß1- and TNFα-treated MEFs expressed as log2 (Fold change vs. controls) assessed by RNA microarrays. Gene lists come from molecular signatures database (MSigDB) (http://software.broadinstitute.org/gsea/msigdb/index.jsp) and Ingenuity Pathway Analysis (Qiagen, Inc) (https://digitalinsights.qiagen.com). Only significant genes are presented in heatmaps (q-value < 0.05) generated using Prism (https://www.graphpad.com/scientific-software/prism/). Candidate genes and classical genes are respectively marked with green or black mark.
Figure 4
Figure 4
Gene signature expression. (a) Genes of gene set differentially expressed in TNFα-treated, TGFß1-treated MEFs compared to control MEFs assessed by RT-qPCR. Fold changes are log2-transformed and expressed as a double gradient colormap. Log2 values of fold changes are censored at − 4 or 4 for better viewing. (bc) Spearman correlations of genes expressed as log2(FC) assessed by RNA microarray (at 24 h) and by RT-qPCR (at 24 h) in TGFß1- (b) and TNFα-treated (c) MEFs compared to control MEFs. (d) Principal component analysis of MEFs (controls, treated by TGFß1 or TNFα) assessed by RT-qPCR. (eg) Western Blot analysis of level of COL1A1 (e), αSMA (e), JAG1 (f), and DCN (g) in control, TGFß1- and TNFα-treated MEFs. Intensities of specific bands was measured by densitometry. ß-ACTIN was used for normalization of data. Experiment is representative of n = 3 independent experiments. Full unedited Western Blot are provided in supplementary Figs. S8–S10. (h) Quantification of CXCL1 (ng/ml) and MMP3 (ng/ml) in the supernatant sample (n = 12/group; 3 independent experiments). Numbers are expressed as median with IQR.
Figure 5
Figure 5
Inflammation-mediated fibrosis model. (a) Experimental procedure and sample collection times. Two independent experiments: E1 at the inflammatory stage (early stage); E2 at the fibrotic stage (late stage); (b) Dermal thickness estimated by measuring the distance between the dermoepidermal junction and the junction between the dermis and subcutaneous fat at 20X magnification using ImageJ morphometric software. Twenty random measurements were performed per section. (c) Collagen deposition in the skin evaluated using Picrosirius red staining expressed as % of the area occupied by collagen. (d) Representative sections of skin samples from PBS mice and HOCl mice under light microscopy after HE staining. (e) Representative sections of skin samples from PBS mice and HOCl mice at each time point, observed by light microscopy after staining with Picrosirius red. Medians with IQR are shown.
Figure 6
Figure 6
Gene signature expression assessed by RT-qPCR in HOCL mice and in PBS mice at day 7 and day 42. (a) Heatmap showing the transcript gene set expression assessed by RT-qPCR from (i) TNFα-treated MEFs (compared to control MEFs), (ii) TGFß1-treated MEFs (compared to control MEFs), (iii) d7HOCL MPFs (compared to d7PBS MPFs), and (iv) d42HOCL MPFs (compared to d42PBS MPFs). Fold changes are log2-transformed and expressed as a double gradient colormap. Log2 values of fold changes are censored at -5 or 5 for better viewing. The heatmap was generated using Prism (https://www.graphpad.com/scientific-software/prism/), (b) RT-qPCR results. Numbers are expressed as median fold change (IQR) compared to PBS at day 7 or day 42. P-value: *** ≤ 0.001, ** ≤ 0.01, * ≤ 0.05. ns: > 0.05.

References

    1. Hynes RO, Naba A. Overview of the matrisome—An inventory of extracellular matrix constituents and functions. Cold Spring Harb. Perspect. Biol. 2012;4(1):a004903. doi: 10.1101/cshperspect.a004903. - DOI - PMC - PubMed
    1. Bonnans C, Chou J, Werb Z. Remodelling the extracellular matrix in development and disease. Nat. Rev. Mol. Cell Biol. 2014;15(12):786–801. doi: 10.1038/nrm3904. - DOI - PMC - PubMed
    1. Wynn TA. Cellular and molecular mechanisms of fibrosis. J. Pathol. 2008;214(2):199–210. doi: 10.1002/path.2277. - DOI - PMC - PubMed
    1. Sonnylal S, et al. Postnatal induction of transforming growth factor beta signaling in fibroblasts of mice recapitulates clinical, histologic, and biochemical features of scleroderma. Arthritis Rheum. 2007;56(1):334–344. doi: 10.1002/art.22328. - DOI - PubMed
    1. Malmström J, et al. Transforming growth factor-beta 1 specifically induce proteins involved in the myofibroblast contractile apparatus. Mol. Cell Proteom. 2004;3(5):466–477. doi: 10.1074/mcp.M300108-MCP200. - DOI - PubMed