. 2022 Aug;3(8):976-993.
doi: 10.1038/s43018-022-00405-x. Epub 2022 Jul 11.

Transition to a mesenchymal state in neuroblastoma confers resistance to anti-GD2 antibody via reduced expression of ST8SIA1

Affiliations

Transition to a mesenchymal state in neuroblastoma confers resistance to anti-GD2 antibody via reduced expression of ST8SIA1

Nathaniel W Mabe et al. Nat Cancer. 2022 Aug.

Abstract

Immunotherapy with anti-GD2 antibodies has advanced the treatment of children with high-risk neuroblastoma, but nearly half of patients relapse, and little is known about mechanisms of resistance to anti-GD2 therapy. Here, we show that reduced GD2 expression was significantly correlated with the mesenchymal cell state in neuroblastoma and that a forced adrenergic-to-mesenchymal transition (AMT) conferred downregulation of GD2 and resistance to anti-GD2 antibody. Mechanistically, low-GD2-expressing cell lines demonstrated significantly reduced expression of the ganglioside synthesis enzyme ST8SIA1 (GD3 synthase), resulting in a bottlenecking of GD2 synthesis. Pharmacologic inhibition of EZH2 resulted in epigenetic rewiring of mesenchymal neuroblastoma cells and re-expression of ST8SIA1, restoring surface expression of GD2 and sensitivity to anti-GD2 antibody. These data identify developmental lineage as a key determinant of sensitivity to anti-GD2 based immunotherapies and credential EZH2 inhibitors for clinical testing in combination with anti-GD2 antibody to enhance outcomes for children with neuroblastoma.


Conflict of interest statement

Competing interests

The remaining authors declare no competing interests.

Figures

Extended Data Fig. 1 |
Extended Data Fig. 1 |. Low GD2 expression is correlated with developmental lineage in neuroblastoma cell culture models.
a, Bar plot showing the percentage of GD2 + cells for each cell line from Fig. 1a (n = 12 GD2-high, n = 11 GD2-low). Data are shown as mean ± s.d. b, Scatterplot comparing adrenergic (ADRN) and mesenchymal (MES) composite scores for neuroblastoma cell lines in the CCLE. ADRN and MES scores were calculated based on average log2(TPM + 1) expression of all genes within each gene set. Mesenchymal cell lines were called based on MES score ≥ 4.1 and ADRN score ≤ 5. c, Heatmap showing median-center, Zz-score normalized RNA sequencing for adrenergic (ADRN, green) and mesenchymal (MES, purple) genes in all neuroblastoma cell lines with RNA-sequencing data available in the CCLE. d, Semi-supervised, hierarchical heatmap showing Zz-score normalized expression data for mesenchymal (purple) and adrenergic (green) gene sets in cell lines analyzed by differential gene expression analysis and for which GD2 status is shown in Fig. 1a. e, Western blot showing expression of mesenchymal markers Vimentin, fibronectin, TAZ and YAP1 and adrenergic marker PHOX2B in SH-EP and SH-SY5Y cell lines. GAPDH is shown as a control. Note that the GAPDH panel is the same bands are shown in Fig. 4a. f, Flow cytometry panels demonstrating CD16 staining in two healthy, donor-derived NK cell cultures. g, Cell viability for SH-SY5Y or SH-EP cell lines co-cultured with NK cells at an E:T ratio of 1:2 for 48 h and in the presence or absence of 1 μg/mL dinutuximab (n = 3 samples per treatment group). Data are shown mean ± s.d. Significance determined by one-way ANOVA and Tukey’s post-hoc test. ns = not significant. Representative data from western blots were confirmed in two independent experiments.
Extended Data Fig. 2 |
Extended Data Fig. 2 |. GD2 density influences response to anti-GD2 antibody.
a, Parental Kelly cells were sorted based on GD2 expression into Kelly-GD2low (red) or Kelly-GD2high (black) isogenic cell lines. b, Kelly-GD2low or Kelly-GD2high were co-cultured with blood-derived macrophages from three healthy donors and measured for phagocytosis in presence or absence of anti-GD2. Data shown is phagocytosis with dinutuximab and normalized to the control condition for that cell line. Triplicates for all three donor cultures were combined. Data are shown mean ± s.d. Significance was determined by two-tailed Mann-Whitney U test. c, Cell viability for Kelly-GD2low or Kelly-GD2high cell lines co-cultured with NK cells at an E:T ratio of 1:2 for 48 h in the presence or absence of 1 μg/mL dinutuximab (n = 3 samples per treatment group). Data are shown mean ± s.d. Significance determined by one-way ANOVA and Tukey’s post-hoc test. d, Flow cytometry for Kelly-GD2low and Kelly-GD2high cells for mesenchymal cell marker CD133 (PROM1). ns = not significant. Representative data from flow cytometry were confirmed in two independent experiments.
Extended Data Fig. 3 |
Extended Data Fig. 3 |. Induced Adrenergic-to-Mesenchymal Transition is associated with GD2 downregulation.
a, Gene Set Enrichment Analysis was performed with the neuroblastoma-specific adrenergic or mesenchymal gene signatures for RNA sequencing from vehicle or doxycycline-treated SK-N-BE(2)-tetON-PRRX1 and KP-N-YN-tetON-PRRX1 cell lines. q-values are shown. b, Cell viability for KP-N-YN induced AMT models co-cultured with NK cells at an E:T ratio of 1:2 in the presence or absence of 1 μg/mL dinutuximab for 8 h (n = 4 samples per treatment group). Data are shown as mean ± s.d. Significance determined by one-way ANOVA and Tukey’s post-hoc test. c, Western blot showing mesenchymal (Vimentin, TAZ, NOTCH3IC) or adrenergic (PHOX2A) markers in parental or NOTCH3IC-expressing SK-N-BE(2) cells. GAPDH is included as a control. d, Representative micrographs (20X) of parental, PRRX1-, or NOTCH3IC-expressing SK-N-BE(2) cells. e, Flow cytometry analysis of GD2 for NOTCH3IC-overexpressing SK-N-BE(2) cells. ns = not significant. Representative data from flow cytometry and western blots were confirmed in two independent experiments.
Extended Data Fig. 4 |
Extended Data Fig. 4 |. Low ST8SIA1 expression correlates with low surface GD2 and mesenchymal features.
a, Schematic showing the complete ganglioside synthesis pathway. Enzymes responsible for conversion of each ganglioside are labeled in bold and branch points are colored. b, Parental SH-EP (top) or CHLA-255 (bottom) cell lines were sorted based on GD2 expression into GD2low (red) or GD2high (black) isogenic cell lines, respectively. c, qPCR analysis comparing expression for ST8SIA1, B4GALNT1 and ST3GAL5 in the SH-EP-GD2high and SH-EP-GD2low (top) or CHLA-255-GD2high and CHLA-255-GD2low (bottom) isogenic cell line pairs. Data derived from a single experiment with 4 technical replicates, experiment was completed once. d, Cell viability for Kelly-GD2low and NB-SD with or without GD3 synthase overexpression and co-cultured with NK cells at an E:T ratio of 1:2 and in the presence of absence of 1 μg/mL dinutuximab for 8 h (n = 4 samples per treatment group). Data are shown as mean ± s.d. Significance determined by one-way ANOVA and Tukey’s post-hoc test. e, Flow cytometry plot showing GD2 expression in Kelly-GD2low, SK-N-AS and NB-SD cell lines with or without constitutive expression of ST3GAL5. f, qPCR analysis measuring ST8SIA1 expression in parental or SK-N-BE(2)-NOTCH3IC cells. Data derived from a single experiment with 4 technical replicates, experiment was repeated twice. ns = not significant. Representative data from flow cytometry were confirmed in two independent experiments.
Extended Data Fig. 5 |
Extended Data Fig. 5 |. Neuroblastoma tumors with mesenchymal properties express reduced GD3 synthase.
UMAP 2D projection plot showing integrated global gene expression for tumors (Treehouse/TARGET) and cell lines (CCLE) from 43 tumor lineages from Celligner. The neuroblastoma lineage is highlighted within the red box.
Extended Data Fig. 6 |
Extended Data Fig. 6 |. EZH2 inhibition restores GD2 expression by reversal of epigenetic silencing of GD3 synthase.
a, Flow Cytometry analysis measuring GD2 expression in LAN-5 cells. b, ChIP-seq tracks showing active histone mark H3K27ac and the repressive histone mark H3K27me3 at the ST8SIA1 locus in LAN-5 (GD2-high), NB-69 (GD2-high), SK-N-AS (GD2-low) and SK-N-BE(2)C (GD2-low) cells from GSE138314. c, Flow cytometry panel for GD2 expression in SK-N-AS cells treated with increasing concentrations of tazemetostat. d, Flow cytometry plot showing GD2 expression for CHLA255-GD2low cells treated for 21 days with 1 μM tazemetostat. e, Mean fluorescence intensity for GD2 in the flow cytometry data shown in panel d (n = 3 samples). Data are shown mean ± s.d. Significance was determined by two-tailed Student’s t-test. f, Flow cytometry panels showing GD2 expression in Ewing sarcoma cell lines SK-PN-DW, EW-8 and TC-32 treated for 21 days with 1 μM tazemetostat or the small cell lung cancer cell lines H-69 and H-82 cell lines treated for 14 days with 1 μM tazemetostat. g, Flow cytometry for GD2 expression in SK-N-AS cells treated for 21 days with 1 μM tazemetostat or treated for 21 days and given a 1-month drug holiday. Representative data from flow cytometry and western blots were confirmed in two independent experiments.
Extended Data Fig. 7 |
Extended Data Fig. 7 |. Integrated analysis of RNA-, ChIP- and ATAC-sequencing following EZH2 inhibition in SK-N-AS cells.
a, Heatmap showing H3K27me3 ChIP-seq signal at all detected H3K27me3 peaks (88,858). Heatmap is separated into genomic regions with H3K27me3 that are decreased (82,122), unchanged (2,862) or increased (3,874) with 21-day treatment with 1 μM tazemetostat in SK-N-AS cells. PC = peak center, ns = not changed, incr = increased. b, Signal enrichment profile plot showing average H3K27me3 enrichment signal for vehicle or tazemetostat treatment groups. Average signal is calculated from 88,858 H3K27me3 peaks. Average signal was normalized to background signal. Values are shown ±5 kb from the peak center. Significance was determined by two-tailed Student’s t-test for the area-under-the-curve. c, Scatterplot correlating the log2 fold change in H3K27me3 area-under-the-curve (AUC) signal with the log2 fold change in RNA expression. The number of significant genes (fold change of RNA ≥ 2 and H3K27me3 Δ log2 AUC ≤ −0.5) in each quadrant are indicated. Significance for the number of genes within a quadrant was determined by two-tailed Fisher’s exact test. d, Scatterplot correlating the log2 fold change in ATAC area-under-the-curve (AUC) with the log2 fold change in RNA expression. The number of significant genes (fold change of RNA ≥ 2 and H3K27me3 Δ log2 AUC ≥ 0.5) in each quadrant are indicated. Significance for the number of genes within a quadrant was determined by two-tailed Fisher’s exact test. e, Venn diagram showing the number of overlapping genes for which H3K27me3 signal was lost, ATAC-seq signal was gained, and RNA expression increased. ***P < 0.001.
Extended Data Fig. 8 |
Extended Data Fig. 8 |. Pathways enriched in epigenetically regulated genes from integrated RNA-, ChIP- and ATAC-sequencing following EZH2 inhibition.
Dot plot showing the significant overlap of the 575 genes of interest shown in Extended Data Fig. 7e with C2 and C5 MSigDB libraries. Categories were clustered into the top six most similar pathways. Nervous system development/differentiation-related pathways are indicated in red. Dot size indicates the extent of gene overlap with the indicated gene sets. All gene sets have an FDR of ≤ 0.05 and were calculated by one-tailed Fisher’s exact test based on the hypergeometric distribution of the overlapping 575 genes.
Extended Data Fig. 9 |
Extended Data Fig. 9 |. EZH2 inhibition increases GD2 density and response to anti-GD2 in multiple models in vivo.
a, Kelly parental cells were injected into the tail vein of NSG mice (n = 4 vehicle, n = 5 tazemetostat) and treated with 350 mg/kg tazemetostat twice daily or control. Flow cytometry panel showing GD2 expression in representative tumors measured at tumor endpoint. b, Quantification of mean fluorescence intensity for GD2 expression for all parental Kelly tumors treated with control (n = 4) or tazemetostat (n = 5). Data are shown as mean ± s.d. Significance was determined by two-tailed Student’s t-test. c, Representative flow cytometry panel for GD2 from MG63.3 osteosarcoma cells orthotopically injected into the hind leg of NSG mice (n = 4 vehicle, n = 5 tazemetostat) and treated with 350 mg/kg tazemetostat twice daily. d, Quantification of mean fluorescence intensity for GD2 expression in all MG63.3 tumors treated with or without tazemetostat. Data are shown as mean ± s.d. Significance was determined by two-tailed Student’s t-test. e, Flow cytometry panel for SK-N-AS cells injected into the tail vein of NSG mice (n = 5 per treatment group) and treated with 300 μg dinutuximab three times a week or 500 mg/kg tazemetostat twice daily alone or in combination. Note that one representative tumor from untreated and tazemetostat only groups were shown in Fig. 7A. Representative data from flow cytometry are shown for the biological replicates presented in panels a and c.
Extended Data Fig. 10 |
Extended Data Fig. 10 |. EZH2 inhibition increases anti-GD2 response in vivo.
a, Bar plots showing the population of macrophage (MP), granulocyte (Gran), monocyte (Mono) and dendritic cell (DC) populations in each treatment arm (n = 5 per arm) as determined by flow cytometry. Population percentages were determined by the following markers within CD45 + cells: macrophages: CD11b + / F4/80 + ; granulocytes: CD11b + / Ly6G + ; monocytes: CD11b + / Ly6C + ; dendritic cells: CD11c + / MHC-II + . Data are shown as mean ± s.d. Significance was determined by one-way ANOVA and Tukey’s post-hoc test. b, Bar plots showing the percent of M1 macrophages (CD86 + / MHC-II (I-A/I-E) + ) or M2 macrophages (CD163 + /CD206 + ) as a total of the macrophage population (CD11b + / F480 + ) (n = 5 per arm). Data are shown as mean ± s.d. Significance was determined by two-tailed Student’s t-test. c, Flow cytometry showing representative GD2 expression in treatment naïve or tazemetostat pretreated tumors treated with either dinutuximab or anti-GD2 CAR T cells in vivo. d,e, Immunofluorescence staining for GD2 or neuronal marker MAP2 on vehicle or tazemetostat-treated, passaged primary human cortical cells (d) or inducible embryonic stem cells (e). f, Human embryonic stem cells were differentiated into induced neurons and treated for 14 days with 1 μM tazemetostat. GD2 was measured by flow cytometry. ns = not significant. Representative data from flow cytometry were confirmed in two independent experiments.
Fig. 1 |
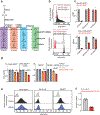
Fig. 1 |. Low GD2 expression is correlated with developmental lineage in neuroblastoma cell line models.
a, Flow cytometry measuring GD2 expression across 23 neuroblastoma cell lines. Cell lines are colored based on the percentage of GD2 cells in the population compared to the secondary antibody (≥50%; black). Dashed lines represent isotype antibody control. b,c, Differential gene expression analysis was performed between GD2+ (n = 7) and GD2 (n = 7) cell lines found in the CCLE database and rank ordered from highest to lowest expression in GD2+ cell lines. GSEA was performed on the neuroblastoma-specific, mesenchymal (b) or adrenergic (c) gene signatures. q-values are shown. d, Flow cytometry analysis showing GD2 staining in adrenergic SH-SY5Y or mesenchymal SH-EP cell lines. e, SH-EP or SH-SY5Y were co-cultured with blood-derived macrophages from three healthy donors and measured for phagocytosis in the presence or absence of dinutuximab. Data shown is phagocytosis with anti-GD2 normalized to the control condition for that cell line. Triplicates for three donors were combined (n = 9 samples). Data are shown mean ± standard deviation (s.d.). Significance determined by two-tailed Mann-Whitney U test. f, 2 ×10⁶ parental Kelly cells were injected into the flank of NSG mice, which were either treated with 300 μg dinutuximab (n = 4) intraperitoneally or untreated (n = 4) three times weekly starting on day 7. Tumors were measured with digital calipers two to three times weekly. Data are shown mean ± s.d. Significance was determined by two-way analysis of variance (ANOVA). g, Flow cytometry showing GD2 expression in dinutuximab-treated or untreated Kelly tumors shown in panel f. h, RNA sequencing was performed for Kelly-GD2low and Kelly-GD2high cell lines, and genes were rank ordered based on differential gene expression analysis. GSEA was run on the neuroblastoma-specific mesenchymal gene set. Representative data from flow cytometry and western blots were confirmed in two independent experiments. APC = allophycocyanin.
Fig. 2 |
Fig. 2 |. AMT induction represses GD2 expression and response to anti-GD2 antibody.
a, SK-N-BE(2) and KP-N-YN cell lines were infected with a tetON-PRRX1 transcription factor conjugated to HA. Cell lines were cultured for 21 days in the presence of 500 ng ml−1 doxycycline (dox), and protein lysates were measured for expression of mesenchymal markers PRRX1, vimentin, TAZ, YAP1, fibronectin and adrenergic marker PHOX2A. GAPDH is a loading control. b, Volcano plots showing differential gene expression analysis from RNA sequencing for doxycycline-treated or naive SK-N-BE(2)-PRRX1 and KP-N-YN-PRRX1 cell lines. Genes were colored based on their belonging in adrenergic (blue) or mesenchymal (red) gene sets. Venn diagrams indicate differential expressed genes (adjusted P value < 0.05; log2 fold change ≥1). PHOX2B and PRRX1 transcripts are indicated on the volcano plots. P values were calculated by false discovery rate calculation using DESeq2 on two-sided apeglm settings. c, Representative flow cytometry plots showing GD2 expression for SK-N-BE(2)-PRRX1 or KP-N-YN-PRRX1 cell lines treated with doxycycline (red) or control (black) or isotype control (gray). d, Mean fluorescence intensity for GD2 staining shown in panel c. e, Cell viability for the SK-N-BE(2)-induced AMT model co-cultured with NK cells at an effector to target (E/T) ratio of 1:2 and in the presence of absence of 1 μg ml−1 dinutuximab for 8 h (n = 4 samples per treatment group). Data are shown as mean ± s.d. Significance determined by one-way ANOVA and Tukey’s post-hoc test. f, SK-N-BE(2)-PRRX1 cell lines were co-cultured in the presence or absence of dinutuximab with blood-derived macrophages from three healthy donors and measured for phagocytosis. Data shown is phagocytosis with dinutuximab normalized to the control condition for that cell line. Triplicates for all three donor cultures were combined. Data are shown mean ± s.d. Significance determined by two-tailed Mann–Whitney U test. NS, not significant. Representative data from flow cytometry and western blots were confirmed in three independent experiments.
Fig. 3 |
Fig. 3 |. GD2 downregulation is correlated with reduced GD3S expression.
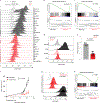
a, Scatterplot showing the correlation of the percentage of GD2+ cells in each cell line against the expression of GD3 synthase (ST8SIA1) from the CCLE. Linear regression line is shown, and gray cloud denotes 95% two-tailed confidence interval. R2 and P values are indicated. TPM, transcripts per million. b, Schematic showing the b-series ganglioside synthesis pathway. Gene names for enzymes that are responsible for the conversion of each product are labeled in italics, and protein abbreviations are labeled in bold. c, Scatterplot showing the correlation of the percentage of GD2+ cells against the expression of GD2 synthase (B4GALNT1) from the CCLE. Linear regression line is shown, and gray cloud denotes 95% two-tailed confidence interval. R2 and P values are indicated. d, Box-and-whisker plots comparing log2(TPM + 1) normalized expression for selected ganglioside synthase enzymes in GD2-low (n = 7) or GD2-high (n = 7) cell lines found in the CCLE data. Boxes show median, 25% quartile and 75% quartile; whiskers denote smallest and largest values within 1.5 times the interquartile range. Dots outside of the whiskers denote significant outliers. Significance was determined by two-tailed Student’s t-test within each gene. e,f, qPCR analysis comparing expression of ST8SIA1 (e) or B4GALNT1 (f) in representative GD2-high (n = 9 biological replicates) or GD2-low (n = 7 biological replicates) cell lines. Significance was determined by two-tailed Student’s t-test within each gene. Data are shown as mean ± s.d. g, qPCR analysis comparing expression for a panel of ganglioside synthase enzymes in Kelly-GD2high and Kelly-GD2low cells. Data derived from a single experiment with four technical replicates, experiment was repeated twice. h, Representative flow cytometry plots for GD2 expression in Kelly-GD2low, SK-N-AS or NB-SD cell lines transduced to overexpress GD2 synthase, GD3 synthase or both together. i, Cell viability for SK-N-AS cells ±GD3S overexpression that were co-cultured with NK cells at an E/T ratio of 1:2 for 48 h in the presence or absence of 1 μg ml−1 dinutuximab (n = 3 samples per treatment group). Data are shown mean ± s.d. Significance determined by one-way ANOVA and Tukey’s post-hoc test. Representative data from flow cytometry were confirmed in two independent experiments.
Fig. 4 |
Fig. 4 |. GD3S downregulation is correlated with AMT.
a,b, Pearson correlations were generated for ST8SIA1 against expression for all other genes in neuroblastoma cell lines found in the CCLE (n = 31) and rank-ordered based on most to least correlated. GSEA was performed on neuroblastoma-specific, adrenergic (A) or mesenchymal (B) gene sets. q-values are shown. c, Box-and-whisker plot comparing log2(TPM + 1) normalized expression for ST8SIA1 and B4GALNT1 in ADRN (n = 25) or MES (n = 6) cell lines found in the CCLE. Boxes show median, 25% quartile and 75% quartile; whiskers denote smallest and largest values within 1.5 times the interquartile range. Significance was determined by two-tailed Student’s t-test for each individual gene. d, qPCR analysis for ST8SIA1 in three models of AMT (SK-N-BE(2)-PRRX1, KP-N-YN-PRRX1 and SH-EP/SH-SY5Y). Data are derived from a single experiment with four (SK-N-BE(2) and KP-N-YN) or three (SH-EP/SH-SY5Y) technical replicates, and the experiment was repeated twice. e, Western blot showing protein expression for GD3S and GD2S in three AMT models. GAPDH is included as a loading control. Note that GAPDH for SH-EP and SH-SY-5Y are the same bands as shown in Extended Data Fig. 1e. f, Flow cytometry showing GD2 expression in parental, PRRX1-transduced or PRRX1-transduced + GD3S SK-N-BE(2) and KP-N-YN cell lines. g, Cell viability for SK-N-BE(2) and KP-N-YN cell lines shown in panel f. Cell lines were co-cultured with NK cells at an E/T ratio of 1:2 for 48 h and in the presence or absence of 1 μg ml−1 dinutuximab (n = 3 samples per treatment group). Data are shown mean ± s.d. Significance determined within each cell line by one-way ANOVA and Tukey’s post-hoc test. Representative data from flow cytometry and western blots were confirmed in two independent experiments.
Fig. 5 |
Fig. 5 |. Neuroblastoma tumors with mesenchymal properties express reduced ST8SIA1.
a, Adrenergic and mesenchymal composite scores were calculated based on an averaged log2(TPM + 1) expression of all genes within each gene set. Mesenchymal cell lines were called based on MES score ≥4.5 and ADRN score ≤5. b, UMAP 2D projection plot focused on neuroblastoma (NB) showing the clustering of tumor and cell line global expression profiles. Cell lines (circles) and tumors (triangles) were determined to be adrenergic or mesenchymal in panel a and labeled in black and red, respectively. c, Box-and-whisker plot comparing log2(TPM + 1) gene expression for ST8SIA1 and B4GALNT1 enzymes in adrenergic (n = 174) or mesenchymal (n = 116) TARGET/Treehouse tumors. Boxes show median, 25% quartile and 75% quartile; whiskers denote smallest and largest values within 1.5 times the interquartile range. Dots outside of the whiskers denote significant outliers. Expression values were normalized to the mean expression in adrenergic tumors. Significance was determined by two-tailed Student’s t-test within each gene. d, Celligner-corrected ST8SIA1 gene expression from TARGET/Treehouse tumor data overlaid in the Celligner UMAP projections from panel b. e, RNA sequencing from Gartlgruber et al. (R2) showing box-and-whisker plots comparing log2(TPM + 1) gene expression for ST8SIA1 and B4GALNT1 enzymes in adrenergic (n = 427) or mesenchymal (n = 152) tumors. Boxes show median, 25% quartile and 75% quartile; whiskers denote smallest and largest values within 1.5 times the interquartile range. Dots outside of the whiskers denote significant outliers. Expression values were normalized to the mean expression in adrenergic tumors. Significance was determined by two-tailed Student’s t-test within each gene. f, Log2(TPM + 1) RNA-sequencing reads for a matched adrenergic primary (P) and mesenchymal relapsed (R) neuroblastoma tumors in Gartlgruber et al.
Fig. 6 |
Fig. 6 |. epigenetic inhibition results in transcriptional reprogramming and restoration of GD2 expression.
a, Flow cytometry showing GD2 expression in GD2-low cell lines treated with vehicle or tazemetostat for 21 days. b, Mean fluorescence intensity for GD2 in cell lines in panel a. Data are shown mean ± s.d. (n = 3 samples). Significance was determined by two-tailed Student’s t-test. c, ChIP-qPCR for H3K27me3 and H3K4me3 marks at the ST8SIA1 promoter and gene desert in SK-N-AS cells treated with tazemetostat. Significance was determined by one-way ANOVA and Tukey’s post-hoc test. Data are shown as mean ± s.d. (n = 3 biological replicates). d, ST8SIA1 qPCR expression in vehicle or tazemetostat-treated cell lines. Data derived from a single experiment with four technical replicates, experiment was repeated twice. e, SK-N-AS treated with vehicle or tazemetostat were co-cultured with blood-derived macrophages from three healthy donors and measured for phagocytosis in the presence or absence of anti-GD2. Triplicates for all three donor cultures were combined (n = 9 per treatment group). Data are shown mean ± s.d. Significance determined by two-tailed Mann-Whitney U test. f, GSEA for the adrenergic neuroblastoma gene signature from RNA sequencing between SK-N-AS cell lines treated with tazemetostat or vehicle. g, Western blot showing expression for ganglioside synthesis enzymes, adrenergic markers and mesenchymal markers in vehicle or tazemetostat-treated SK-N-AS cells. h, Heatmap showing RNA expression for the adrenergic gene set and corresponding enrichment for H3K27me3 or ATAC sequencing in vehicle- or tazemetostat (Taze)-treated SK-N-AS cells. Heatmap is ordered by log2 fold change (FC) from RNA sequencing. Black bars indicate a subset of consensus genes for which there was statistically significant loss of H3K27me3, upregulation of RNA and gain of chromatin accessibility. H3K27me3 and ATAC signal enrichment is shown for genomic regions ±5 kb from the transcriptional start site (TSS). i, Venn diagram showing the number of overlapping genes within the adrenergic gene set for which there is significantly reduced H3K27me3, significantly increased RNA expression or significantly more chromatin accessibility. Representative core genes from the 45 at the intersection of all three datasets are shown. j, ChIP- and ATAC-sequencing tracks for ST8SIA1 (GRCh38) in SK-N-AS cells treated with vehicle or tazemetostat. Blue boxes indicate significantly altered peaks. Representative data from flow cytometry were confirmed in three independent experiments and western blots were confirmed in two independent experiments.
Fig. 7 |
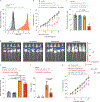
Fig. 7 |. EZH2 inhibition significantly enhances GD2 expression and response to anti-GD2 in vivo.
a, Flow cytometry showing GD2 expression from mice bearing metastatic SK-N-AS tumors treated with 500 mg kg−1 tazemetostat twice daily (BID) or control. b, Tumor growth curves for SK-N-AS cells injected into the tail vein of NSG mice (n = 5 per treatment group) and treated with 300 μg dinutuximab intraperitoneally three times a week (TIW) or 500 mg kg−1 tazemetostat orally twice daily alone or in combination. Data are shown mean ± s.d. Significance for combination treatment against other treatment groups was determined by two-way ANOVA. c, Bioluminescence AUC measurements for tumors in each treatment arm (n = 5). Data are shown mean ± s.d. Significance determined by one-way ANOVA and Tukey’s post-hoc test as compared to control. d, Representative bioluminescence imaging for mice in each treatment group as measured on day 28. e, Mean fluorescence intensity for GD2 in control, dinutuximab, tazemetostat and dinutuximab + tazemetostat-treated tumors at study endpoint (n = 5). Data are shown mean ± s.d. Significance was determined by one-way ANOVA and Tukey’s post-hoc test. f, qPCR analysis showing ST8SIA1 expression at endpoint in control, dinutuximab-, tazemetostat- or tazemetostat + dinutuximab-treated tumors (n = 5 biological replicates). Data are shown mean ± s.d. and normalized relative to ST8SIA1 expression in SK-N-AS cells cultured in vitro. ND, not detected. Significance was determined by two-tailed Student’s t-test between tazemetostat and combination. g, Tumor growth curves for SK-N-AS cells that were pretreated for 21 days with 1 μM tazemetostat or vehicle and then injected into the tail vein of NSG mice. Mice were randomized into untreated, treated with 300 μg dinutuximab intraperitoneally three times weekly or treated with anti-GD2 CAR T infusion groups (n = 5 per arm), and tumor burden measured via BLI over time. Data are shown mean ± s.d. Significance for the anti-GD2 treatment against control groups was determined by one-way ANOVA. Representative data from flow cytometry were confirmed in two independent experiments.
Fig. 8 |
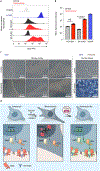
Fig. 8 |. eZH2 inhibition does not significantly upregulate GD2 expression in healthy tissue.
a, Flow cytometry panel showing GD2 expression in low-passage (p + 3), primary cortical neurons (HCN-001) and the mesenchymal neuroblastoma cell line SK-N-AS after treatment with tazemetostat. b, Mean fluorescence intensity measurements for groups shown in Fig. 7g (n = 3). Data are shown as mean ± s.d. Significance was determined by one-way ANOVA and Tukey’s post-hoc test. c, Immunohistochemistry showing GD2 staining in the mouse cortex of mice treated for 28 days with 350 mg kg−1 tazemetostat (n = 3) or control (n = 3). Uninvolved human tissue from matched human cortex and GD2-expressing human diffuse intrinsic pontine glioma (DIPG) tumor sections are included as controls for low and high GD2 expression, respectively. GD2 expression is stained in blue, and H3K27M (human tissue only) is stained in brown. d, Schema showing proposed mechanism of GD2 regulation. GD2 is highly expressed on the cell surface of neuroblastoma cells expressing an adrenergic transcriptional program. Transition from an adrenergic state to a mesenchymal state decreases GD2 expression through downregulation of ST8SIA1, rendering cells nonresponsive to anti-GD2 immunotherapy. Treatment with an EZH2 inhibitor induces an adrenergic-like state through transcriptional, epigenetic and chromatin remodeling, thereby re-expressing ST8SIA1, increasing GD2 expression and restoring sensitivity to anti-GD2 antibody. Representative data from flow cytometry were confirmed in two independent experiments.

References

    1. Smith MA, Altekruse SF, Adamson PC, Reaman GH & Seibel NL Declining childhood and adolescent cancer mortality. Cancer 120, 2497–2506 (2014). - PMC - PubMed
    1. Park JR et al. Effect of tandem autologous stem cell transplant vs single transplant on event-free survival in patients with high-risk neuroblastoma: a randomized clinical trial. JAMA 322, 746–755 (2019). - PMC - PubMed
    1. Yu AL et al. Anti-GD2 antibody with GM-CSF, interleukin-2, and isotretinoin for neuroblastoma. N. Engl. J. Med 363, 1324–1334 (2010). - PMC - PubMed
    1. Yu AL et al. Long-term follow-up of a phase III study of ch14.18 (dinutuximab) + cytokine immunotherapy in children with high-risk neuroblastoma: COG study ANBL0032.Clin. Cancer Res 27, 2179–2189 (2021). - PMC - PubMed
    1. Cheung NK et al. Murine anti-GD2 monoclonal antibody 3F8 combined with granulocyte-macrophage colony-stimulating factor and 13-cis-retinoic acid in high-risk patients with stage 4 neuroblastoma in first remission. J. Clin. Oncol 30, 3264–3270 (2012). - PMC - PubMed

Publication types