. 2022 Aug;23(8):1246-1255.
doi: 10.1038/s41590-022-01257-4. Epub 2022 Jul 11.

Multitier mechanics control stromal adaptations in the swelling lymph node

Affiliations

Multitier mechanics control stromal adaptations in the swelling lymph node

Frank P Assen et al. Nat Immunol. 2022 Aug.

Abstract

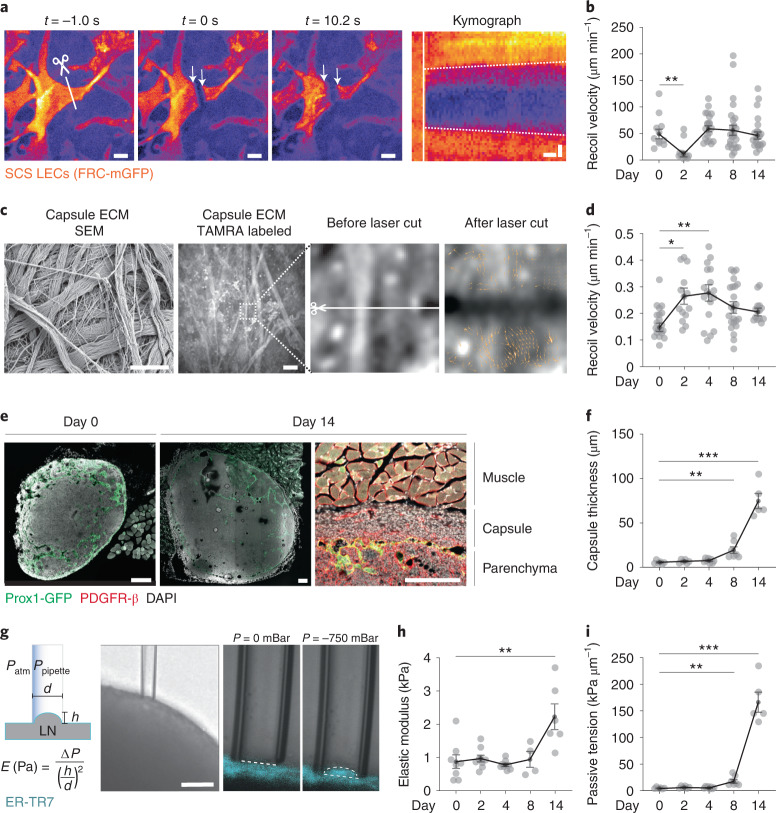
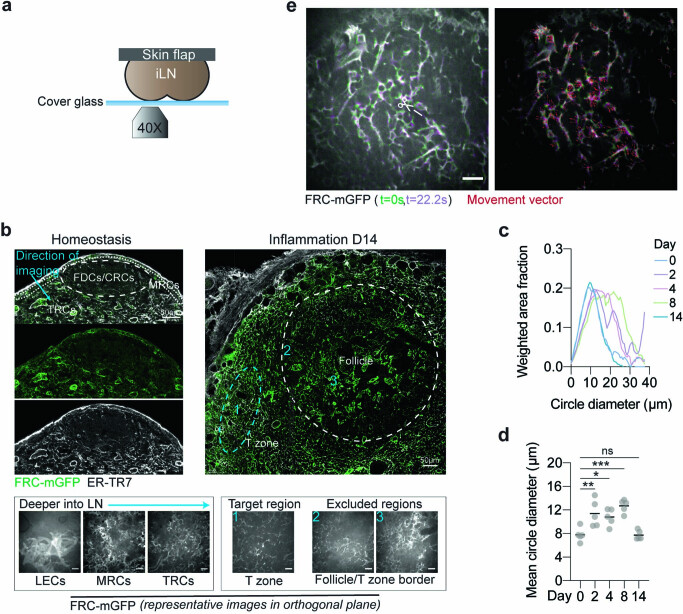
Lymph nodes (LNs) comprise two main structural elements: fibroblastic reticular cells that form dedicated niches for immune cell interaction and capsular fibroblasts that build a shell around the organ. Immunological challenge causes LNs to increase more than tenfold in size within a few days. Here, we characterized the biomechanics of LN swelling on the cellular and organ scale. We identified lymphocyte trapping by influx and proliferation as drivers of an outward pressure force, causing fibroblastic reticular cells of the T-zone (TRCs) and their associated conduits to stretch. After an initial phase of relaxation, TRCs sensed the resulting strain through cell matrix adhesions, which coordinated local growth and remodeling of the stromal network. While the expanded TRC network readopted its typical configuration, a massive fibrotic reaction of the organ capsule set in and countered further organ expansion. Thus, different fibroblast populations mechanically control LN swelling in a multitier fashion.


Conflict of interest statement

The authors declare no competing interests.

Figures

Fig. 1
Fig. 1. The reactive lymph node resists swelling.
a, Volumes of swelling LNs calculated from 2D side views over the course of 2 weeks after immunization (n = 46). Means are connected (blue line) and a linear regression line (dashed) has been fitted to the data. b, Measured geometrical parameters annotated on 2D side images during a measurement (25% strain). Force is measured on the top plate. Scale bar, 300 µm. H0, LN height before compression; L, LN length before compression; Heq, LN height at equilibrium. R1, R2 and R3 indicate measured radii. c, Stress relaxation curve from the measured force over time (left) and the corresponding force fit (right). Colored arrows indicate short-, medium- and long-term relaxations. Force is fitted with a double exponential equation (blue line). The arrow (black) indicates force at equilibrium (Feq). df, Quantification of the effective resistance (d; n = 8, 11, 8, 9 and 10), viscosity (e; n = 8, 11, 7, 6 and 10) and Young’s modulus (f; n = 8, 11, 8, 9 and 10). gj, Stress relaxation measurements in LNs of wild-type (WT) mice during homeostasis (day 0; g and h) and in LNs of wild-type or OT-II mice during inflammation (day 4; i and j) following treatment with PBS or CD62L antibody intravenously injected 24 h before measurements at day 0 or injected at immunization for measurements at day 4. g,i, Representative side views of explanted and measured LNs. Scale bars, 300 µm (g) and 400 µm (i). h, Quantification of LN volume (left, n = 11 and 9) and quantification of effective resistance (right, n = 11 and 9). j, Quantification of LN volume (n = 13, 16, 8 and 12) and effective resistance (n = 13, 16, 8 and 11). Data from a, df, h and j are shown as the mean ± s.e.m. and individual datapoints represent independent measurements of single popliteal LNs. Statistical analysis was performed using Kruskal-Wallis test (df), unpaired two-tailed t-test (h; left), two-tailed Mann-Whitney test (j; left; y = (y0.8–1)/0.8 transformed) and two-way analysis of variance (ANOVA; h, right, j, right; y = ln(y) transformed). All experiments were repeated independently (≥5 mice and ≥3 experiments). For statistical details, see Supplementary Table 1. *P < 0.05, **P < 0.01, ***P < 0.001, ****P < 0.0001. Source data
Fig. 2
Fig. 2. The stromal network stretches upon lymph node swelling.
a, Representative T-zone, follicles and lymphatic compartment volumes as identified by CD3ε, B220 and LYVE-1 staining, respectively, from cleared and 3D LSFM-imaged entire popliteal LNs at homeostasis (day 0) and inflammation (days 4 and 14), visualized together and separately for the T-zone. Indentations of follicles into the underlying T-zone can be observed at all time points. Scale bar, 500 µm. bd, Quantification of absolute and fractional volumes of T-zone (b; n = 10, 10 and 8), follicles (c; n = 10, 10 and 8) and lymphatics (d; n = 10, 10 and 8). e, Representative images of TRC networks gap analysis in homeostasis (day 0) and inflammation (days 2, 4, 8 and 14). f, Averaged and smoothed distribution of the TRC network fitted circle distributions plotted as the weighted area fraction as a function of the fitted circle diameter as measured in e (n = 28, 26, 31, 31 and 32). g, Quantification of the mean fitted circle diameter as in f (n = 28, 26, 31, 31 and 32). Data from bd are shown as the mean ± s.e.m. and g as the mean only. Datapoints in bd represent independent measurements of single popliteal LNs and in g represent the average of 10–30 analyzed consecutive optical sections of an acquired deep T-zone volume. All statistical analysis was performed using one-way ANOVA. All experiments were repeated independently (≥5 lymph nodes from ≥3 mice and ≥2 experiments) and data from f and g were pooled for each time point. For statistical details, see Supplementary Table 1. NS, not significant. *P < 0.05, **P < 0.01, ***P < 0.001, ****P < 0.0001. Source data
Fig. 3
Fig. 3. Conduits are stretched in the swelling lymph node.
a, Schematic of STEM tomography acquisition of macerated popliteal lymph node samples (left) and images of the fibrillar collagen of T-zone conduits at a single tilt angle (middle) and a maximum intensity projection crop of a 3D conduit reconstructed from multiple tilting angles (right). b, Representative cropped 3D reconstructions of fibrillar collagen (blue) from macerated conduits at homeostasis (day 0) and inflammation (days 2, 4 and 14) in which the conduit centerline (yellow) and traced fibril segments (gray) are depicted. c, Visual representation of the conduit fibril alignment analysis of an imaged 3D conduit volume. Angles of individual fibril segments (thick colored lines) with the centerline of the conduit (dashed black line) are measured at multiple points along the fibril segment (thin colored lines) and averaged per fibril segment. ɑ1 and ɑ2 indicate measured angles. d, Quantification of conduit fibril alignment with centerline (n = 437, 244, 502 and 478). Data are shown as the mean. Datapoints represent an individual fibril segment. Statistical analysis was performed using the Kruskal-Wallis test. All experiments were repeated independently (three lymph nodes from two mice and two experiments) and data were pooled for each time point. For statistical details, see Supplementary Table 1. NS, not significant. ***P < 0.001, ****P < 0.0001. Source data
Fig. 4
Fig. 4. TRC network tension increases upon lymph node swelling.
a, In vivo ultraviolet (UV) laser cut measurement of the TRC network at subcapsular IF regions where a high UV laser cuts the TRC network along 10 µm at three z planes after which the local recoil of the TRC network is imaged. The scissor and line indicate the cutting location and arrows indicate the recoiling FRC network. Scale bars, 20 µm. b, Representative example of TRC network recoil. Images depict stills from before (t = −1s), directly after (t = 0 s) and late after (t = 6.2 s) cutting (scale bars, 5 µm), with corresponding kymograph along the recoil axis (scale bar, x axis = 1 s and y axis = 2 µm). Scissor and line indicate cutting location and arrows show the recoiling TRC network. Dashed lines in the kymograph indicate slopes used to calculate the recoil velocity, and the vertical white line indicates the cut. c, Quantification of recoil velocity from kymographs as in b in homeostasis (day 0) and inflammation (days 2, 4, 8 and 14; n = 43, 33, 35, 51 and 36). d, 3D view of the TRC network stained for YAP/TAZ. Stack size, 20 µm. Scale bar, 20 µm. e, Representative examples of YAP/TAZ nuclear and cytoplasmic localization from TRCs of the deep T-zone. NC, nuclear to cytoplasmic. Scale bars, 2 µm. f, Quantification of YAP/TAZ NC fluorescence intensity ratio (n = 46, 19, 46, 48 and 50). Dashed line indicates an equal ratio. Data from c and f are shown as the mean ± s.e.m. where means are connected by a line. Datapoints in c represent single TRC network cuts and in f represent single measured TRCs. Statistical analysis was performed using the Kruskal-Wallis test. All experiments were repeated independently (≥5 lymph nodes from ≥3 mice and ≥2 experiments) and data were pooled for each time point. For statistical details, see Supplementary Table 1. NS, not significant. *P < 0.05, **P < 0.01, ****P < 0.0001. Source data
Fig. 5
Fig. 5. T-zone reticular cells undergo distributed clonal expansion.
a, High-resolution confocal volumes of MADM sparse labeled TRCs in homeostasis (day 0) and TRC clusters in inflammation (day 8). Scale bars, 40 µm. b, Quantification of LN volume (left; n = 5, 5 and 5) and number of clusters (right; n = 5, 5 and 5) of light-sheet images from cleared popliteal lymph nodes of Ccl19-Cre MADM-7GT/TG mice in homeostasis (day 0) and inflammation (days 4 and 8). c, Representative images of TRC cluster volumes (randomly colored) and HEVs of an entire LN in homeostasis (day 0) and inflammation (day 4) from experiments as in b. Scale bar, 200 µm. d, Frequency distribution in percentages of TRC per cluster found in observed and simulated data from experiments as in b. Data are depicted as the mean (n = 5, 5 and 5). e, Quantification of the CF per LN from experiments as in b (n = 5, 5 and 5). f, CF plotted as a function of the distance from the nearest HEV from experiments as in b. Data are depicted as the mean ± s.e.m. (n = 5, 5 and 5). g, Correlation matrix of paired variables assessed in the cluster analysis from experiments as in b (n = 15). P values are given and the correlation coefficients are color coded. h, CF plotted as a function of the LN volume from experiments as in b (n = 15). A spline fit was plotted through the datapoints. Data from b and e are depicted as the mean ± s.d. Datapoints from b and e represent a single analyzed LN. Statistical analysis was performed using one-way ANOVA (b; left), Kruskal-Wallis test (b; right, e) and two-tailed Spearman correlation (g). All experiments were repeated independently (≥3 mice and ≥2 experiments). For statistical details, see Supplementary Table 1. **P < 0.01, ***P < 0.001, ****P < 0.0001. Source data
Fig. 6
Fig. 6. Talin1 is required for T-zone reticular cell mechanosensing.
a, Quantification of LN weights in homeostasis (day 0) and inflammation (days 4 and 14) in littermate control and FRCΔTLN1 mice (left, n = 6, 7, 12, 19, 8 and 8) and same data fitted by nonlinear regression (right). b, Representative TRC networks from littermate control and FRCΔTLN1 mice in homeostasis (day 0) and at inflammation (day 4) stained for YAP/TAZ. Scale bars, 10 µm. c, Violin plots showing quantification of YAP/TAZ localization as in b (n = 35, 84, 152 and 134). d, Representative images of 3D TRC network analysis of LNs from FRC-mGFP control and FRCΔTLN1-mGFP mice in homeostasis (day 0) and inflammation (days 4 and 14). Fitted spheres are randomly colored. Imaged stack size, 100–300 µm. Scale bars, 50 µm. e, Quantification of TRC network analysis as in d. Average weighted volume fraction plotted as function of the sphere diameter (top; n = 9, 7, 15, 8, 6 and 9). Average sphere diameter (bottom). f, Quantification of cCasp-3+ TRCs in LNs from FRC-mGFP control and FRCΔTLN1-mGFP mice in homeostasis (day 0) and inflammation (days 4 and 8; n = 5, 5, 5, 5, 5 and 5). Images show the identification of an apoptotic TRC. Scale bar, 3 µm. g, Quantification of Ki67+ TRCs as in f (n = 5, 5, 5, 5, 5 and 5). Images show the identification of a proliferating TRC. Scale bar, 3 µm. Data from a, c, e (bottom), f and g are shown as the mean ± s.e.m. and e (top) as the mean. Datapoints in a represent independently measured LNs, and those in eg represent independently measured TRC network volumes. Statistical analysis was performed using unpaired two-tailed t-test (a; left, f and g), two-tailed Fisher’s exact test (c) and one-way ANOVA (e; ln(y) transformed). All experiments were repeated independently (≥3 lymph nodes from ≥2 mice and ≥2 experiments) and data from c were pooled for each condition. For statistical details, see Supplementary Table 1. NS, not significant. *P < 0.05, **P < 0.01, ***P < 0.001, ****P < 0.0001. Source data
Fig. 7
Fig. 7. Capsule fibrosis constrains late lymph node expansion.
a, Representative images from in vivo laser cut experiments of subcapsular sinus LECs before (t = −1s), directly after (t = 0 s) and late after (t = 10.2 s) cutting (scale bars, 5 µm), with corresponding kymograph along the recoil axis (scale bar, x = 1 s and y = 2 µm). The scissor and line indicate the location of the cut and arrows indicate the recoiling cell. Dashed lines in the kymograph indicate slopes and the vertical white line shows the cut. b, Quantification of experiments as in a during homeostasis (day 0) and inflammation (days 2, 4, 8 and 14; n = 11, 12, 20, 25 and 22). c, UV laser cut experiment on TAMRA-labeled capsule ECM of explanted LNs in homeostasis (day 0) and inflammation (day 2, 4, 8 and 14), which recapitulate ECM from scanning electron microscopy (SEM) imaging. Recoil displacement is depicted by orange vectors. Scale bars, SEM image = 1 µm and fluorescence image = 20 µm. d, Quantification of recoil velocities in c (n = 20, 14, 18, 24 and 14). e, Representative examples of LN capsules from Prox1-GFP mice in homeostasis (day 0) and inflammation (day 14), stained for PDGFR-β (only shown on right) and counterstained with DAPI. Scale bars, 200 µm. f, Quantification of capsule thickness as in e (n = 6, 6, 8, 7 and 5). g, Capsule stiffness measurements of homeostatic (day 0) and inflamed (days 2, 4, 8 and 14) explanted popliteal LNs labeled with ERT-R7 antibody. Scale bar, 50 µm. h, Quantification of capsule stiffness as in g (n = 8, 9, 9, 4 and 6). i, Quantification of passive tension (n = 6, 6, 8, 7 and 5). Data from b, d, f, h and i are shown as the mean ± s.e.m. Datapoints in b and d represent independent cuts, and data in f, h and i show independently measured LNs. Statistical analysis was performed using the Kruskal-Wallis test (b, f, h and i) and one-way ANOVA (d). All experiments were repeated independently (≥4 lymph nodes from ≥4 mice and ≥2 experiments) and data from b and d was pooled for each condition. For statistical details, see Supplementary Table 1. *P < 0.05, **P < 0.01, ***P < 0.001. Source data
Extended Data Fig. 1
Extended Data Fig. 1. The reactive lymph node resists swelling.
(a) Side view focus-stack of a homeostatic (day 0) and inflamed (day 14) popliteal lymph node (LN) from wild-type (WT) mice. Scale bar = 500 µm. (b) Quantification of LN volumes in homeostasis (day 0) and inflammation (day 2, 4, 8 and 14) from wild-type mice (n = 8, 11, 8, 9, 10). (c) Relation between volumes and corresponding measured weights of LNs as in a. A regression line is fitted. (d) Stress relaxation curves of homeostatic (day 0) and inflamed (day 2, 4, 8 and 14) LNs (n = 6, 6, 6, 6, 6). (e) Schematic representation of the generalized Kelvin model used to derive the effective resistance, viscosity and Young’s modulus from stress relaxation experiments on explanted popliteal LNs from wild-type mice in homeostasis (day 0) and inflammation (day 2, 4, 8 and 14). Adapted from Forgacs et al. (f) Schematic illustration and description of the short-, medium- and long-term relaxation events in a LN during a stress relaxation experiment. (g) Scanning electron microscopy image of packed lymphocytes in the homeostatic (day 0) LN paracortex of a wild-type mouse. Scale bar = 2 µm. (h, i) Quantification of (h; left, i; left) viscosity (n = 11, 9 and n = 11, 9) and (h; right, i; right) Young’s modulus (n = 13, 16, 8, 11) and (n = 13, 16, 8, 11), respectively, of stress relaxation measurements in (h) LNs of wild-type (WT) mice in homeostasis (day 0) and in (i) LNs of wild-type or OT-II mice during inflammation (day 4) following treatment with PBS or CD62L Ab (i.v. injected 24 h before measurements for homeostasis or at immunization for inflammation). Data from b, d, h, i shown as mean ± s.e.m. Datapoints in b, d, h, i represent independently measured LNs. Statistical analysis was performed using one-way ANOVA (b), unpaired two-tailed t test (h) and two-way ANOVA (i; y=Ln(y) transformed). All experiments were repeated independently (≥5 mice and ≥3 experiments). For statistical details see Supplementary Information, table 1. NS, not significant. *P < 0.05, **P < 0.01, ****P < 0.0001. Source data
Extended Data Fig. 2
Extended Data Fig. 2. The stromal network stretches upon lymph node swelling.
(a) 3D reconstruction of an entire homeostatic (day 0) popliteal lymph node (LN) by LSFM following clearing and staining of T-zone, follicles and lymphatic compartment volumes by CD3ε, B220 and LYVE-1 staining, respectively. LN surface and follicles are shown. Asterisks (*) indicate sites where follicles locally deform the LN’s capsule (left). Scale bar = 200 µm. 3D clipping of the dashed line encircled region (right). Follicle location with respect to capsule deformations are shown. (b) Example of T-zone deformation by B cell follicle (3D cropped). Asterisk (*) depicts the site at which underlying T-zone is indented by and curves around a follicle. Scale bar = 100 µm. (c) LN stromal network gap analysis. FRC-mGFP (top), segmented FRC network (middle), fitted circles in gaps (bottom), randomly colored, T-zone reticular cell (TRC) network in white. (d) Representative examples of the B cell follicle light zone (and for inflammation conditions also GC) FDC stromal network (within dashed line), and CXCL12+ reticular cell (CRC) stromal network (area between the dashed and solid lines) of LNs in homeostasis (day 0) and inflammation (day 4 and 14) from wild-type (WT) FRC-mGFP mice used for gap analysis as in c. Scale bars = 50 µm. (e) Representative examples of the CRC stromal network gap analysis as in d. (f) Averaged and smoothed distribution of the CRC stromal network gaps, plotted as the weighted area fraction as a function of the fitted circle diameter as in e (n = 5, 5, 5). (g) Quantification of the mean fitted circle diameter as in e (n = 5, 5, 5). Data from f, g, shown as mean. Datapoints in g represent independently measured follicles. Statistical analysis was performed using one-way ANOVA (g). All experiments were repeated independently (3 lymph nodes from ≥3 mice and ≥2 experiments). For statistical details, see Supplementary Information, table 1. ns, not significant. Source data
Extended Data Fig. 3
Extended Data Fig. 3. Conduits are stretched in the swelling lymph node.
(a) Schematic illustration of the conduit unit from the T-zone. (b) Example of a decellularized homeostatic (day 0) popliteal lymph node (LN). (c) Conduit imaged by scanning transmissive electron microscopy (STEM) in which the characteristic D-period of collagen fibrils can be observed. Scale bar = 500 nm. (d) Examples of a T-zone conduit at different tilting angles acquired by STEM tomography. Scale bar = 500 nm. (e) Schematic of computed weight back projection to reconstruct a 3D volume of a conduit from differential tilting angles.
Extended Data Fig. 4
Extended Data Fig. 4. TRC network tension increases upon lymph node swelling.
(a) Schematic of in vivo laser cutting in inguinal lymph nodes (iLNs) of FRC-mGFP mice. (b) Subcapsular T-zone reticular cell (TRC) network is imaged at interfollicular (IF) regions (blue arrow). Homeostatic (day 0) and inflammation (day 14) are shown. mGFP positive lymphatic endothelial cells (LECs), marginal reticular cells (MRCs) and TRCs are encountered while gradually focusing into the LN, while follicular dendritic cell (FDC) and CXCL12+ reticular cells (CRCs) regions are avoided. The T-zone at IF sites is identified by regular network morphology and bright fluorescent reporter intensity (1), compared to the more irregular and dimmer CRC (2) and dense and bright FDC (3) stromal networks found in the largely ECM-free (ER-TR7 negative) follicles. White dashed lines indicate the outline of follicles, and white dense spaced lines indicate the subcapsular region where MRCs are found (annotated in homeostasis). The area enclosed by the blue dashed line shows a typical area targeted for TRC laser cutting in the orthogonal plane. Scale bars: top = 50 µm, bottom = 20 µm. (c) Averaged and smoothed distribution of the subcapsular TRC network as analyzed by circle fitting gap analysis of homeostatic (day 0) and inflamed (day 2, 4, 8, 14) LNs from FRC-mGFP mice, plotted as the weighted area fraction as a function of the fitted circle diameter (n = 5, 5, 5, 5, 5). (d) Quantification of the mean fitted circle diameter as in c (n = 5, 5, 5, 5, 5). (e) Example of force propagation in the TRC network following a UV laser cut. Time point directly after cutting (t = 0 s) and late after cutting (t = 22.2 s) overlapped (left). Scissor and white line indicate the laser cut location. Scale bar = 20 µm. Overlay of movement vectors (red arrows) derived from particle imaging velocimetry analysis (right). Data from c shown as mean and d shown as mean ± s.e.m. Datapoints in d represent independently analyzed TRC network images from LNs used in laser cutting experiments. Statistical analysis was performed using one-way ANOVA (d). All experiments were repeated independently (3 mice and ≥2 experiments). For statistical details see Supplementary Information, table 1. NS, not significant. *P < 0.05, **P < 0.01, ***P < 0.001. Source data
Extended Data Fig. 5
Extended Data Fig. 5. TRCs undergo distributed clonal expansion.
(a) Schematic of the mosaic analysis with double markers (MADM) labeling principle. Rare interchromosomal recombination in the G2 cell cycle phase following x-segregation of chromosomes labels T-zone reticular cells (TRCs) with either a cytoplasmic tdTomato or GFP. (b) Schematic of the sparse mosaic analysis with double markers (MADM) labeling approach for TRC cluster analysis in popliteal lymph nodes (LNs) from Ccl19-Cre MADM-7GT/TG mice in homeostasis (day 0) and inflammation (day 4 and 8) (left). Sparse labeling of TRCs in a histological section of a homeostatic LN (right). Scale bar = 200 µm. (c) 3D fluorescent intensity cropped images from light-sheet fluorescent microscopy of entire lymph nodes for which MADM-GFP labeled TRCs and in situ labeled high endothelial venules (HEVs) by PNAd-ATTO647n Ab are shown, as in b. Scale bars = 20 µm. (d) Example of the labeling of HEVs and mapping of MADM-labeled TRCs (only tdTomato+ TRCs are shown) at inflammation (day 4) as in c. The enlarged image depicts the mapping of individual TRCs by a grey sphere at the center of each cell. Scale bars = 200 µm. (e) Quantification of number of MADM-labeled TRCs as in c (n = 5, 5, 5). (f) Quantification of number of MADM-labeled TRCs found in clusters as in c (n = 5, 5, 5). (g) Quantification of numbers of MADM-labeled TRCs found in cluster as percentage of total MADM-labeled TRCs as in c (n = 5, 5, 5). (h) Quantification of the average distance to the nearest neighbor (NN) of both observed and simulated TRCs as in c (n = 5, 5, 5, 5, 5, 5). Data from d, f, g shown as mean ± s.d. and h shown as mean. Datapoints in e, f, g, h represent independently analyzed LNs. Statistical analysis was performed using Kruskal-Wallis test (e, f, g) and paired two-tailed t test. All experiments were repeated independently (≥3 mice and ≥2 experiments). For statistical details see Supplementary Information, table 1. NS, not significant. *P < 0.05, **P < 0.01, ***P < 0.001. Source data
Extended Data Fig. 6
Extended Data Fig. 6. Talin1 is required for TRC mechanosensing.
(a) Quantification of homeostatic (day 0) popliteal and inguinal lymph node (LN) weights from littermate control and FRCΔTLN1 mice. Images show representative inguinal LNs from littermate control and FRCΔTLN1 mice. Scale bars = 1 mm. (b) Quantification of homeostatic (day 0) T-zone CCL21 protein as measured in situ by fluorescent intensity following staining for CCL21 in littermate control and FRCΔTLN1 mice. Representative images for littermate control and FRCΔTLN1 mice in which CCL21 chemokine and high endothelial venule (HEVs) stained by PNAd Ab are shown. Scale bars = 20 µm. (c) T-zone and B cell follicles of homeostatic (day 0) popliteal LNs from littermate control and FRCΔTLN1 mice stained for CD3ε (T cells) and B220 (B cells). Scale bars = 200 µm. (d) ICAM-1, PDPN, VCAM-1 and merged staining on histological sections of homeostatic (day 0) popliteal LN T-zones from control and FRCΔTLN1 mice. Scale bars = 20 µm. (e) Representative histological images of T-zone reticular cell (TRC) networks from homeostatic (day 0) and inflamed (day 4 and 14) LNs from FRC-mGFP and FRCΔTLN1-mGFP mice stained for collagen IV. Scale bar = 50 µm. Data from a shown as mean and b as mean ± s.e.m. Datapoints in a, b represent independently analyzed LNs. Statistical analysis was performed using unpaired two-tailed t test (a) and two-tailed Mann-Whitney test (b). All experiments were repeated independently (≥3 mice and ≥2 experiments). For statistical details see Supplementary Information, table 1. *P < 0.05, **P < 0.01. Source data
Extended Data Fig. 7
Extended Data Fig. 7. Capsule fibrosis constrains late lymph node expansion.
(a) Crop of a representative histological image of a FRC-mGFP mouse derived homeostatic (day 0) inguinal lymph node (LN) stained for LYVE-1. mGFP is expressed specifically in cells with Cre-recombinase activity and membrane-bound tdTomato (mTdT) in all other cells. LYVE-1+ floor lymphatic endothelial cells (fLECs) are sparsely labeled by mGFP in the subcapsular sinus (SCS). (b) Capsule extracellular matrix (ECM) from an alkali-macerated popliteal LN from a wild-type (WT) mouse imaged by scanning transmissive electron microscopy (STEM). Scale bar = 5 µm. (c) Representative histological images of LN capsules from Prox1-GFP mice in homeostasis (day 0) and inflammation (day 4, 8 and 14) in which LECs are labeled by a cytoplasmic GFP. Mesenchymal cells are stained for PDGFR-β, and nuclei are counterstained with DAPI. Scale bars = 20 µm. (d) Characterization of capsular fibroblasts in inflamed (day 14) popliteal LNs from a FRC-mGFP (left panel; FRCs labeled with mGFP and all other cells with mTdT) or mTmG (other panels; all cells are labeled with mTdT) mouse of which the latter was stained for CD34, YAP/TAZ or αSMA and counterstained with DAPI. Areas between dashed lines indicate the capsule. Arrows indicate YAP/TAZ positive fibroblast nuclei in the capsule. Scale bars = 10 µm. (e) Schematic of mechanical dynamics and the multi-tier model of the swelling LN. Phase I: LN growth with T-zone reticular cell (TRC) relaxation and stretching. Phase II: LN growth with increasing TRC tension and TRC network expansion. Phase III: LN growth with decreasing TRC tension and further TRC network expansion. Phase IV: LN growth and TRC network expansion with decreasing TRC tension, capsule thickening and increasing strong resistance to growth.

Comment in

  • Mechanics drive lymph node expansion.
    Alapan Y, Thomas SN. Alapan Y, et al. Nat Immunol. 2022 Aug;23(8):1139-1141. doi: 10.1038/s41590-022-01277-0. Nat Immunol. 2022. PMID: 35882935 No abstract available.

Similar articles

Cited by

References

    1. Lämmermann T, Sixt M. The microanatomy of T cell responses. Immunol. Rev. 2008;221:26–43. doi: 10.1111/j.1600-065X.2008.00592.x. - DOI - PubMed
    1. Pham THM, Okada T, Matloubian M, Lo CG, Cyster JG. S1P1 receptor signaling overrides retention mediated by Gαi-coupled receptors to promote T cell egress. Immunity. 2008;28:122–133. doi: 10.1016/j.immuni.2007.11.017. - DOI - PMC - PubMed
    1. Young AJ. The physiology of lymphocyte migration through the single lymph node in vivo. Semin. Immunol. 1999;11:73–83. doi: 10.1006/smim.1999.0163. - DOI - PubMed
    1. Druzd D, et al. Lymphocyte circadian clocks control lymph node trafficking and adaptive immune responses. Immunity. 2017;46:120–132. doi: 10.1016/j.immuni.2016.12.011. - DOI - PMC - PubMed
    1. Suzuki K, Hayano Y, Nakai A, Furuta F, Noda M. Adrenergic control of the adaptive immune response by diurnal lymphocyte recirculation through lymph nodes. J. Exp. Med. 2016;213:2567–2574. doi: 10.1084/jem.20160723. - DOI - PMC - PubMed

Publication types

LinkOut - more resources