. 2022 Jul;25(7):935-943.
doi: 10.1038/s41593-022-01107-4. Epub 2022 Jul 11.

Reduced neural feedback signaling despite robust neuron and gamma auditory responses during human sleep

Affiliations

Reduced neural feedback signaling despite robust neuron and gamma auditory responses during human sleep

Hanna Hayat et al. Nat Neurosci. 2022 Jul.

Erratum in

Abstract

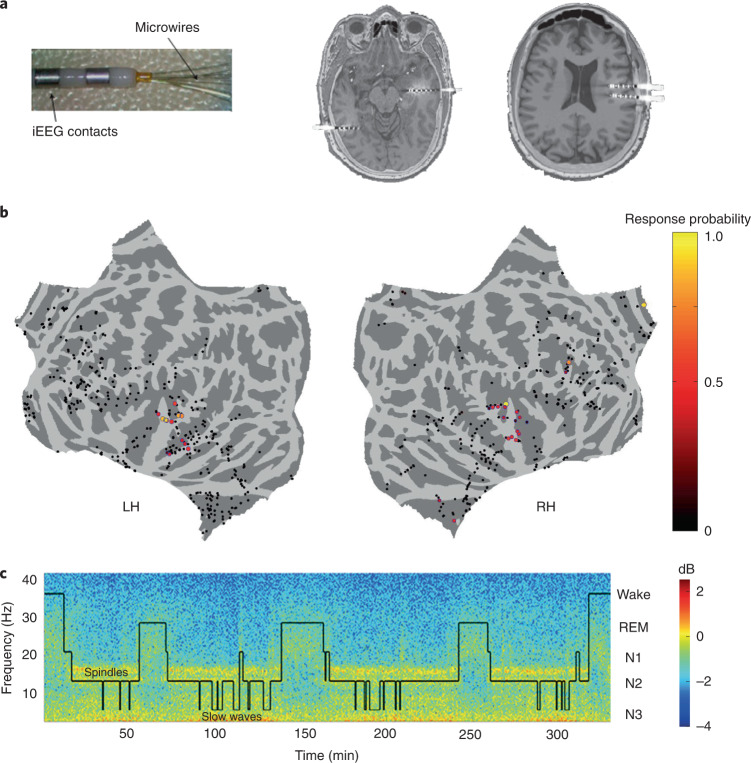
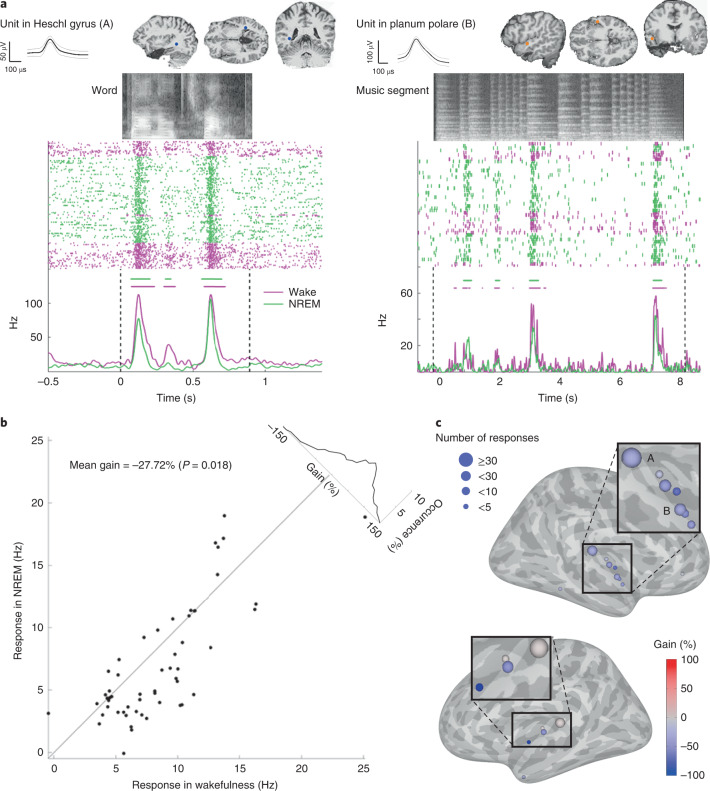
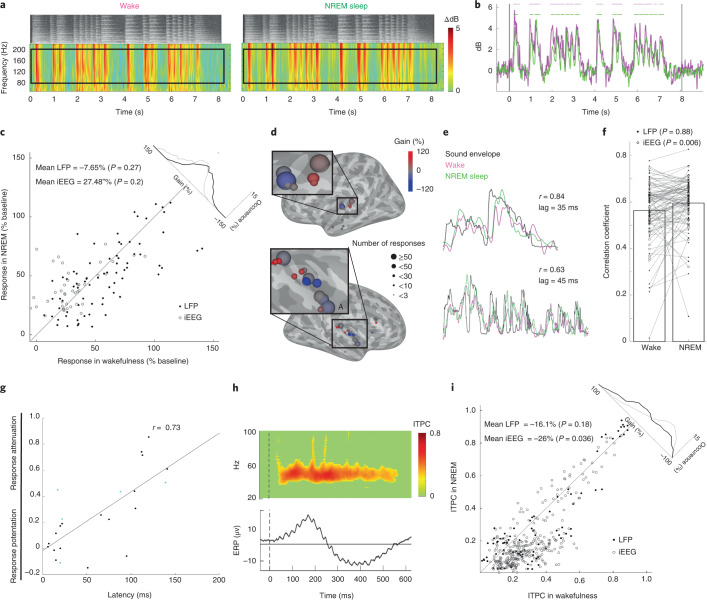
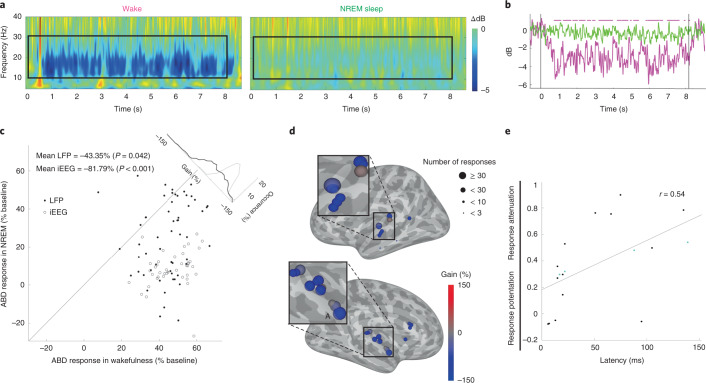
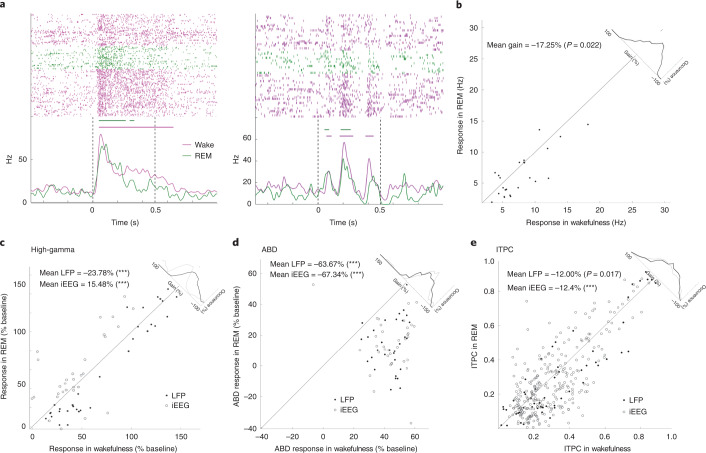
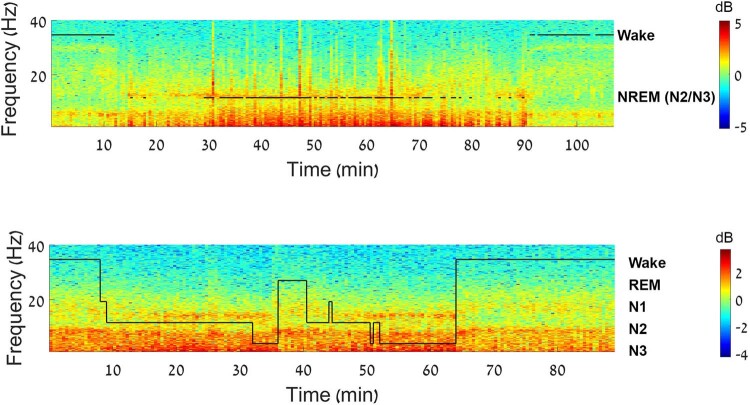
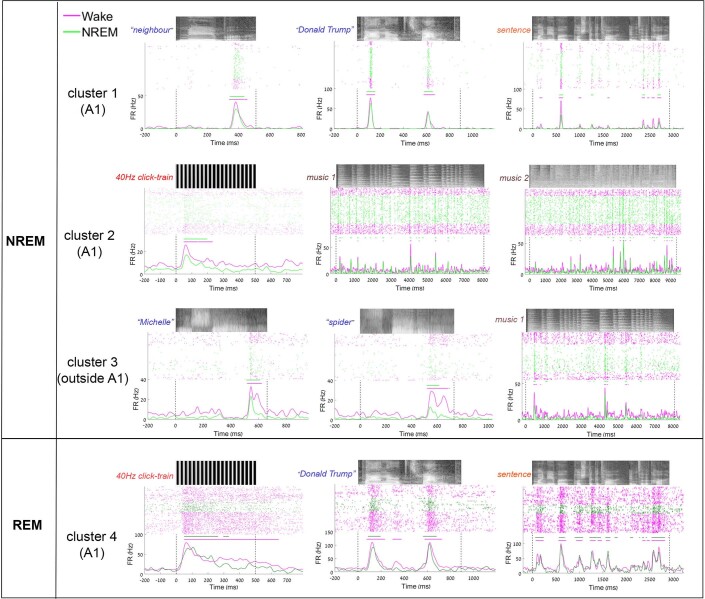
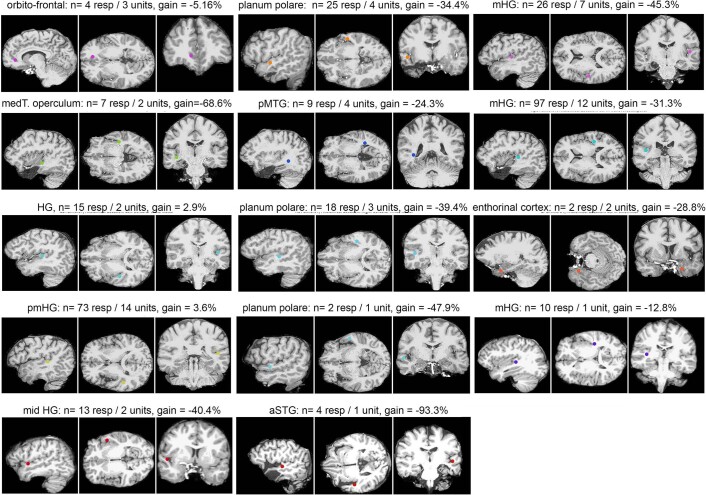
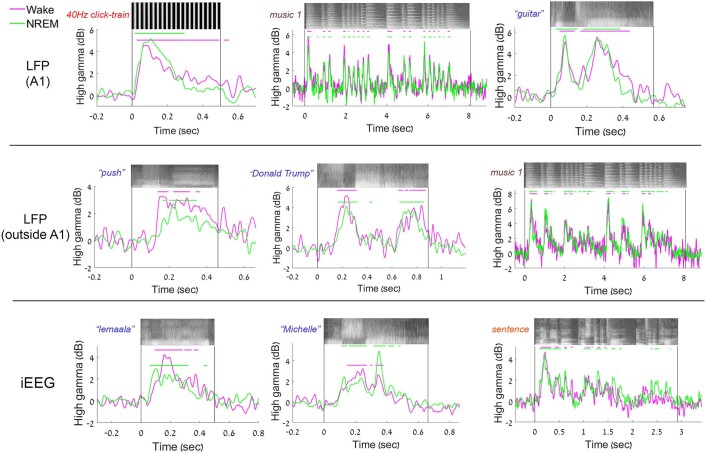
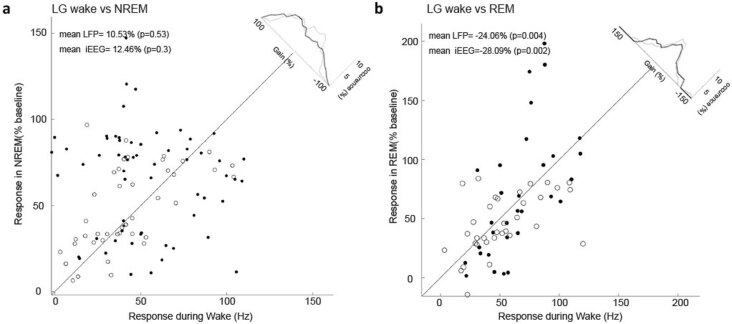
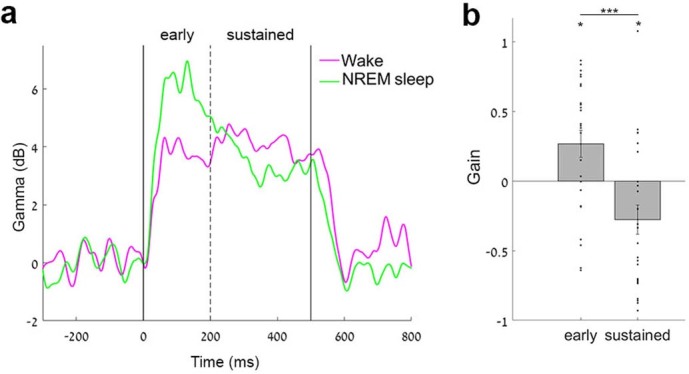
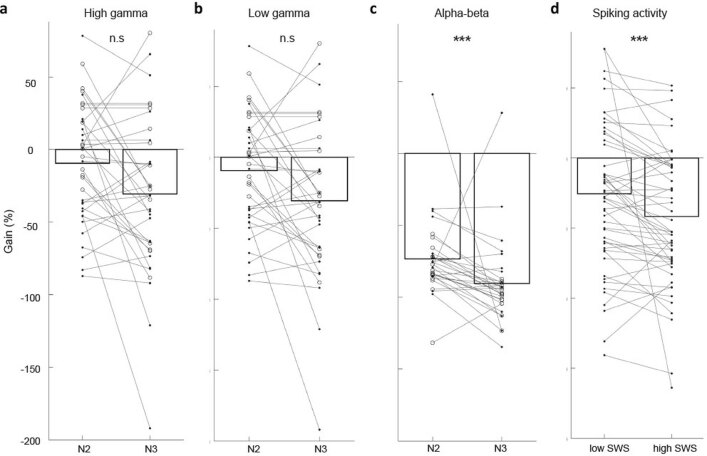
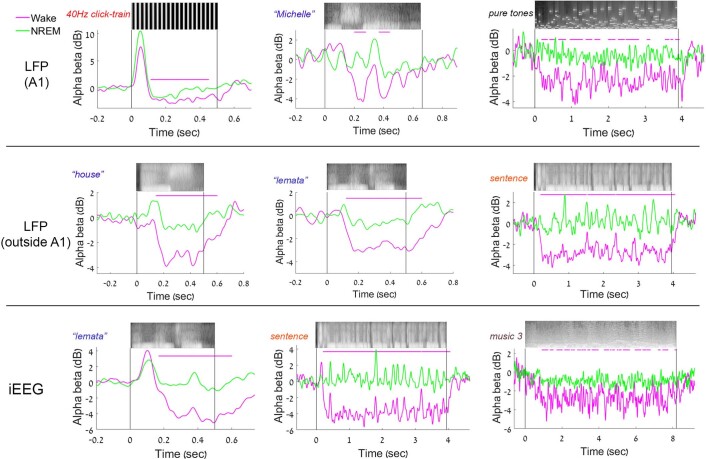
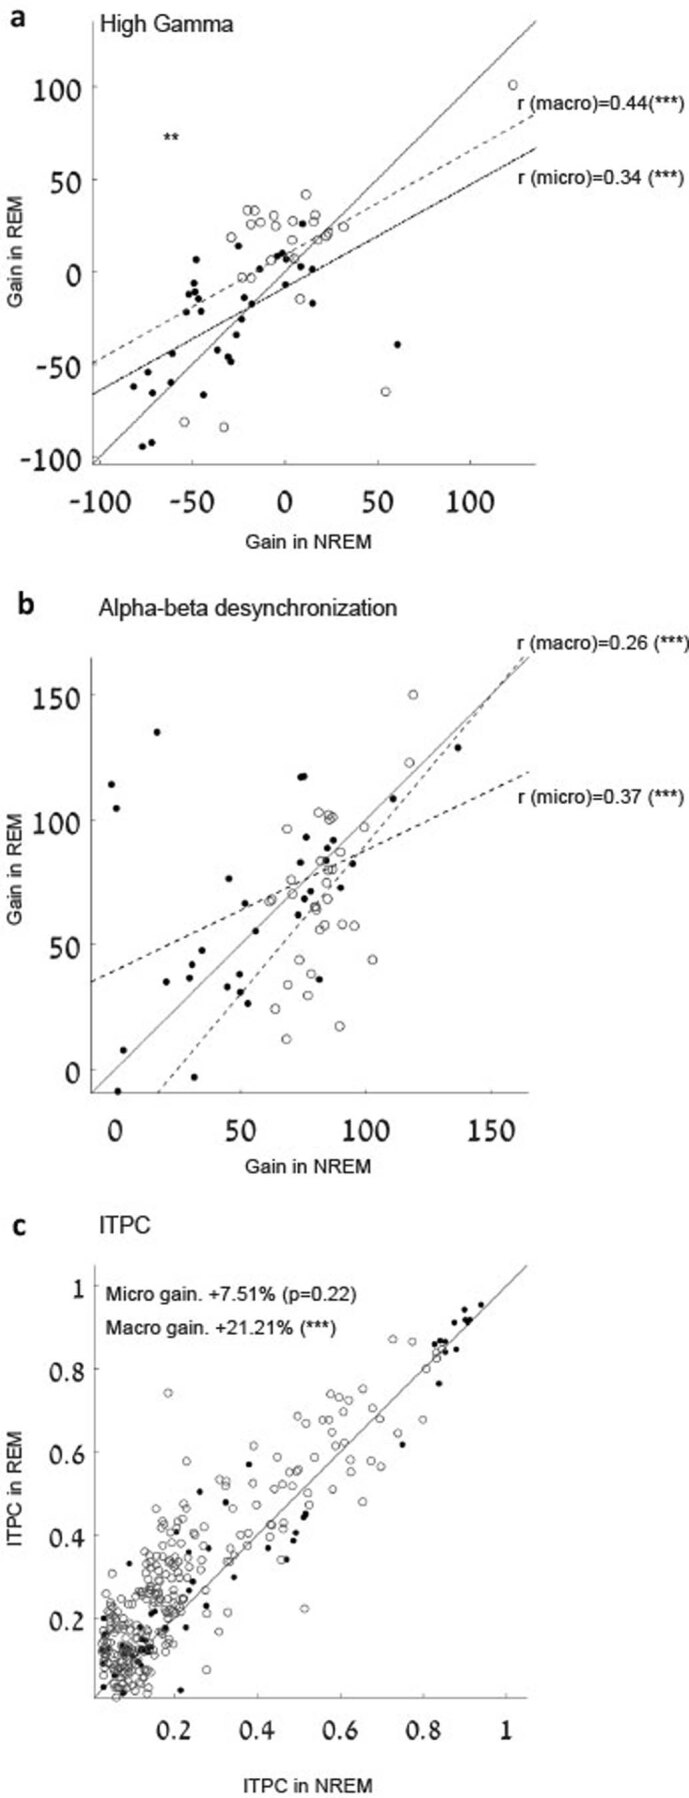
During sleep, sensory stimuli rarely trigger a behavioral response or conscious perception. However, it remains unclear whether sleep inhibits specific aspects of sensory processing, such as feedforward or feedback signaling. Here, we presented auditory stimuli (for example, click-trains, words, music) during wakefulness and sleep in patients with epilepsy, while recording neuronal spiking, microwire local field potentials, intracranial electroencephalogram and polysomnography. Auditory stimuli induced robust and selective spiking and high-gamma (80-200 Hz) power responses across the lateral temporal lobe during both non-rapid eye movement (NREM) and rapid eye movement (REM) sleep. Sleep only moderately attenuated response magnitudes, mainly affecting late responses beyond early auditory cortex and entrainment to rapid click-trains in NREM sleep. By contrast, auditory-induced alpha-beta (10-30 Hz) desynchronization (that is, decreased power), prevalent in wakefulness, was strongly reduced in sleep. Thus, extensive auditory responses persist during sleep whereas alpha-beta power decrease, likely reflecting neural feedback processes, is deficient. More broadly, our findings suggest that feedback signaling is key to conscious sensory processing.


Conflict of interest statement

The authors declare no competing interests.

Figures

Fig. 1
Fig. 1. Experimental paradigm.
a, Left, depth electrodes (6–12 per patient) implanted in patients with epilepsy for clinical monitoring, each consisting of eight 1.5-mm iEEG contacts along the shaft and eight 40-μm microwires protruding from the distal tip, recording LFP and spiking activities. Right, two representative pre-implant magnetic resonance images co-registered with post-implant computed tomography used to localize electrodes from the same individual. b, A topographic display (flat cortical map) of all sites where neuronal activity was recorded (each circle denotes one iEEG macroelectrode or a bundle of microwires) along with the probability of observing an auditory response in wakefulness (number of responses/number of stimuli played, color bar on right). LH, Left Hemisphere; RH, Right Hemisphere. c, Representative time–frequency representation (spectrogram) of iEEG recorded in one individual during a full-night sleep study with intermittent auditory stimulation. Warm colors (for example, red, see color bar on far right) mark increased power in specific time–frequency windows (frequency shown on left side of y axis). Superimposed hypnogram (black trace) marks the time-course of sleep/wake states (shown on right side of y axis). Note that NREM stages N2 and N3 are associated with increased power in spindle (10–15 Hz) and slow (<4 Hz) frequency ranges.
Fig. 2
Fig. 2. Robust auditory spiking responses across the temporal lobe during NREM sleep.
a, Left, representative spiking response of neuronal unit in response to word in the primary auditory cortex. The top row shows the action potential waveform (left inset, mean ± s.d.) and the anatomical location of the recorded unit (right inset, circle in MRI sections), while the grayscale soundwave spectrograms are shown above the raster (lighter shades denote stronger power). Pink, wakefulness; green, NREM sleep. Vertical dotted black lines mark stimulus onset and offset. Horizontal bars above peri-stimulus time histogram (PSTH) time-courses indicate automatically detected response intervals for which response magnitude was compared quantitatively. Right, same format for a unit in higher-order auditory cortex (planum polare) responding to music. b, Scatter plot of auditory spiking response magnitudes during NREM sleep (y axis) versus wakefulness (x axis), together with a histogram of gain values comparing response magnitudes (upper-right corner along the diagonal). N = 312 responses/55 clusters/7 patients. Each data point represents the averaged response across stimuli and trials per cluster. Mean and P value were calculated using a nested mixed model analysis (Methods) (confidence interval (CI) (−43.381, −12.064), P = 0.018). c, Gain values of spiking response magnitudes (NREM versus wakefulness) in each region exhibiting auditory responses. The position of each circle denotes its anatomical location shown on a standard (Montreal Neurological Institute (MNI)) brain template, the circle’s color represents the average gain detected in that region (color bar on bottom right), and the circle’s size reflects the number of responses detected in that region. The letters A and B mark the locations of the representative units shown in panels a and b. Source data
Fig. 3
Fig. 3. High-gamma auditory responses and entrainment to 40-Hz click-trains during NREM sleep.
a, Representative spectrogram of induced LFP high-frequency power in response to music during wakefulness (left) and NREM sleep (right). Color bar on right. Black rectangles represent time–frequency regions-of-interest used for subsequent quantification. Top, grayscale soundwave spectrograms (lighter shades denote stronger power). b, Time-courses of high-gamma (80–200 Hz) responses shown in a. Horizontal bars and vertical black lines as in Fig. 2a. c, Scatter plot of high-gamma responses (% increase from baseline) during NREM sleep (y axis) versus wakefulness (x axis). Gain histogram in upper-right inset as in Fig. 2b; black and gray lines represent distributions for LFP and iEEG data, respectively. Each data point represents the averaged response across stimuli and trials per electrode (n = 556 responses/74 LFP microwires, black dots (CI (−23.732, 8.426), P = 0.276); 320 responses/55 iEEG channels, white circles (CI (−0.461, 55.422), P = 0.205); six patients). d, High-gamma gain values (NREM versus wakefulness) in each region exhibiting auditory high-gamma responses. Circle positions, color and size as in Fig. 2c. The letter A marks location of the representative microwire shown in panel a and b. e, Representative time-courses of LFP high-gamma responses showing a tight relationship with the sound envelope of auditory stimulus. f, Robust correlation between LFP high-gamma responses and the sound envelope in both wakefulness and NREM sleep. LFP: r(NREM-wake) = −0.002, CI (−0.02, 0.03), P = 0.88 for n = 406 responses/64 microwires/6 patients; iEEG: r(NREM-wake) = 0.04, CI (−0.07, −0.01), P = 0.006 for n = 210 responses/40 macroelectrodes/6 patients. g, Scatter plot of the degree of response attenuation in NREM sleep (y axis) versus latency of gamma LFP response (x axis) in each microwire (n = 25); Pearson correlation coefficient: r = 0.73, P < 0.001 by permutation test. Cyan dots mark adjacent microwires that exhibit different sleep attenuations and latencies. h, iEEG ITPC in response to a 40-Hz click-train in wakefulness (top), and associated Event-Related Potential (ERP) (bottom). i, Scatter plot of ITPC in response to 40-Hz click-trains during NREM sleep (y axis) versus wakefulness (x axis). Inset and format as in panel c. Each data point in scatter represents the averaged response across stimuli and trials per electrode. n = 84 LFP microwires/12 patients (black dots, CI (−40.9, 8.7), P = 0.176) and n = 325 iEEG macroelectrodes/13 patients (white circles, CI (−49.9, −2.0), P = 0.036). Mean and P values were calculated using a nested mixed model analysis for panels c and f and a one-level mixed model for panel i (Methods). Source data
Fig. 4
Fig. 4. NREM sleep disrupts auditory-induced LFP ABD.
a, Representative spectrogram of auditory-induced LFP power (<50 Hz) in response to music during wakefulness (left) and NREM sleep (right). Colder colors (for example, blue) denote a decrease in power (dB scale, color bar on right). Black rectangles represent time–frequency regions-of-interest used for subsequent quantification. b, Time-course of induced alpha–beta (10–30 Hz) power dynamics shown in a. Pink, wakefulness; green, NREM sleep. Horizontal pink bars above the time-course indicate automatically detected response intervals (Methods) for which the response magnitude was compared quantitatively (significant decreases were not detected in sleep). Vertical black lines mark stimulus onset and offset. c, Scatter plot of all auditory-induced ABD responses (% power decrease below baseline) during NREM sleep (y axis) versus wakefulness (x axis), together with a histogram of gain values comparing response magnitude (upper-right corner along the unity diagonal; black and gray lines in top-right inset represent distributions for LFP and iEEG data, respectively). Each data point in scatter represents the averaged response across stimuli and trials per electrode. n = 244 responses/57 LPF microwires/7 patients (black dots, CI (−84.434, −2.258), P = 0.042) and n = 188 responses/29 iEEG electrodes/5 patients (white dots, CI (−92.899, −70.678), P < 0.001). Mean and P values were calculated using a nested mixed model analysis. d, ABD gain values (NREM versus wakefulness) in each region exhibiting such responses. The position of each circle represents its anatomical location shown on a standard (MNI) brain template, the circle’s color reflects the average gain detected in that region (color bar on right) and the circle’s size reflects the number of responses detected in the region. The letter A marks the location of the representative microwire shown in panel a. e, Scatter plot of ABD gain values (y axis) versus latency of ABD (x axis) in each microwire (n = 18). Pearson correlation coefficient r = 0.54, P < 0.001 by permutation test. Cyan dots mark adjacent microwires that exhibit different sleep attenuations and latencies. Source data
Fig. 5
Fig. 5. Auditory responses in REM sleep.
a, Two representative raster plots (top) and PSTHs (bottom) of spiking response of neuronal units to auditory stimuli (left, click-train; right, word) in the primary auditory cortex. Pink, wakefulness; green, REM sleep. Vertical dotted black lines mark stimulus onset and offset. Horizontal bars above the PSTH time-courses indicate automatically detected response intervals (Methods) for which the magnitude of the response was compared quantitatively. b, Scatter plot of auditory spiking response magnitudes during REM sleep (y axis) versus wakefulness (x axis), together with a histogram of gain values comparing response magnitudes (upper-right corner along the diagonal). n = 141 responses/25 clusters/2 patients (CI (−31.763, −2.739), P = 0.022). c, Scatter plot of high-gamma responses to auditory stimuli during REM sleep (y axis) versus wakefulness (x axis), with a histogram of gain values comparing response magnitude (upper-right corner along the unity diagonal; black and gray lines in top-right inset represent gain distributions for LFP and iEEG data, respectively). Each data point represents the averaged response across stimuli and trials per electrode. n = 286 responses/33 LFP channels/2 patients (CI (−34.726, −12.838), P < 0.001) and n = 197 responses/30 iEEG channels/3 patients (CI (8.328, 22.630), P < 0.001)). d, Scatter plot of ABD responses to auditory stimuli in REM sleep (y axis) versus wakefulness (x axis). Histograms in top-right inset represent gain distributions above. n = 154 responses/32 LFP channels/3 patients (CI (−75.132, −52.207), P < 0.001) and n = 217 responses/36 iEEG channels/4 patients (CI (−78.814, −55.867), P < 0.001). e, Scatter plot of ITPC in response to 40-Hz click-trains during REM sleep (y axis) versus wakefulness (x axis), with a histogram of gain values as above. n = 60 LFP microwires/8 patients and n = 326 iEEG electrodes/9 patients. Each data point represents the averaged response across trials per electrode. Mean and P values were calculated using a one-level mixed model analysis (Methods); ***P < 0.001. Source data
Extended Data Fig. 1
Extended Data Fig. 1. Sleep scoring.
Representative time–frequency representation (spectrogram) of iEEG recorded during a nap session. Warm colors (for example red) indicate increased power in specific time–frequency windows (frequency shown on left side of y-axis). Superimposed hypnograms (in black) present the time-course of sleep/wake states (shown on right side of y-axis); top, one nap session with automatic sleep scoring; and bottom, one nap session with full PSG.
Extended Data Fig. 2
Extended Data Fig. 2. Additional examples of neuronal auditory responses during wakefulness and sleep.
Representative raster plots and PSTHs of unit spiking activities in auditory cortex in response to auditory stimuli (words in dark blue, sentence in orange, 40 Hz click-train in red, music in purple) during wakefulness (pink) and NREM sleep (light green) or REM sleep (dark green). Grayscale soundwave spectrograms are shown above each raster (lighter shades denote stronger power). Vertical dotted black lines mark stimulus onset and offset. Horizontal bars above PSTH time-courses indicate automatically-detected response intervals (Methods) for which the response magnitudes were compared quantitatively.
Extended Data Fig. 3
Extended Data Fig. 3. Anatomical location of auditory-responsive units.
Each triplet of brain images shows sagittal (left), axial (middle), and coronal (right) MRI sections. Colored dots denote the location of the microwire bundle as identified by co-registration of post-implant CT with pre-implant MRI (Methods), using native (individual) patient coordinates. Abbreviations: mHG=medial Heschl Gyrus; medT operculum=medial Temporal operculum; pMTG= posterior Middle Temporal Gyrus; mid HG = middle Heschl Gyrus; aTG= anterior Superior Temporal Gyrus.
Extended Data Fig. 4
Extended Data Fig. 4. Additional examples of LFP and iEEG induced high-gamma auditory responses during wakefulness and NREM sleep.
LFP and iEEG induced high-gamma (80–200 Hz) power time-courses during wakefulness (pink) and NREM sleep (green) in response to different type of stimuli (words in blue, sentence in orange, 40 Hz click-train in red, music in brown). Grayscale soundwave spectrograms are shown above each raster (lighter shades denote stronger power).
Extended Data Fig. 5
Extended Data Fig. 5. Low gamma responses during NREM and REM sleep compared to wakefulness.
(a) Scatter plot of all low-gamma (40–80 Hz) averaged response magnitudes (% increase from baseline) per channel (mean gain = +10.53%, n = 417 responses/ 61 LFP microwires / five patients (black dot, p = 0.53, CI [-36.712, 57.781]) and mean gain: +12.46%, 293 responses/ 43 iEEG macrowires / seven patients (white circle, p = 0.3, CI [-19.986, 44.912]) in NREM sleep (y-axis) vs. wakefulness (x-axis), together with a histogram of gain values comparing response magnitude (upper-right corner along the unity diagonal, black and gray lines in top right inset represent gain distributions for LFP and iEEG data, respectively). (b) Same as (a) in REM sleep. (mean gain = −24.06%, p = 0.004, CI [-39.552, -8.562], n = 285 responses/ 31 LFP microwires/ two patients (black dot) and mean gain = -28.09%, p = 0.002, CI [-44.166, -12.022], 200 responses/ 34 iEEG channels / four patients (white circle)). Data point represent the averaged response per channel. Mean and p-value were calculated using a mixed model analysis (see Methods). In LFP microwires, neither anatomical location (A1 vs outside A1) or stimulus type affected the response magnitude during sleep (p = 0.27 and p = 0.49, respectively). Source data
Extended Data Fig. 6
Extended Data Fig. 6. Factors associated with the degree of auditory response attenuation in NREM sleep.
(a) Representative low-gamma response to a 40 Hz click-train in wakefulness (pink) and NREM sleep (green) shows differences between early vs. sustained response components. (b) Quantitative analysis across all low-gamma responses to 40 Hz click-trains (mean ± SEM across n = 25 LFP microwires) reveals that sustained responses show a stronger attenuation than early response during NREM sleep (p = 5.1*10-05 by two sided Wilcoxon signed-rank test). Early responses were actually slightly potentiated during NREM sleep (positive gain of 0.27 p = 0.016 via signed-rank test): ***p < 0.001. Source data
Extended Data Fig. 7
Extended Data Fig. 7. Responses during N3 and high slow waves activity show more attenuation.
(a) High gamma gain during N3 vs N2 (black dots: n = 156 responses/ 22 LFP microwires / two patients, gain in N2 = −38.61 % vs in N3 = 41.78 %, p = 0.396; white circles: n = 53 responses/ 15 iEEG macroelectrodes / three patients, gain in N2 = −12.73% vs in N3 = −17.7%, p = 0.398). (b) Same for low gamma (black dots: n = 93 responses/ 15 LFP microwires / two patients, gain in N2 = −21.56% vs in N3 = 29.2%, p = 0.14; white dots: n = 123 responses/ 25 iEEG macroelectrodes / four patients, gain in N2 = −21.63% vs in N3 = −31.80%, p = 0.059). (c) Same for alpha-beta desynchronization (black dots: n = 105 responses/ 15 LFP microwires, gain in N2 = −73.48% vs in N3 = −84.00%, p < 0.001; white dots: n = 122 responses/ 16 iEEG macroelectrodes, gain in N2 = −86.03% vs in N3 = −98.72%, p < 0.001). The number of patients is lower because we only used sessions with full PSG (as automatic sleep scoring did not allow us to differentiate between N2 and N3) and that include N2 and N3 epochs. (d) Auditory spike responses during NREM sleep with high (top 20%) SWA show stronger attenuation compared to periods of low (bottom 20%) SWA (gain for low SW = −27% vs for high SW = −41%, p < 0.001). A similar effect (not shown graphically) was found for periods of high sigma (10–16 Hz) power representing spindle activities (gain = −19.5%, p = 0.001, n = 263 responses/55 clusters/six patients). Response magnitudes in spiking activity in deep vs. shallow NREM sleep were compared in high versus low SWA, rather than in N3 vs. N2 sleep (more simultaneous data allowing for paired comparisons). Data point represent the averaged response per channel. Mean and p-value were calculated using an one level (channels) mixed model analysis. Source data
Extended Data Fig. 8
Extended Data Fig. 8. Additional examples of LFP alpha-beta auditory responses.
LFP induced alpha-beta (10–30 Hz) power time-courses during wakefulness (pink) and NREM sleep (green) reveal disrupted alpha-beta responses during sleep in response to different type of stimuli (words in blue, sentence in orange, click-train in red, music in brown). Grayscale soundwave spectrograms are shown above each raster (lighter shades denote stronger power).
Extended Data Fig. 9
Extended Data Fig. 9. Correlation between gain during NREM and REM sleep.
(a) High gamma power auditory responses (n = 32 LFP microwires (black dots) and 30 iEEG macroelectrodes (white circles) in REM sleep (y-axis) vs. NREM sleep (x-axis) show significant correlation. Each dot represents the averaged response per channel (b) Same as (a) for ABD (n = 32 LFP microwires (black dots) and 36 iEEG electrodes (white circles)). (c) Scatter plot of inter-trial phase coherence (ITPC) of 40 Hz LFP (black dots) and iEEG (white dots) responses (n = 60 and 326 respectively) in REM sleep (y-axis) vs. NREM sleep (x-axis); ***p < 0.001. Data point represent the averaged response per channel. Mean and p-value were calculated using a mixed model analysis. Source data

References

    1. Anafi RC, Kayser MS, Raizen DM. Exploring phylogeny to find the function of sleep. Nat. Rev. Neurosci. 2019;20:109–116. doi: 10.1038/s41583-018-0098-9. - DOI - PubMed
    1. Campbell SS, Tobler I. Animal sleep: a review of sleep duration across phylogeny. Neurosci. Biobehav. Rev. 1984;8:269–300. doi: 10.1016/0149-7634(84)90054-X. - DOI - PubMed
    1. Cirelli C, Tononi G. Is sleep essential? PLoS Biol. 2008;6:1605–1611. doi: 10.1371/journal.pbio.0060216. - DOI - PMC - PubMed
    1. Siegel JM. Do all animals sleep? Trends Neurosci. 2008;31:208–213. doi: 10.1016/j.tins.2008.02.001. - DOI - PMC - PubMed
    1. Nath RD, et al. The jellyfish Cassiopea exhibits a sleep-like state. Curr. Biol. 2017;27:2984–2990.e3. doi: 10.1016/j.cub.2017.08.014. - DOI - PMC - PubMed

Publication types