

Obesity and "obesity-related" cancers: are there body mass index cut-points?
- PMID: 35817851
- PMCID: PMC9615027
- DOI: 10.1038/s41366-022-01178-0
Obesity and "obesity-related" cancers: are there body mass index cut-points?
Abstract
Background: Despite compelling links between excess body weight and cancer, body mass index (BMI) cut-points, or thresholds above which cancer incidence increased, have not been identified. The objective of this study was to determine if BMI cut-points exist for 14 obesity-related cancers.
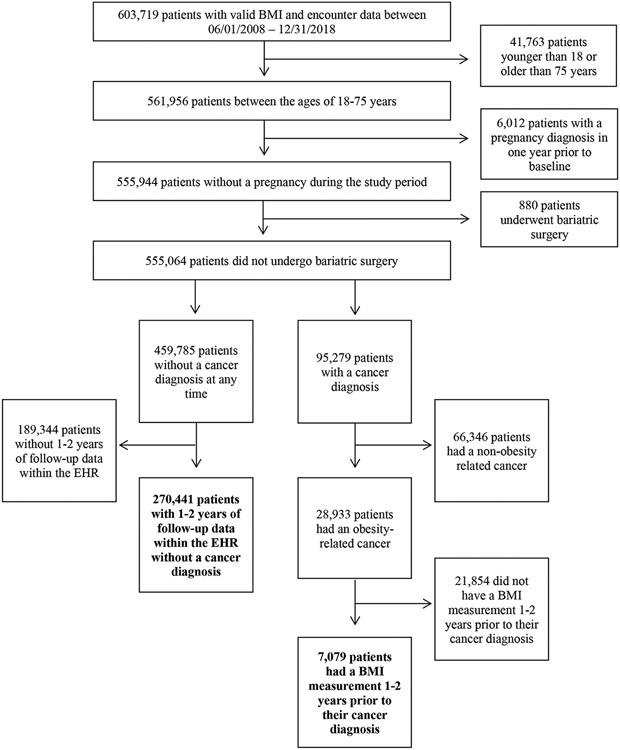
Subjects/methods: In this retrospective cohort study, patients 18-75 years old were included if they had ≥2 clinical encounters with BMI measurements in the electronic health record (EHR) at a single academic medical center from 2008 to 2018. Patients who were pregnant, had a history of cancer, or had undergone bariatric surgery were excluded. Adjusted logistic regression was performed to identify cancers that were associated with increasing BMI. For those cancers, BMI cut-points were calculated using adjusted quantile regression for cancer incidence at 80% sensitivity. Logistic and quantile regression models were adjusted for age, sex, race/ethnicity, and smoking status.
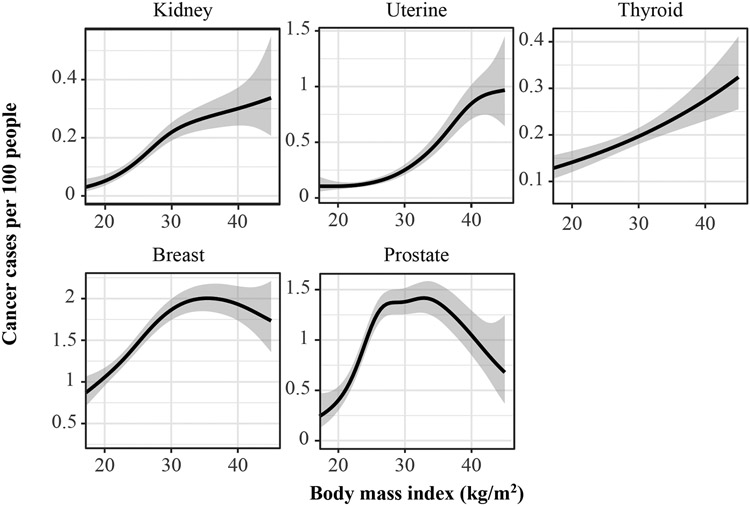
Results: A total of 7079 cancer patients (mean age 58.5 years, mean BMI 30.5 kg/m2) and 270,441 non-cancer patients (mean age 43.8 years, mean BMI 28.8 kg/m2) were included in the study. In adjusted logistic regression analyses, statistically significant associations were identified between increasing BMI and the incidence of kidney, thyroid, and uterine cancer. BMI cut-points were identified for kidney (26.3 kg/m2) and uterine (26.9 kg/m2) cancer.
Conclusions: BMI cut-points that accurately predicted development kidney and uterine cancer occurred in the overweight category. Analysis of multi-institutional EHR data may help determine if these relationships are generalizable to other health care settings. If they are, incorporation of BMI into the screening algorithms for these cancers may be warranted.
© 2022. This is a U.S. Government work and not under copyright protection in the US; foreign copyright protection may apply.
Conflict of interest statement
Competing Interests:
The authors declare no conflicts of interest related to these funding sources.
Figures


References
-
- National Center for Health Statistics. National Health and Nutrition Examination Survey, 2017-2018 data: CDC. 2020. Available from: https://www.cdc.gov/nchs/data/factsheets/factsheet_nhanes.pdf.Date Accessed November 2, 2020.
-
- National Center for Health Statistics. Obesity and Overweight: CDC. 2018. Available from: https://www.cdc.gov/nchs/fastats/obesity-overweight.htm.Date Accessed November 2, 2020.
-
- Choi EK, Park HB, Lee KH, Park JH, Eisenhut M, van der Vliet HJ, et al. Body mass index and 20 specific cancers: re-analyses of dose-response meta-analyses of observational studies. Ann Oncol. 2018;29(3):749–57. - PubMed
-
- Keum N, Greenwood DC, Lee DH, Kim R, Aune D, Ju W, et al. Adult weight gain and adiposity-related cancers: a dose-response meta-analysis of prospective observational studies. J Natl Cancer Inst. 2015;107(2). - PubMed
Publication types
MeSH terms
Grants and funding
LinkOut - more resources
Full Text Sources
Medical
