. 2022 Jul;4(7):883-900.
doi: 10.1038/s42255-022-00587-9. Epub 2022 Jul 11.

Food-seeking behavior is triggered by skin ultraviolet exposure in males

Affiliations

Food-seeking behavior is triggered by skin ultraviolet exposure in males

Shivang Parikh et al. Nat Metab. 2022 Jul.

Abstract

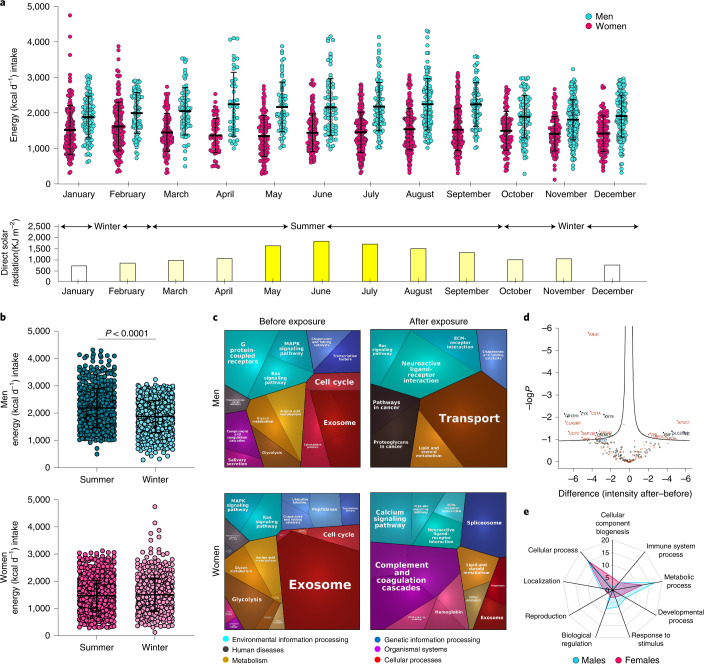
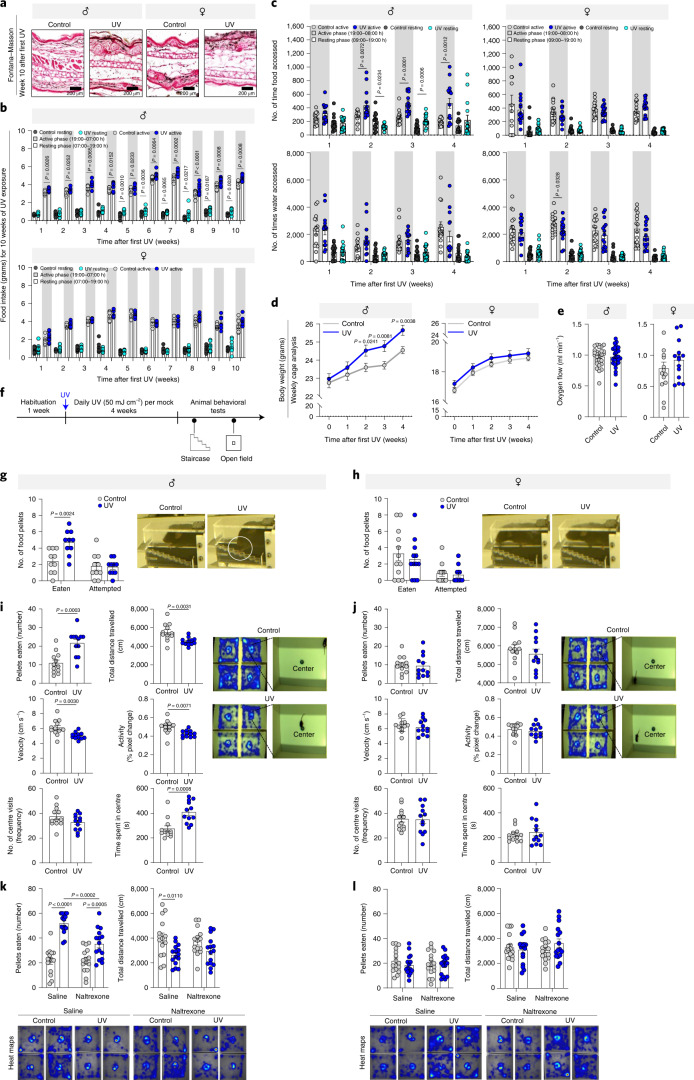
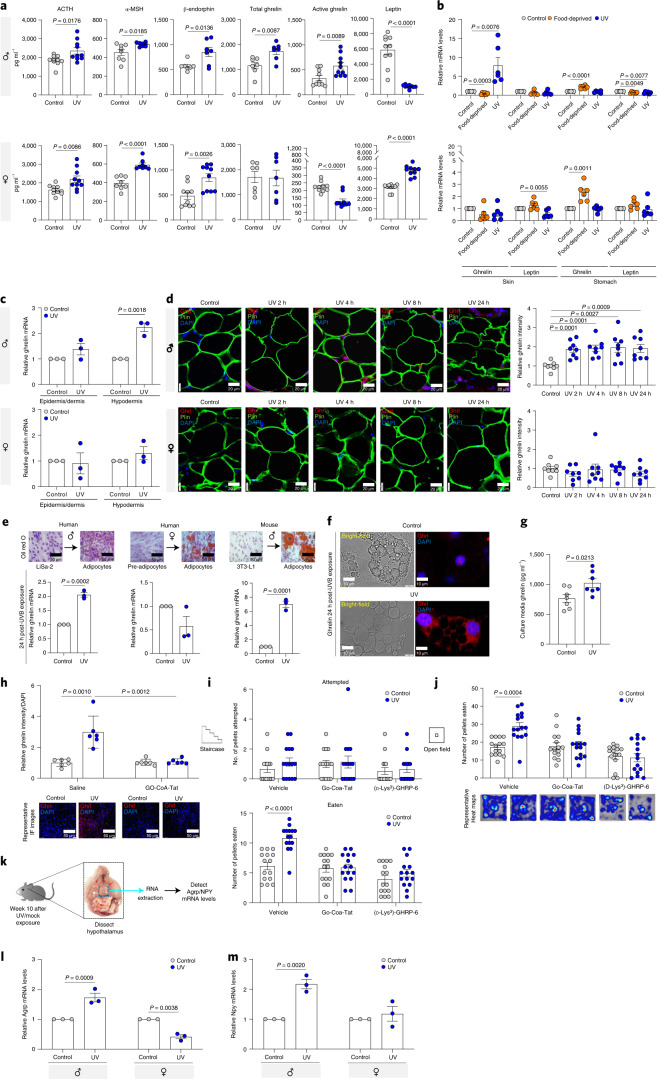
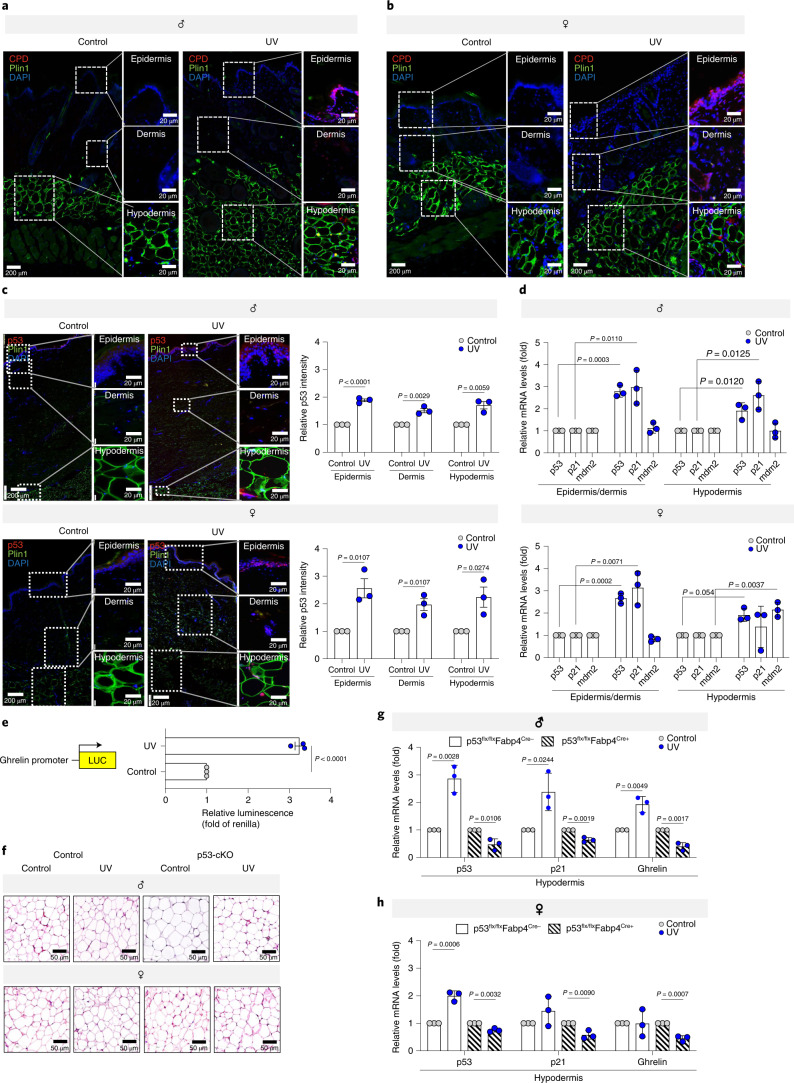
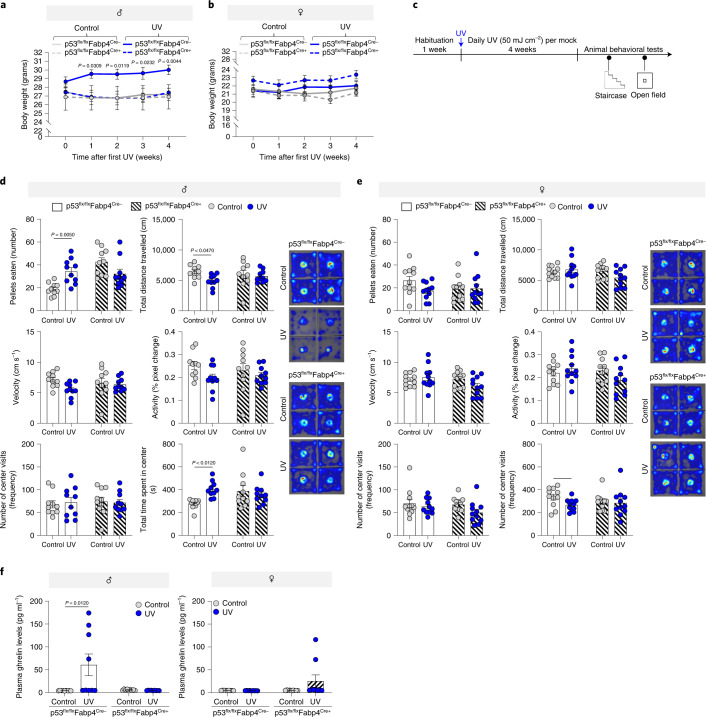
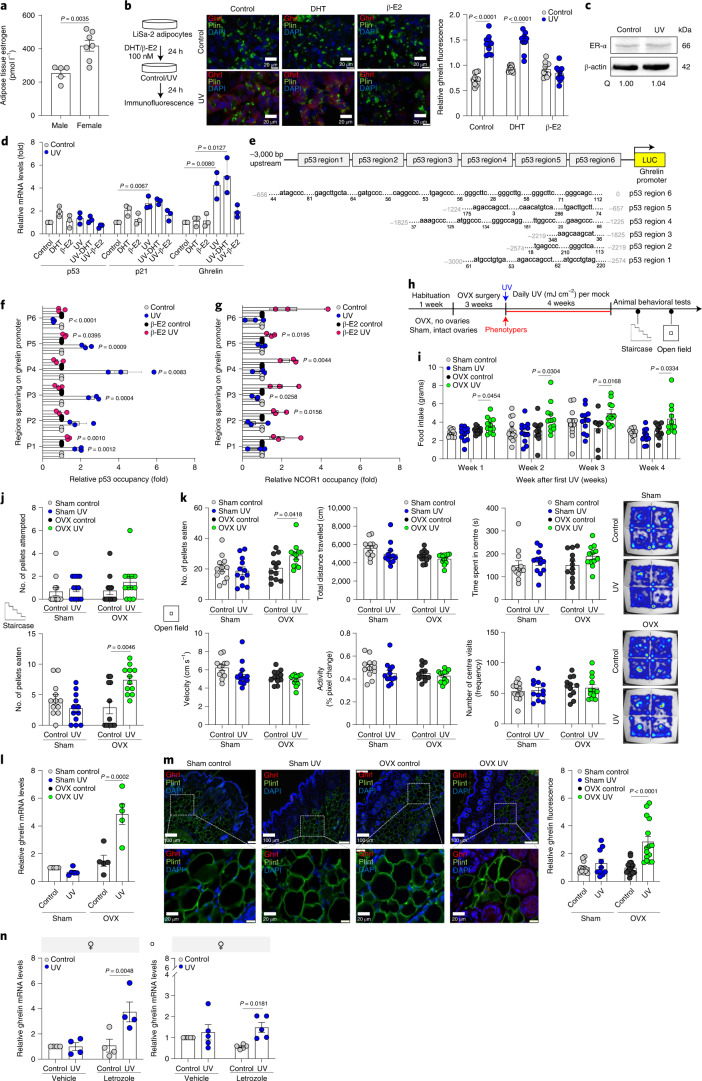
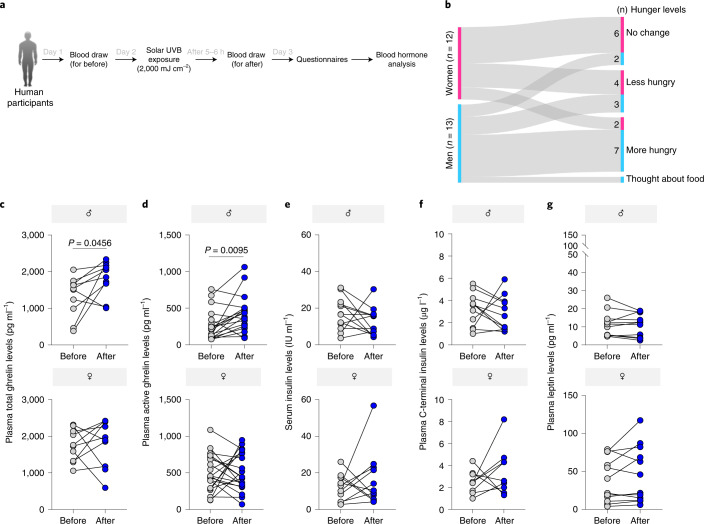
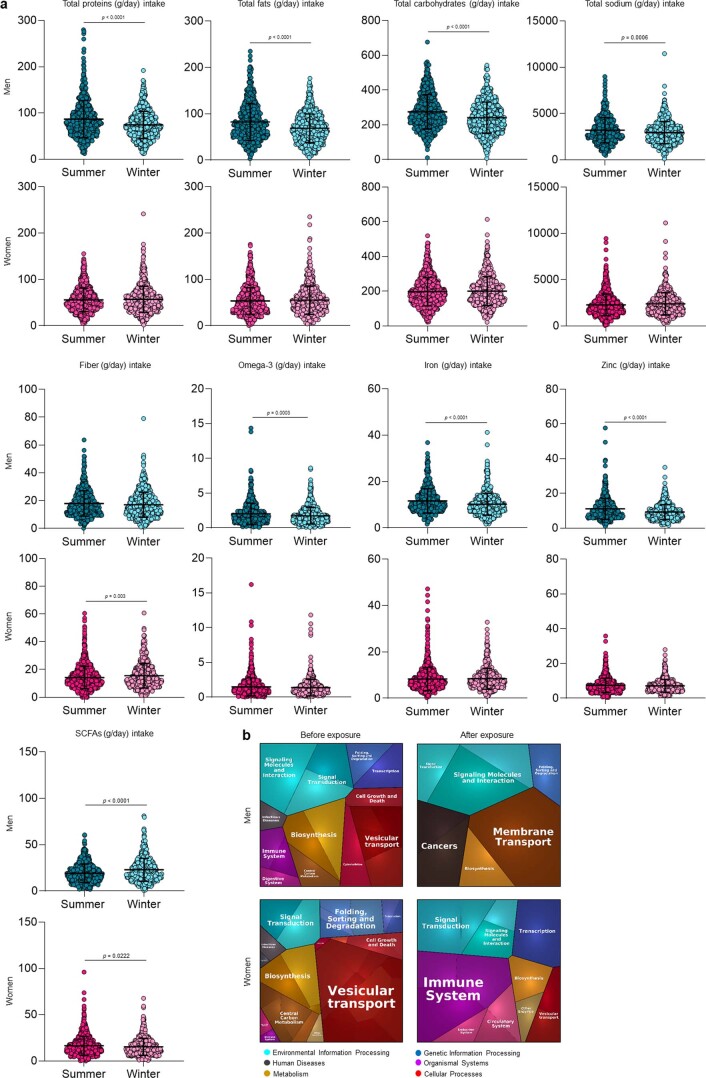
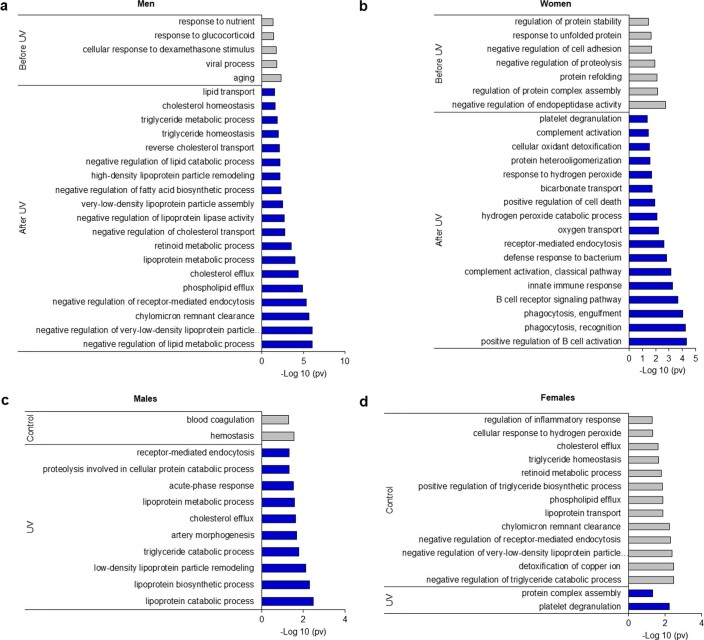
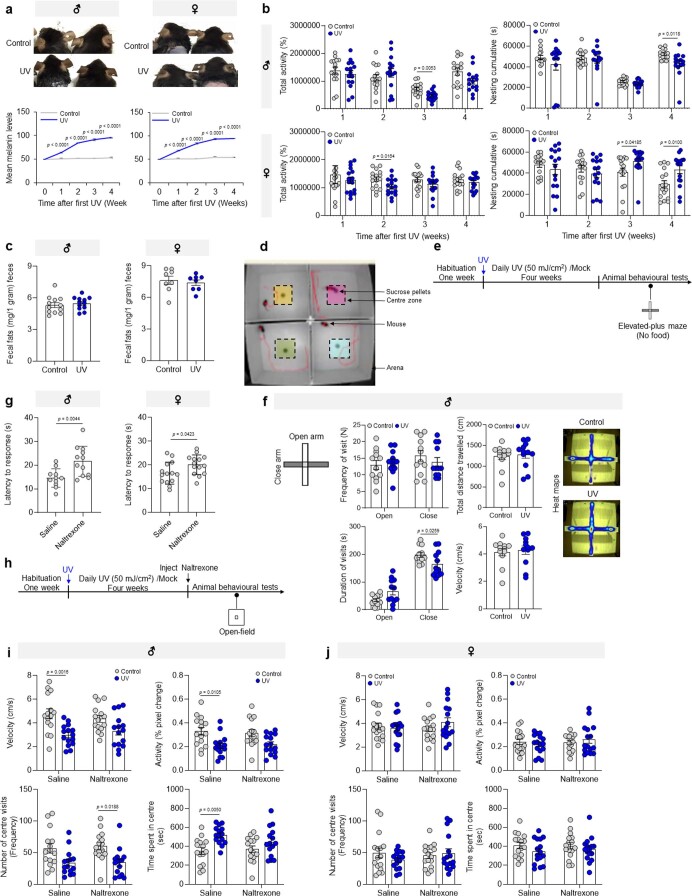
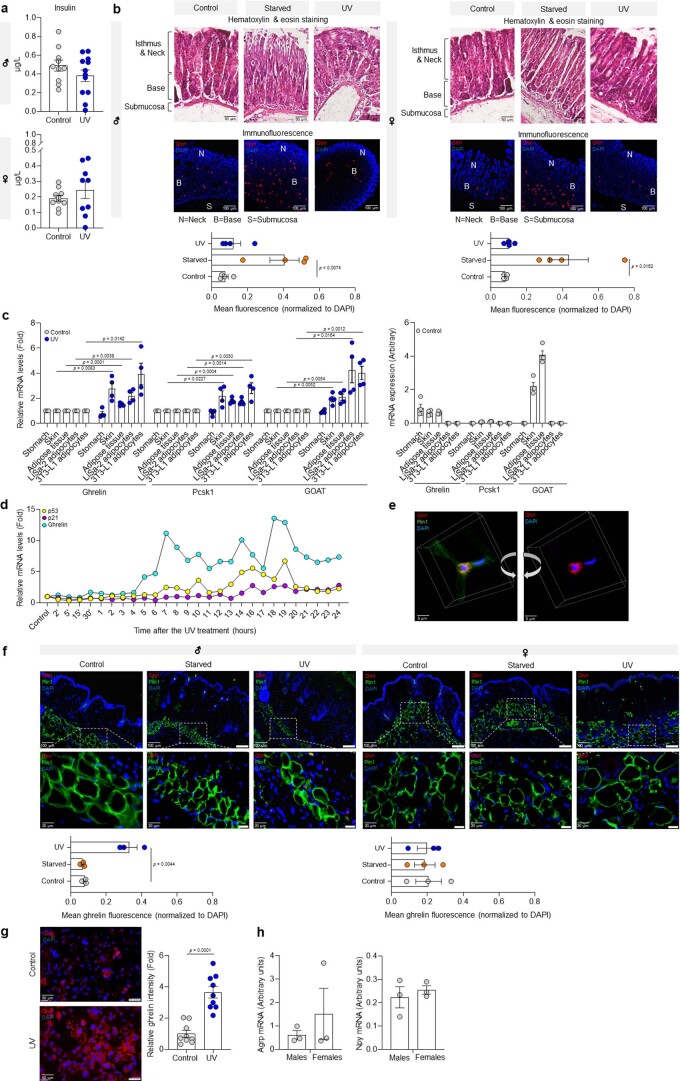
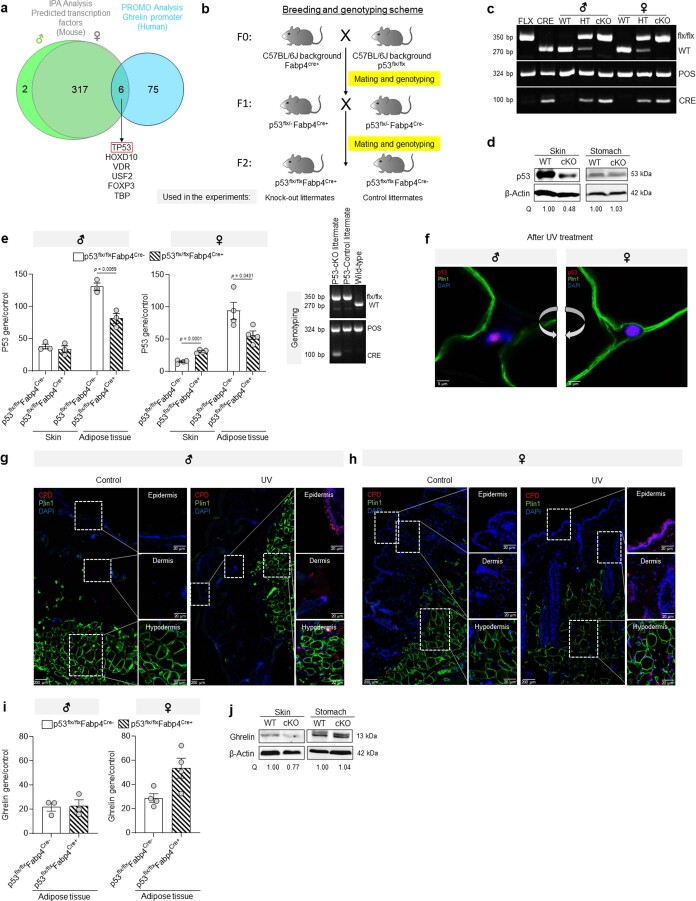
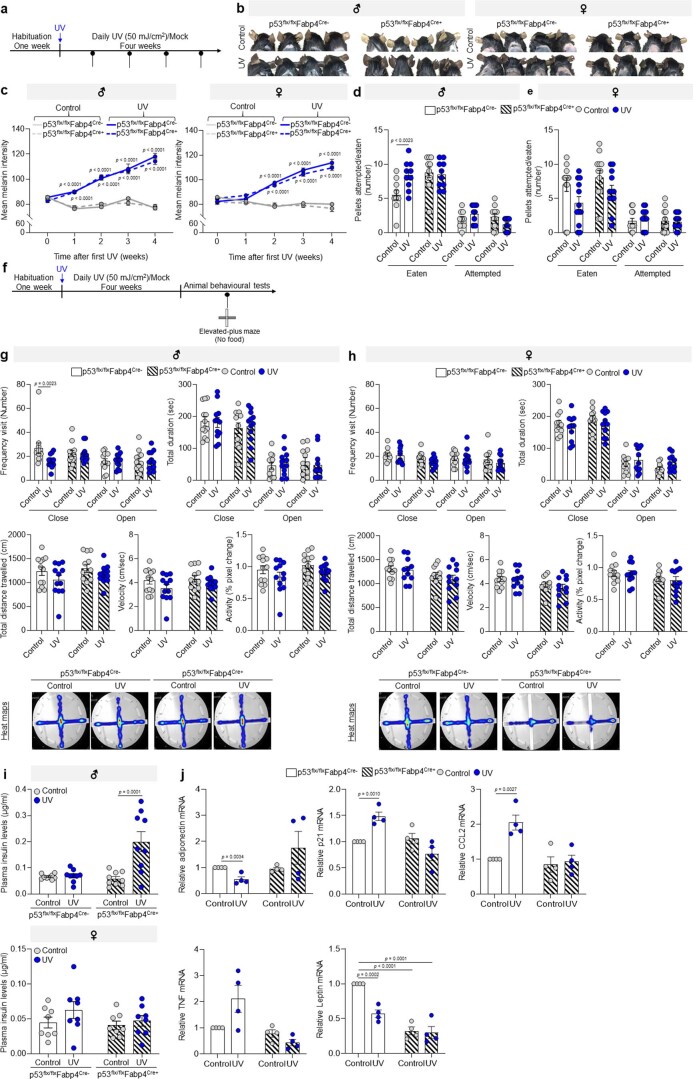
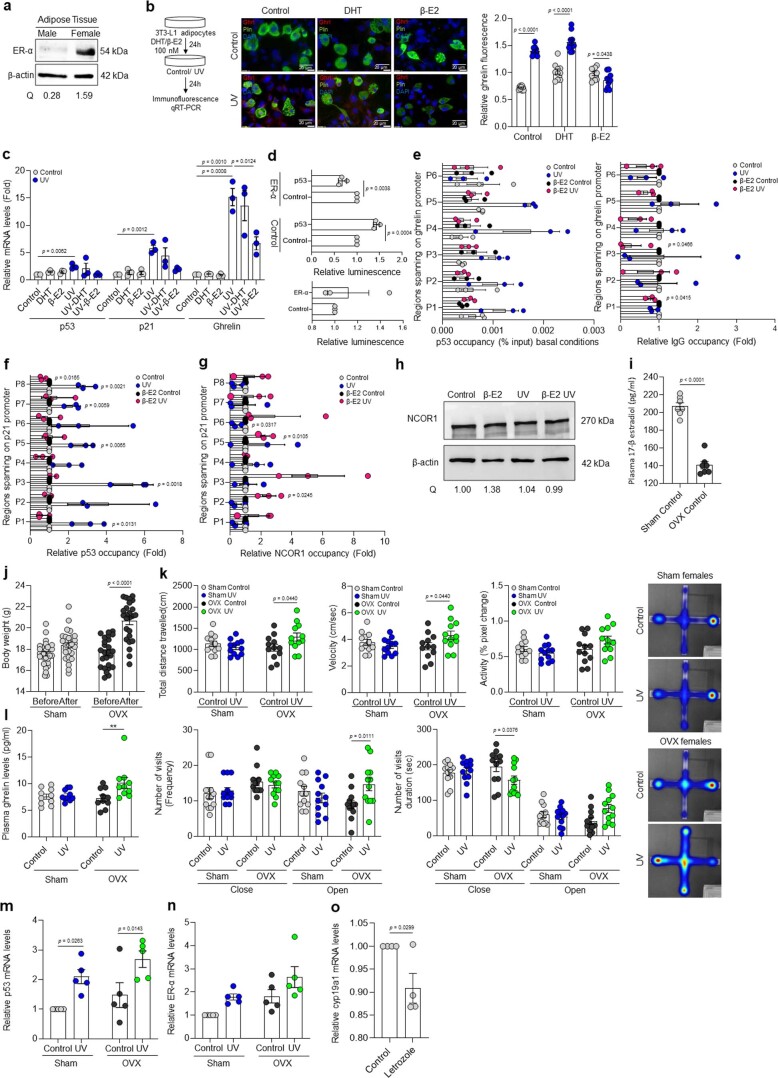
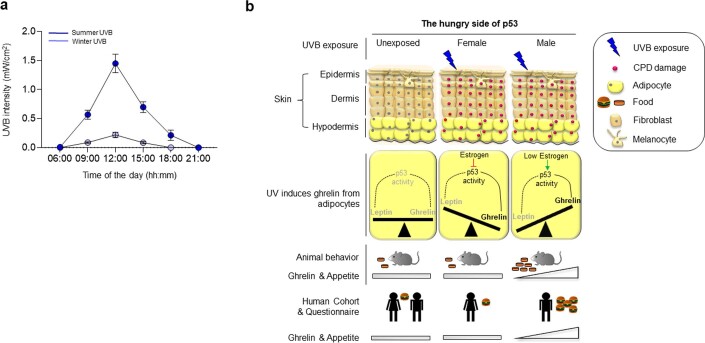
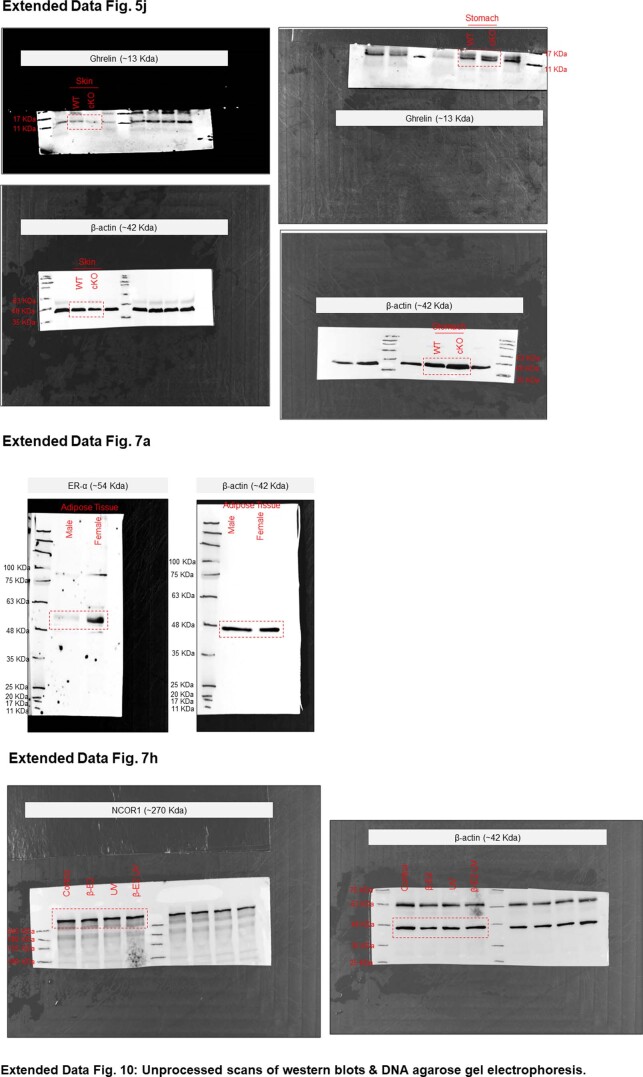
Sexual dimorphisms are responsible for profound metabolic differences in health and behavior. Whether males and females react differently to environmental cues, such as solar ultraviolet (UV) exposure, is unknown. Here we show that solar exposure induces food-seeking behavior, food intake, and food-seeking behavior and food intake in men, but not in women, through epidemiological evidence of approximately 3,000 individuals throughout the year. In mice, UVB exposure leads to increased food-seeking behavior, food intake and weight gain, with a sexual dimorphism towards males. In both mice and human males, increased appetite is correlated with elevated levels of circulating ghrelin. Specifically, UVB irradiation leads to p53 transcriptional activation of ghrelin in skin adipocytes, while a conditional p53-knockout in mice abolishes UVB-induced ghrelin expression and food-seeking behavior. In females, estrogen interferes with the p53-chromatin interaction on the ghrelin promoter, thus blocking ghrelin and food-seeking behavior in response to UVB exposure. These results identify the skin as a major mediator of energy homeostasis and may lead to therapeutic opportunities for sex-based treatments of endocrine-related diseases.


Conflict of interest statement

The authors declare no competing financial interests.

Figures

Fig. 1
Fig. 1. Solar exposure enhances the energy intake and metabolic profile of men compared to women.
a, Dot plot of the monthly energy intake (Kcal per day), from 1999 to 2001, of 2,991 men (cyan blue) and women (pink) (top). Midline represents the median. Data are presented as mean ± SD. Men’s energy consumption was significantly higher during the summer (2,188 Kcal versus 1,875 Kcal, p < 0.001), while energy consumption in women remained constant (1,507 Kcal versus 1,475 Kcal, p = 0.795). Lower panel: Monthly average of direct solar radiation (KJ/m); yellow intensity reflects the radiation strength. b, Energy intake (Kcal per day) of men (top) and women (lower panel) in winter (October to February) and summer (March to September). Each individual participant is represented by a dot (summer: n = 556 men, n = 1,045 women; winter: n = 774 men, n = 616 women). Data are presented as mean ± SD. For the statistical analysis, unpaired t-test assuming unequal variance with Welch’s correction was performed. We found that men consume more calories during the summer than in the winter (p < 0.001), while the calorie intake of women was similar (p = 0.27) between the two seasons, demonstrating that only men are affected by the seasonal change. c, Proteomics analysis, shown as Proteomap, illustrates the functional categories of men (top) and women (bottom) blood plasma proteins before (left panel) and after (right) exposure to 2,000 mJ/cm2 solar UVB. Data presented in each polygon represents proteins in a single KEGG pathway with >2 fold change (n = 5 biologically independent human subjects per condition). d, Volcano plot of differentially expressed proteins in men (before/after solar UVB exposure) by log2 fold change; metabolic-related proteins are marked orange. e, Radar map of Gene Ontology enrichment of differentially expressed proteins identified by mass spectrometry analysis of blood plasma proteins from mice after UVB (50 mJ/cm2) or mock UVB (control) irradiation (n = 3 biologically independent mice per condition). Source data
Fig. 2
Fig. 2. Daily UVB radiation enhances food-seeking behavior in males.
a, Fontana–Masson staining of representative ear sections of mice exposed to daily UVB (50 mJ/cm2) or mock-UVB mice (control). b, Weekly food intake of standard chow food (in grams) during the resting and active phases. (n = 10 biologically independent mice per condition). c, PhenoTyper analysis upon daily UVB (50 mJ/cm2) or mock-UVB (control) for 4 weeks: number of times accessing food (upper panel) or water (lower panel) during the resting and active phases (n = 15 biologically independent male mice per condition; n = 16 biologically independent female mice per condition). d, Weekly mean body weight (grams) after daily UVB (50 mJ/cm2) or mock-UVB (control) irradiation (n = 12 biologically independent mice per condition). e, Respirometry analysis of UVB (50 mJ/cm2) or mock-UVB (control) treated mice 10 weeks after the first UVB treatment. Dot plot represents oxygen flow (ml/min) VO2 consumed at rest (n = 29 for control and n = 28 biologically independent male mice and n = 14 biologically independent female mice per condition). f, Experimental design for gj. g,h, Staircase test (g) male and (h) female mice (n = 10 biologically independent male per condition and n = 12 biologically independent female mice per condition) (left). Representative images from the video of the test session (right). i,j, Open-field for (i) male and (j) female mice (n = 12 biologically independent mice per condition) (left). Heat maps representative images (right). Far-right: Representative images from the video of the test session. k,l, Mice irradiated daily with UVB (50 mJ/cm2) or mock-UVB (control) for 8 weeks and injected with opioid antagonist (naltrexone (5 mg/kg)) or saline 30 min before the open-field test. Upper panel: Number of sucrose pellets eaten and the total distance travelled by (k) male and (l) female (n = 15 biologically independent male mice per condition and n = 16 biologically independent female mice per condition). Representative heat maps (bottom). In all relevant panels, data are presented as mean ± SEM; Two-tailed unpaired t-test p-values are shown or statistical details for sex or UVB or naltrexone factors in the ANOVAs (F-values, degrees of freedom, p-value) with interaction appears in Supplementary Table 10 or two-way ANOVA analysis with multiple correction test appears in Supplementary Table 11. Source data
Fig. 3
Fig. 3. UVB radiation induces ghrelin production and secretion in skin adipocytes.
a, Plasma levels of indicated proteins upon UVB (50 mJ/cm2) or mock-UVB (control) radiation, 10 weeks post first treatment (ACTH, active ghrelin and leptin: n = 10 biologically independent mice per condition; α-MSH: n = 8 biologically independent mice per condition; Total ghrelin: n = 7 biologically independent mice per condition; β-endorphin: n = 7 biologically independent mice in each condition for males and n = 10 biologically independent female mice per condition). b, Relative ghrelin and leptin mRNAs levels from stomach and skin tissues of control, UVB (50 mJ/cm2) irradiated, or 22-h-food-deprived mice, 5 weeks after the first UVB exposure (n = 5 biologically independent mice per condition). Data normalized to 36b4. c, ghrelin mRNA levels upon 5 days daily UVB- (500 mJ/cm2) or mock-UVB (control) irradiated human skin (n = 3 biologically independent human donors per condition). Data normalized to 36b4. d, Immunofluorescence analyses of ghrelin (red), perilipin 1 (Plin1, an adipocyte marker, green) and nuclei (DAPI, blue) in human skin adipose tissue at the indicated time points after a single UVB (2,000 mJ/cm2) or control exposure. Graphs are ghrelin fluorescence intensity normalized to DAPI (n = 8 fields from 3 biologically independent human donors). e, Indicated cell lines differentiated into mature adipocytes (validated with Oil Red O staining). Bottom panel: Relative ghrelin mRNA levels in UVB-irradiated (50 mJ/cm2) or control indicated cells, 24 h after the treatment (n = 3 biologically independent samples per condition). Data normalized to 18S or 36b4. f, Immunofluorescence of ghrelin (red) and nuclei (DAPI, blue) in differentiated 3T3-L1 adipocytes from (e). g, Secreted ghrelin levels from differentiated 3T3-L1 adipocytes from (e) (n = 8 biologically independent samples per condition). h, Differentiated 3T3-L1 adipocytes treated with ghrelin inhibitor (GO-CoA-Tat 6 µM) or saline for 3–4 h before treatment and immunofluorescence analysis as in (f) (n = 6 fields from 3 biologically independent samples for each condition). i, Staircase test analysis for male mice 8 weeks after initiation of daily UVB (50 mJ/cm2) or mock-UVB (control), treated with ghrelin inhibitor (GO-CoA-Tat (192 µg/Kg)), Ghrelin-receptor antagonist ([d-Lys3]-GHRP-6 (200 nmol/mouse)) or saline, 1–2 h before the staircase test (n = 15 biologically independent mice per condition). j, Upper panel: Open-field analysis for male mice treated as in (i) (n = 15 biologically independent mice per condition). k, Experimental design. l,m, Relative Agrp (l) and Npy (m) mRNA levels in the hypothalamus upon indicated treatments (n = 3 biologically independent mice per condition). Data normalized to 36b4. In all relevant panels: Data are presented as mean ± SEM; Two-tailed unpaired t-test p-values are shown, or statistical details for sex or UVB or treatment factors in the ANOVAs (F-values, degrees of freedom, p-value) with interaction appears in Supplementary Table 10, or two-way ANOVA analysis with multiple correction test appears in Supplementary Table 11. Source data
Fig. 4
Fig. 4. p53 regulates UVB-induced ghrelin expression.
a,b, Immunofluorescence analysis of the skin of control (a) male and (b) female mice (p53flx/flxFabp4Cre-) after 10 weeks of daily UVB (50 mJ/cm2) or control irradiation. Indicated skin layers stained for cyclobutane pyrimidine dimers (red), perilipin 1 (Plin1, an adipocyte marker, green) and nuclei (with DAPI, blue). c, Immunofluorescence analysis of human skin tissue at 24 h after either UVB (2,000 mJ/cm2) or mock-UVB (control) irradiation. p53 intensity was normalized to DAPI intensity. (n = 3 biologically independent human donors per condition). Representative images of male (left) and female (right) skin layers. d, mRNA levels of p53, p21 and mdm2 in the epidermis/dermis and hypodermis of indicated human skin tissue upon 5 days of either UVB (500 mJ/cm2/day) or control radiation (n = 3 biologically independent human donors per condition). Data normalized to 36b4. e, Luciferase activity downstream to the human ghrelin promoter (−3,000 bp upstream) in the presence of p53 or an empty vector (control) in H1299 cells 48 h after transfection. Firefly luciferase activity normalized to Renilla luciferase activity (n = 3 biologically independent samples per condition). f, H & E staining of adipose tissue from control (p53flx/flxFabp4Cre-) and p53-cKO (p53flx/flxFabp4Cre+) male and female mice after 10 weeks of daily exposure to UVB (50 mJ/cm2) or mock-UVB (control) irradiation. g, Relative p53, p21 mRNA levels and ghrelin from the hypodermis of dorsal skin of control (p53flx/flxFabp4Cre-) and p53-cKO (p53flx/flxFabp4Cre+) male mice after 10 weeks of daily UVB (50 mJ/cm2/day) or mock-UVB (control) irradiation (n = 3 biologically independent mice per condition). Data normalized to 36b4. h, Relative p53, p21 and ghrelin mRNA levels in the hypodermis of dorsal skin of control and p53-cKO female mice after 10 weeks of daily UVB (50 mJ/cm2/day) or mock-UVB (control) irradiation (n = 3 biologically independent mice per condition). Data normalized to 36b4. In all relevant panels: Data are presented as mean ± SEM; Two-tailed unpaired t-test p-values are shown and statistical details for sex or UVB or p53-cKO factors in the ANOVAs (F-values, degrees of freedom, p-value) with interaction appears in Supplementary Table 10. Source data
Fig. 5
Fig. 5. Deletion of p53 in skin adipocytes abrogates UVB-induced appetite enhancement.
a,b, Relative weekly body weight of male (a) and female (b) mice after 4 weeks of daily UVB (50 mJ/cm2) or control irradiation (Males: n = 10 biologically independent p53flx/flxFabp4Cre+ mice per condition and n = 7 biologically independent p53flx/flxFabp4Cre- mice per condition; Females: n = 9 biologically independent p53flx/flxFabp4Cre+ mice per condition and n = 11 biologically independent p53flx/flxFabp4Cre- mice per condition). c, Experimental design. d,e, Responses of control and p53-cKO (d) male and (e) female mice in the open-field test after 5 weeks of exposure to UVB (50 mJ/cm2) or mock-UVB (control) irradiation (n = 10 biologically independent male mice per condition and n = 11 biologically independent female mice per condition). Right panel: Representative heat map images from the video of the test session. f, Plasma protein levels of ghrelin in UVB (50 mJ/cm2) or mock-UVB (control)-irradiated control and p53-cKO male (left panel) and female (right panel) mice after 5 weeks of treatment (n = 9 biologically independent mice per condition). In all relevant panels: Data are presented as mean ± SEM; Two-tailed unpaired t-test p-values are shown, or statistical details for sex or UVB or p53-cKO factors in the ANOVAs (F-values, degrees of freedom, p-value) with interaction appears in Supplementary Table 10, or two-way ANOVA analysis with multiple correction test appears in Supplementary Table 11. Source data
Fig. 6
Fig. 6. Estrogen blocks p53 transcriptional activation of ghrelin upon UVB exposure.
a, Estrogen levels in human skin adipose tissue (n = 5 and n = 7 independent human male and female donors, respectively). b, Left: Experimental design. Right: Representative images of cells stained for ghrelin (red), perilipin 1 (Plin1, an adipocyte marker, green) and nuclei (with DAPI, blue) (n = 10 random fields from 3 biologically independent samples per condition). Relative ghrelin intensity was normalized to DAPI. c, ER-α protein levels in differentiated LiSa-2 adipocytes 24 h after UVB (50 mJ/cm2) or mock-UVB (control) irradiation treatments. β-actin was used as the loading control. Quantification of the protein amount normalized to β-actin (Q). d, mRNA levels of p53, p21 and ghrelin in differentiated LiSa-2 adipocytes 24 h post treatment with 100 nM DHT or 100 nM β-E2 or vehicle and UVB (50 mJ/cm2) or mock-UVB (control) irradiation (n = 3 biologically independent samples per condition). Data normalized to 36b4. e, Schematic representation of ghrelin promoter with p53 binding regions. f,g, p53 (f) and NCOR1 (g) occupancy over human ghrelin promoter in differentiated LiSa-2 adipocytes treated as in (c) (n = 3 biologically independent samples per condition). ChIP levels (fold) normalized to input. h, Experimental design. i, PhenoTyper analysis of weekly food intake (in grams) of indicated female mice as in (h) (Week 1 and 2: n = 12 biologically independent mice per condition; Week 3: n = 12 biologically independent mice per sham condition, n = 10 biologically independent mice for OVX control and n = 11 biologically independent mice for OVX UV; Week 4: n = 11 biologically independent mice per condition). j, Staircase test for indicated female mice and treatments as in (h) (n = 12 biologically independent mice per condition). k, Open-field analysis by the indicated mice and treatments (h) (n = biologically independent 12 mice per condition). Right panel: Representative heat maps. l, Relative ghrelin mRNA levels in OVX or sham female mice skin, after 5 weeks of daily UVB (50 mJ/cm2) or mock-UVB (control) exposures (n = 5 biologically independent mice per condition). Data normalized to 36b4. m, Upper panel: Representative immunofluorescence images stained as in (b), in skin tissue from (l). Ghrelin intensity normalized to DAPI (n = 10 images from 3 biologically independent mice per condition). n, Relative ghrelin mRNA levels in human female skin adipose tissue 25 h post treatment with estrogen inhibitor (leterozole (5 µM)) or vehicle (DMSO) and a single UVB (500 mJ/cm2) or mock-UVB (control) irradiation session (n = 4 biologically independent human donors per condition). Data normalized to 36b4. o, Relative ghrelin mRNA levels in differentiated primary human female adipocytes after treatment as in (n) (n = 5 biologically independent samples per condition). Data normalized to 36b4. In all relevant panels: Data are presented as mean ± SEM; Two-tailed unpaired t-test p-values are shown, or statistical details for OVX or UVB factors in the ANOVAs (F-values, degrees of freedom, p-value) with interaction appears in Supplementary Table 10, or two-way ANOVA analysis with multiple correction test appears in Supplementary Table 11. Source data
Fig. 7
Fig. 7. Solar exposure induces ghrelin and hunger in humans.
a, Experimental design. b, Sankey diagram of the number of women (pink) and men (cyan blue) with indicated responses to questions related to thoughts about food and hunger levels (n = 13 biologically independent human male subjects and n = 12 biologically independent human female subjects). cg, Blood plasma levels of indicated hormones on the day before and 5–6 h after a single solar UVB (2,000 mJ/cm2) exposure. (c) Blood plasma levels of total ghrelin (n = 10 biologically independent human subjects per sex). (d) Blood plasma levels of active ghrelin (n = 18 biologically independent human male subjects and n = 20 biologically independent human female subjects). (e) Blood serum levels of insulin (n = 12 biologically independent human male subjects and n = 11 biologically independent human female subjects). (f) Blood plasma levels of C-terminal insulin (n = 11 biologically independent human male subjects and n = 9 biologically independent human female subjects). (g) Blood plasma levels of leptin (n = 11 biologically independent human male subjects and n = 12 biologically independent human female subjects). In all relevant panels: Data are presented as mean ± SEM; the changes before and after for each subject; a paired two-tailed t-test p-values are shown; statistical details for sex or UVB factors in the ANOVAs (F-values, degrees of freedom, p-value) with interaction appears in Supplementary Table 10, or two-way ANOVA analysis with multiple correction test appears in Supplementary Table 11. Source data
Extended Data Fig. 1
Extended Data Fig. 1. Solar exposure enhances the energy intake and metabolic profile of men compared to women, Related to Fig. 1.
a, Total protein, fat, carbohydrate, sodium, fiber, omega-3, iron, zinc, and SCFAs intake (in g/day) by men and women in winter (October-February) and summer (March-September). Each participant is represented by a dot (summer: n = 556 men, n = 1,045 women; winter: n = 774 men, n = 616 women). Data are presented as mean ± SD. For the statistical analysis, unpaired two-tailed t-test assuming unequal variance with Welch’s correction p-value for carbohydrates (men p <0.0001; women p = 0.7069), protein (men p <0.0001; women p = 0.9076), fat (men p <0.0001; women p = 0.6185, sodium (men p <0.0001; women p = 0.0703), fiber (men p = 0.076; women p = 0.03), omega-3 (men p = 0.0003; women p = 0.565), iron (men p <0.0001; women p = 0.7485), zinc (men p <0.0001; women p = 0.3606), and SCFAs (men p <0.0001; women p = 0.022) was performed are shown, demonstrating that only men are affected by the seasonal change. b, Proteomics analysis, shown as Proteomap, illustrating the detailed hierarchy of functional categories (signal transduction, immune system, vesicular transport, digestive system, circulatory system, biosynthesis, folding, sorting and degradation) of men (upper panel) and women (lower panel) blood plasma proteins before (left panel) and after (right panel) exposure to 2,000 mJ/cm2 solar UVB. Data presented in each polygon represents proteins in a single KEGG pathway with >2-fold change (n = 5 biologically independent human subjects per condition). Source data
Extended Data Fig. 2
Extended Data Fig. 2. Solar exposure enhances the energy intake and metabolic profile of men compared to women, Related to Fig. 1.
a,b, Horizontal bar graphs represent significantly (p <0.05) enriched GO biological processes identified using the Gene Ontology tool for differentially expressed blood plasma proteins of (a) men and (b) women following a single solar exposure (UVB 2,000 mJ/cm2) (n = 5 biologically independent human subjects per condition). c,d, Horizontal bar graphs represent significantly (p <0.05) enriched GO biological processes identified using the Gene Ontology tool for differential expressed blood plasma proteins of (c) male and (d) female mice after 10 weeks of daily UVB exposure (50 mJ/cm2) (n = 3 biologically independent mice per condition). Source data
Extended Data Fig. 3
Extended Data Fig. 3. Daily UVB radiation enhances food-seeking behavior in males, Related to Fig. 2.
a, Upper panel: Photographs of representative mice exposed to daily UVB (50 mJ/cm2) or mock-UVB (control). Lower panel: Mean melanin intensity (n = 7 biologically independent mice per condition). b, PhenoTyper analysis of mice treated daily with UVB (50 mJ/cm2) or mock-UVB (control) for 4 weeks. Data represent the total activity within the arena (left panel) and the cumulative nesting duration of time spent (23 h) (n = 15 male and n = 16 biologically independent female mice per condition). c, Fecal fat analysis of mice 10 weeks after the first daily UVB (50 mJ/cm2) or mock-UVB (control) treatments (n = 12 male and n = 8 biologically independent female mice per condition). Dot plot presents the mean of fecal lipids (in mg per gram of feces). d, Representative image from the open-field test (four arenas) trial session video. e, Experimental design. f, Left panel: Elevated-plus maze for male UVB-treated and control mice (n = 12 biologically independent mice per condition). Right panel: Representative heat maps for each condition. g, Hot plate test response of male (left panel) and female (right panel) C57BL/6 J mice 30 min after being injected with opioid antagonist naltrexone (5 mg/kg of the bodyweight) or saline (Biologically independent males: n = 11 in saline and n = 12 mice per condition; Biologically independent females: n = 14 mice per condition). hj. Habituated mice were irradiated daily with either UVB or mock-UVB (control) and were injected with opioid antagonist (naltrexone (5 mg/kg of the body weight)) or saline 30 min before the open-field test. (h) Experimental design. (i,j) Left: The velocity, activity and frequency of and the total time spent in the center zone by (i) male and (j) female (n = 15 biologically independent males and n = 16 biologically independent female mice per condition). In all relevant panels: Data are presented as mean ± SEM; Two-tailed unpaired t-test p-values are shown, or statistical details for sex or UVB or treatment factors in the ANOVAs (F-values, degrees of freedom, p-value) with interaction appears in Supplementary Table 10, or two-way ANOVA analysis with multiple correction test appears in Supplementary Table 11. Source data
Extended Data Fig. 4
Extended Data Fig. 4. UVB radiation induces ghrelin production and secretion in skin adipocytes, Related to Fig. 3.
a, Plasma protein levels of insulin upon UVB (50 mJ/cm2) or mock-UVB (control) -irradiated mice at 10 weeks after the first treatment (Biologically independent males: n = 10 control and n = 12 UV biologically independent mice per condition; Biologically independent females: n = 10 control and n = 9 UV mice per condition). b, Stomach tissue from control, UVB-irradiated (50 mJ/cm2), and 22-h-food-deprived mice after 5 weeks of treatment. Immunofluorescence for ghrelin (red), perilipin 1 (Plin1, an adipocyte marker, green), and nuclei (DAPI, blue). Ghrelin intensity normalized to DAPI (n = 4 biologically independent mice per condition). c, Relative and arbitrary mRNA levels of pcsk1, GOAT, and ghrelin from indicated tissue from UVB (50 mJ/cm2) or mock-UVB (control) irradiated male mice at 10 weeks after first treatment and from LiSa-2 differentiated adipocytes 24 h after UVB (50 mJ/cm2) radiation. Data normalized to 36b4 (n = 4 biological replicates). d, Relative p53 and p21 mRNA levels from differentiated 3T3-L1 adipocytes 24 h after UVB (50 mJ/cm2) or control radiation. Data normalized to 36b4. e, Representative 3D construction of immunofluorescence image of human skin adipose tissue of UVB (2,000 mJ/cm2) 24 h post-treatment stained for ghrelin (red), perilipin 1 (Plin1, an adipocyte marker, green), and nuclei (DAPI, blue). f, Skin tissue from (b). Upper panel: Representative images of immunofluorescence. Bottom panel: Ghrelin intensity normalized to DAPI (n = 3 biologically independent mice per condition). g, Left panel: Immunofluorescence of differentiated 3T3-L1 adipocytes after 24 h of UVB (50 mJ/cm2) or control treatments stained for ghrelin (red) and nuclei (with DAPI, blue). Right panel: Ghrelin intensity normalized to DAPI intensity (n = 9 random fields from 3 biological replicates). h, Arbitrary of Agrp and Npy mRNA levels from brain hypothalamus upon 10 weeks of mock-UVB (control) treatment (n = 3 biologically independent mice per condition). Data normalized to 36b4. In all relevant panels: Data are presented as mean ± SEM; Two-tailed unpaired t-test p-values are shown, or statistical details for sex or UVB or treatment factors in the ANOVAs (F-values, degrees of freedom, p-value) with interaction appears in Supplementary Table 10, or two-way ANOVA analysis with multiple correction test appears in Supplementary Table 11. Source data
Extended Data Fig. 5
Extended Data Fig. 5. p53 regulates UVB induced ghrelin expression, Related to Fig. 4.
a, Venn diagram of transcription factors identified using Ingenuity Pathway analysis from male and female mouse plasma proteomics (UVB/control) and putative transcription factors that bind sites identified in the human ghrelin promoter using PROMO. b, Experimental design. c, Flox and Cre expression analysis of genomic DNA from the WAT. d, p53 protein levels from skin and stomach tissues of mock-UVB (control) irradiated wild-type C57BL/6 J (WT) and p53-cKO male mice 10 weeks after the first treatment. β-actin was used as the loading control. Quantification of protein amount normalized to β-actin (Q) is indicated. e, Baseline levels of p53 mRNA in wild-type and p53-cKO mice in skin and adipose tissue (n = 3 biologically independent male and n = 4 biologically independent female mice per condition). Data normalized to 36b4. f, Representative 3D reconstructed image of immunofluorescence image of men (left panel) and women (right panel) skin adipose tissue 24 h after UVB (2,000 mJ/cm2); the tissue was stained post-treatment for p53 (red), perilipin 1 (Plin1, an adipocyte marker, green), and nuclei (DAPI, blue). g,h, Immunofluorescence analysis of skin tissue from (g) male and (h) female p53-cKO (p53flx/flxFabp4Cre+) mice after 10 weeks of daily UVB (50 mJ/cm2) or control irradiation. The skin layers (epidermis, dermis, and hypodermis) were stained for cyclobutane pyrimidine dimers (red), perilipin 1 (Plin1, an adipocyte marker, green), and nuclei (with DAPI, blue). i, Baseline levels of ghrelin mRNA in control and p53-cKO mice (n = 3 biologically independent male and n = 4 biologically independent female mice per condition). Ghrelin levels were normalized to 36b4. j, Western blot analysis of ghrelin protein levels from skin and stomach tissues of mock-UVB (control) irradiated wild-type C57BL/6 J (WT) and p53-cKO male mice 10 weeks after the first treatment. β-actin was used as the loading control. Quantification of the protein amount normalized to β-actin (Q) is indicated. In all relevant panels: Data are presented as mean ± SEM; Two-tailed unpaired t-test p-values are shown, or statistical details for sex or UVB or p53-cKO factors in the ANOVAs (F-values, degrees of freedom, p-value) with interaction appears in Supplementary Table 10, or two-way ANOVA analysis with multiple correction test appears in Supplementary Table 11. Source data
Extended Data Fig. 6
Extended Data Fig. 6. Deletion of p53 in skin adipocytes abrogates UVB-induced appetite enhancement, Related to Fig. 5.
a, Experimental design. b, Melanin pigment accumulation in the mice ears upon indicated treatment (a). c, Weekly mean ears melanin levels of indicated mice upon indicated treatment. (Biologically independent Males: n = 8 mice per condition; Biologically independent females: n = 7 p53flx/flxFabp4Cre- control/UV, p53flx/flxFabp4Cre+ control and n = 8 p53flx/flxFabp4Cre+ UV). d,e, Staircase test for control and p53-cKO (d) male (n = 10 biologically independent mice per condition) and (e) female mice after 5 weeks of daily UVB (50 mJ/cm2) or mock-UVB (control) irradiation. Shown are the measured number of sucrose pellets eaten and of attempts to reach a pellet. (n = 12 biologically independent mice per condition). f, Experimental design. g,h, Upper & middle panels: Number of visits to open and closed arms during 5 min; duration of time spent in the open or closed arms, total distance travelled; velocity; and activity of control and p53-cKO (g) male (n = 12 biologically independent mice per condition) and (h) female mice after 4 weeks of daily UVB (50 mJ/cm2) or mock-UVB (control) irradiation. Lower panel: A representative image of the heat map of the maze for each condition. (n = 11 biologically independent mice per condition). i, Plasma insulin levels in p53-cKO mice after 5 weeks of UVB (50 mJ/cm2) or mock-UVB (control) irradiated control treatment. (n = 9 biologically independent mice per condition). j, Relative mRNA levels of Adiponectin, p21, Ccl2, Tnf, and leptin in the skin adipose tissue of control and p53-cKO male mice after 5 weeks of daily UVB (50 mJ/cm2) or mock-UVB (control) exposure (n = 4 biologically independent mice per condition). Data normalized to 36b4. In all relevant panels: Data are presented as mean ± SEM; Two-tailed unpaired t-test p-values are shown, or statistical details for sex or UVB or p53-cKO factors in the ANOVAs (F-values, degrees of freedom, p-value) with interaction appears in Supplementary Table 10, or two-way ANOVA analysis with multiple correction test appears in Supplementary Table 11. Source data
Extended Data Fig. 7
Extended Data Fig. 7. Estrogen blocks p53 transcriptional activation of ghrelin upon UVB, Related to Fig. 6.
a, ER-α protein levels in human adipose tissue. β-actin used as the loading control. Quantification of the protein amount normalized to β-actin (Q) is indicated. b, Left panel: Experimental design. Right panel: Immunofluorescence of cells stained for ghrelin (red), perilipin 1 (Plin1, an adipocyte marker, green) and nuclei (with DAPI, blue) (n = 10 random fields from 3 biological replicates). Relative ghrelin intensity normalized to DAPI. c, p53, p21 and ghrelin relative mRNA levels in 3T3-L1 differentiated adipocytes treated with a vehicle, 100 nM DHT or 100 nM β-E2 and with UVB (50 mJ/cm2) or control irradiation after 24 h (n = 3 biological replicates). Data normalized to 18S. d, Upper panel: Luciferase activity upstream of the human ghrelin promoter (−3,000 bp upstream) in the presence of ER-α or p53, or an empty vector (control) in HeLa cells with or without 100 nM β-E2 treatment for 24 h. Lower panel: Luciferase activity similar as in upper panel in H1299 cells upon ER-α or an empty vector (control) expression. Firefly luciferase activity normalized to Renilla luciferase activity (n = 3 biological replicates). eg, ChIP levels (fold) normalized to input of p53 and IgG occupancy over ghrelin promotor (e); p53 (f) and NCOR1 (g) occupancy over p21 promotor in LiSa-2 adipocytes treated with 100 nM β-E2 or vehicle and irradiated with UVB (50 mJ/cm2) or mock-UVB (control) and harvested after 24 h (n = 3 biological replicates). h, NCOR1 protein level in LiSa-2 adipocytes treated as in (e). β-actin was used as the loading control. Quantification of the protein amount normalized to β-actin (Q) is indicated. i, 17-β estradiol plasma protein levels in OVX or sham female mice after 5 weeks of either daily UVB (50 mJ/cm2) or mock-UVB (control) exposures (n = 7 biologically independent mice per condition). j, Weekly mean body weight (grams) of the OVX/sham female mice after daily UVB (50 mJ/cm2) or mock-UVB (control) irradiation before and 3 weeks after OVX/sham surgery (n = 29 sham before/after and n = 25 OVX before/after biologically independent female mice). k, Elevated-plus maze (EPM) responses in female OVX/sham mice after 4 weeks of either daily UVB (50 mJ/cm2) or mock-UVB (control) exposures. Right panel: Representative heat maps from each condition (n = 10 biologically independent mice per condition). l, ghrelin plasma protein levels of in OVX or sham female mice after 5 weeks of daily UVB (50 mJ/cm2) or mock-UVB (control) exposures (n = 10 biologically independent mice per condition). m, p53 relative mRNA levels from the skin of OVX or sham female mice treated as in (l) (n = 5 biologically independent mice per condition). Data normalized to 36b4. n, ER-α relative mRNA levels from the skin of OVX or sham female mice treated as in (l) (n = 5 mice per condition). Data normalized to 36b4. o, Aromatase relative mRNA levels in human female skin adipose tissue 26 h after treatment with estrogen inhibitor (leterozole (5 µM)) or vehicle (DMSO). Data normalized to 36b4. For all relevant panels: Data are presented as mean ± SEM; an unpaired t-test p-values are shown, or statistical details for OVX or UVB factors in the ANOVAs (F-values, degrees of freedom, p-value) with interaction appears in Supplementary Table 10, or two-way ANOVA analysis with multiple correction test appears in Supplementary Table 11. Source data
Extended Data Fig. 8
Extended Data Fig. 8. Solar exposure induces ghrelin and hunger in humans, Related to Fig. 7.
a, Dot plot representing the solar UVB radiation dose (measured in mW/cm2), measured using the UVX radiometer at indicated times of the day in summer (August) and winter (December) months. Data are presented as mean ± SEM for each time point of the day (n = 4 separate days of measurement). b, Graphical summary presents the discovery of UVB as a novel food-seeking behavior trigger, in which men and women have a different eating physiology and in which several extrinsic as well as intrinsic factors can affect this behavior, including sex-specific steroids like estrogen and testosterone. The sex-based disparity in ghrelin levels following the UVB exposure are reflected in the food-seeking behavior and hunger, as we observed in several experimental models, that is, mouse experiments, human cohort study and human questionnaire.
Extended Data Fig. 9
Extended Data Fig. 9. Unprocessed scans of western blots & DNA agarose gel electrophoresis.
Unprocessed scans from the western blot experiments from Fig. 6c, and Extended Data Fig. 5d. Unprocessed scans of the genotyping experiments from Extended Data Fig. 5b–c).
Extended Data Fig. 10
Extended Data Fig. 10. Unprocessed scans of western blots.
Unprocessed scans from the western blot experiments from Extended Data Figs. 5j, 7a, and h.

Comment in

Similar articles

Cited by

References

    1. Regitz-Zagrosek V. Sex and gender differences in health. EMBO Rep. 2012;13:596–603. - PMC - PubMed
    1. Garland CF, Garland FC. Do sunlight and vitamin D reduce the likelihood of colon cancer? Int. J. Epidemiol. 1980;9:227–231. - PubMed
    1. Ferguson AL, et al. Exposure to solar ultraviolet radiation limits diet-induced weight gain, increases liver triglycerides and prevents the early signs of cardiovascular disease in mice. Nutr. Metab. Cardiovasc. Dis. 2019;29:633–638. - PubMed
    1. Weller RB. Sunlight has cardiovascular benefits independently of vitamin D. Blood Purif. 2016;41:130–134. - PubMed
    1. Rivera-Gonzalez G, Shook B, Horsley V. Adipocytes in skin health and disease. Cold Spring Harb. Perspect. Med. 2014;4:a015271. - PMC - PubMed

Publication types