. 2022 Sep;6(9):1045-1056.
doi: 10.1038/s41551-022-00904-3. Epub 2022 Jul 11.

A nanoparticle probe for the imaging of autophagic flux in live mice via magnetic resonance and near-infrared fluorescence

Affiliations

A nanoparticle probe for the imaging of autophagic flux in live mice via magnetic resonance and near-infrared fluorescence

Howard H Chen et al. Nat Biomed Eng. 2022 Sep.

Abstract

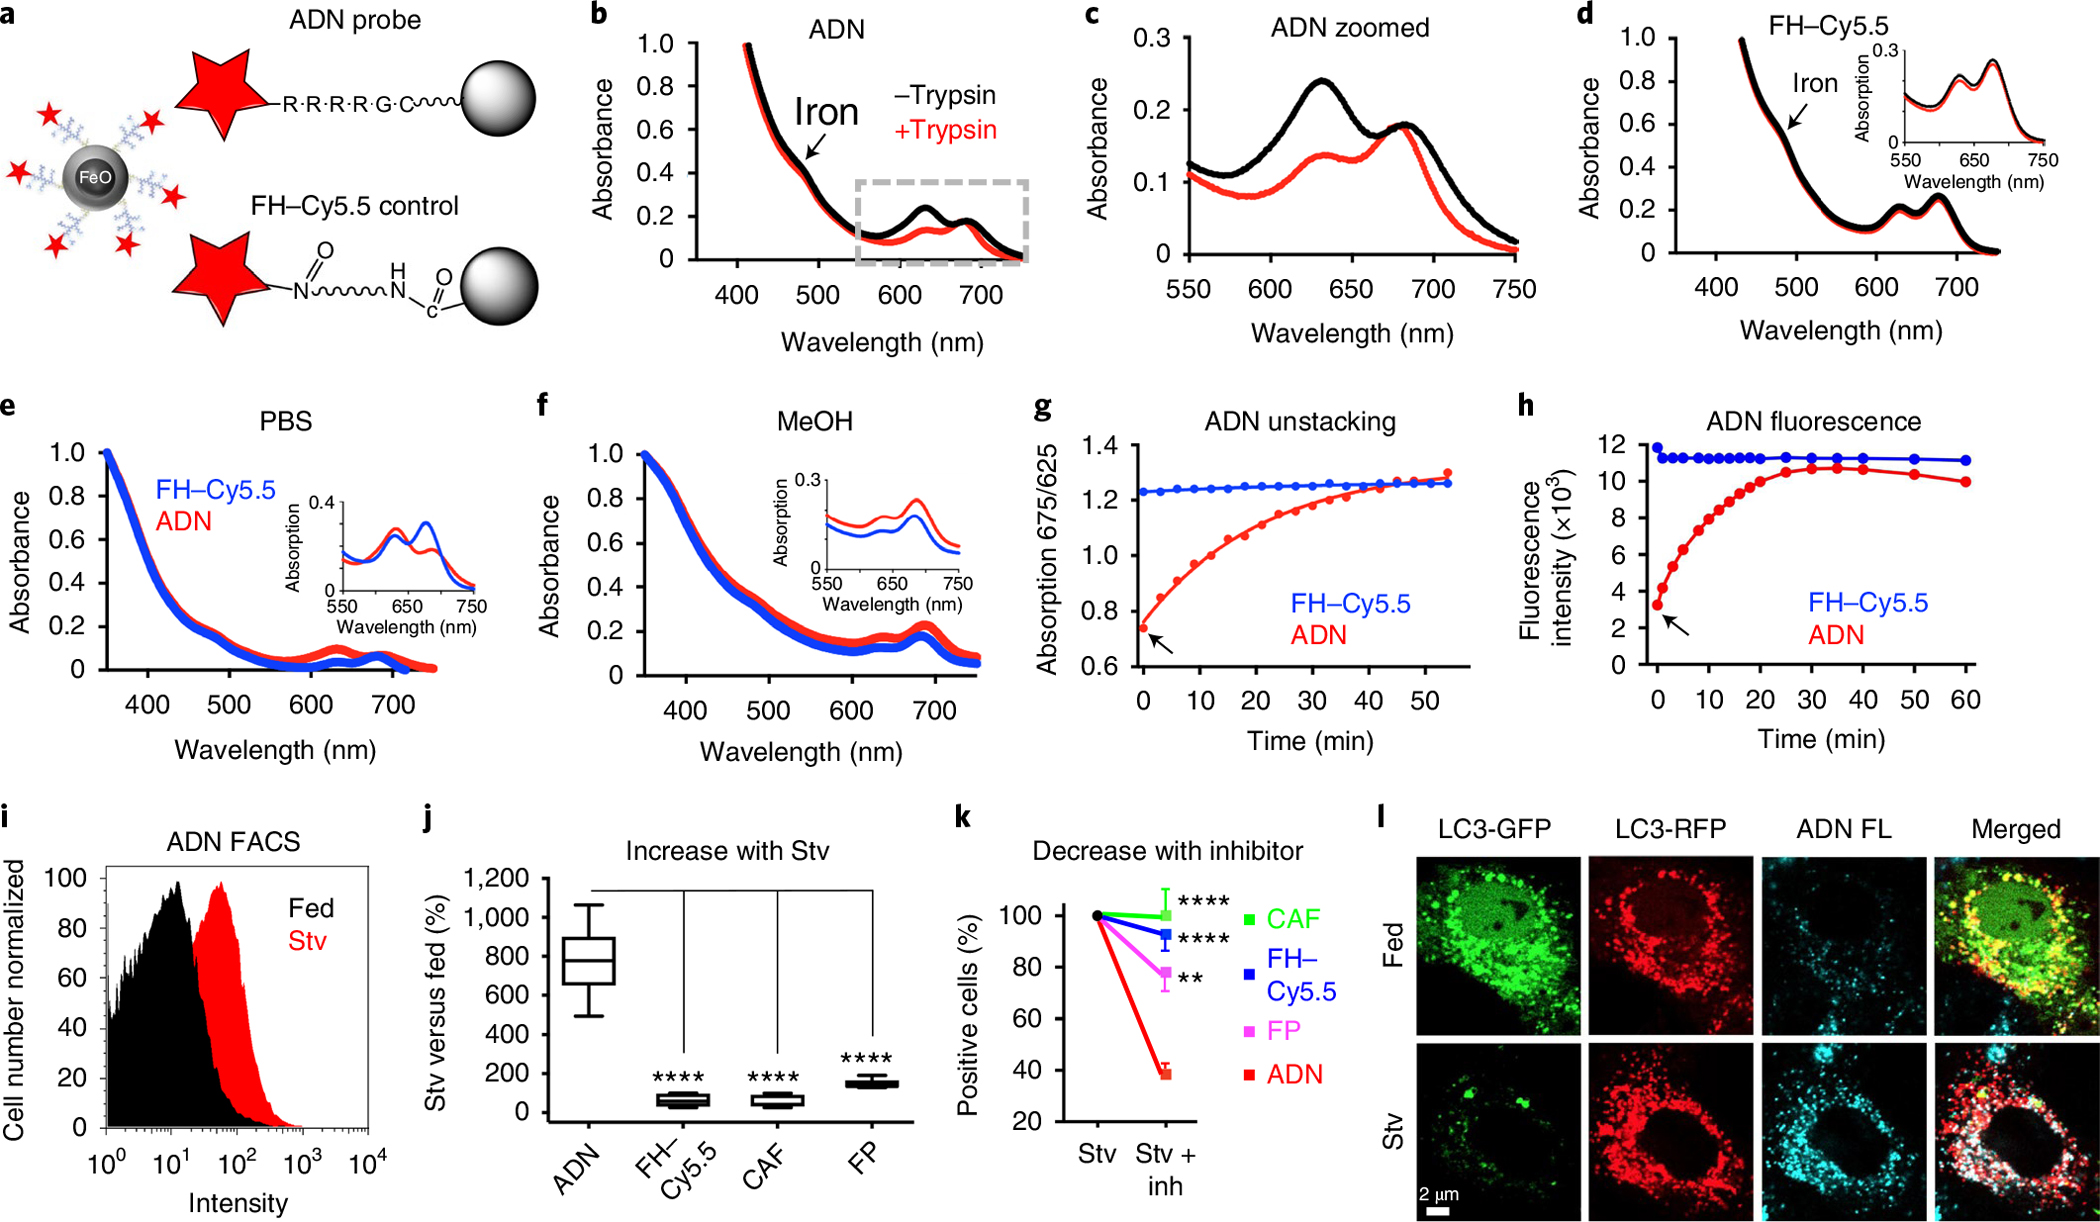
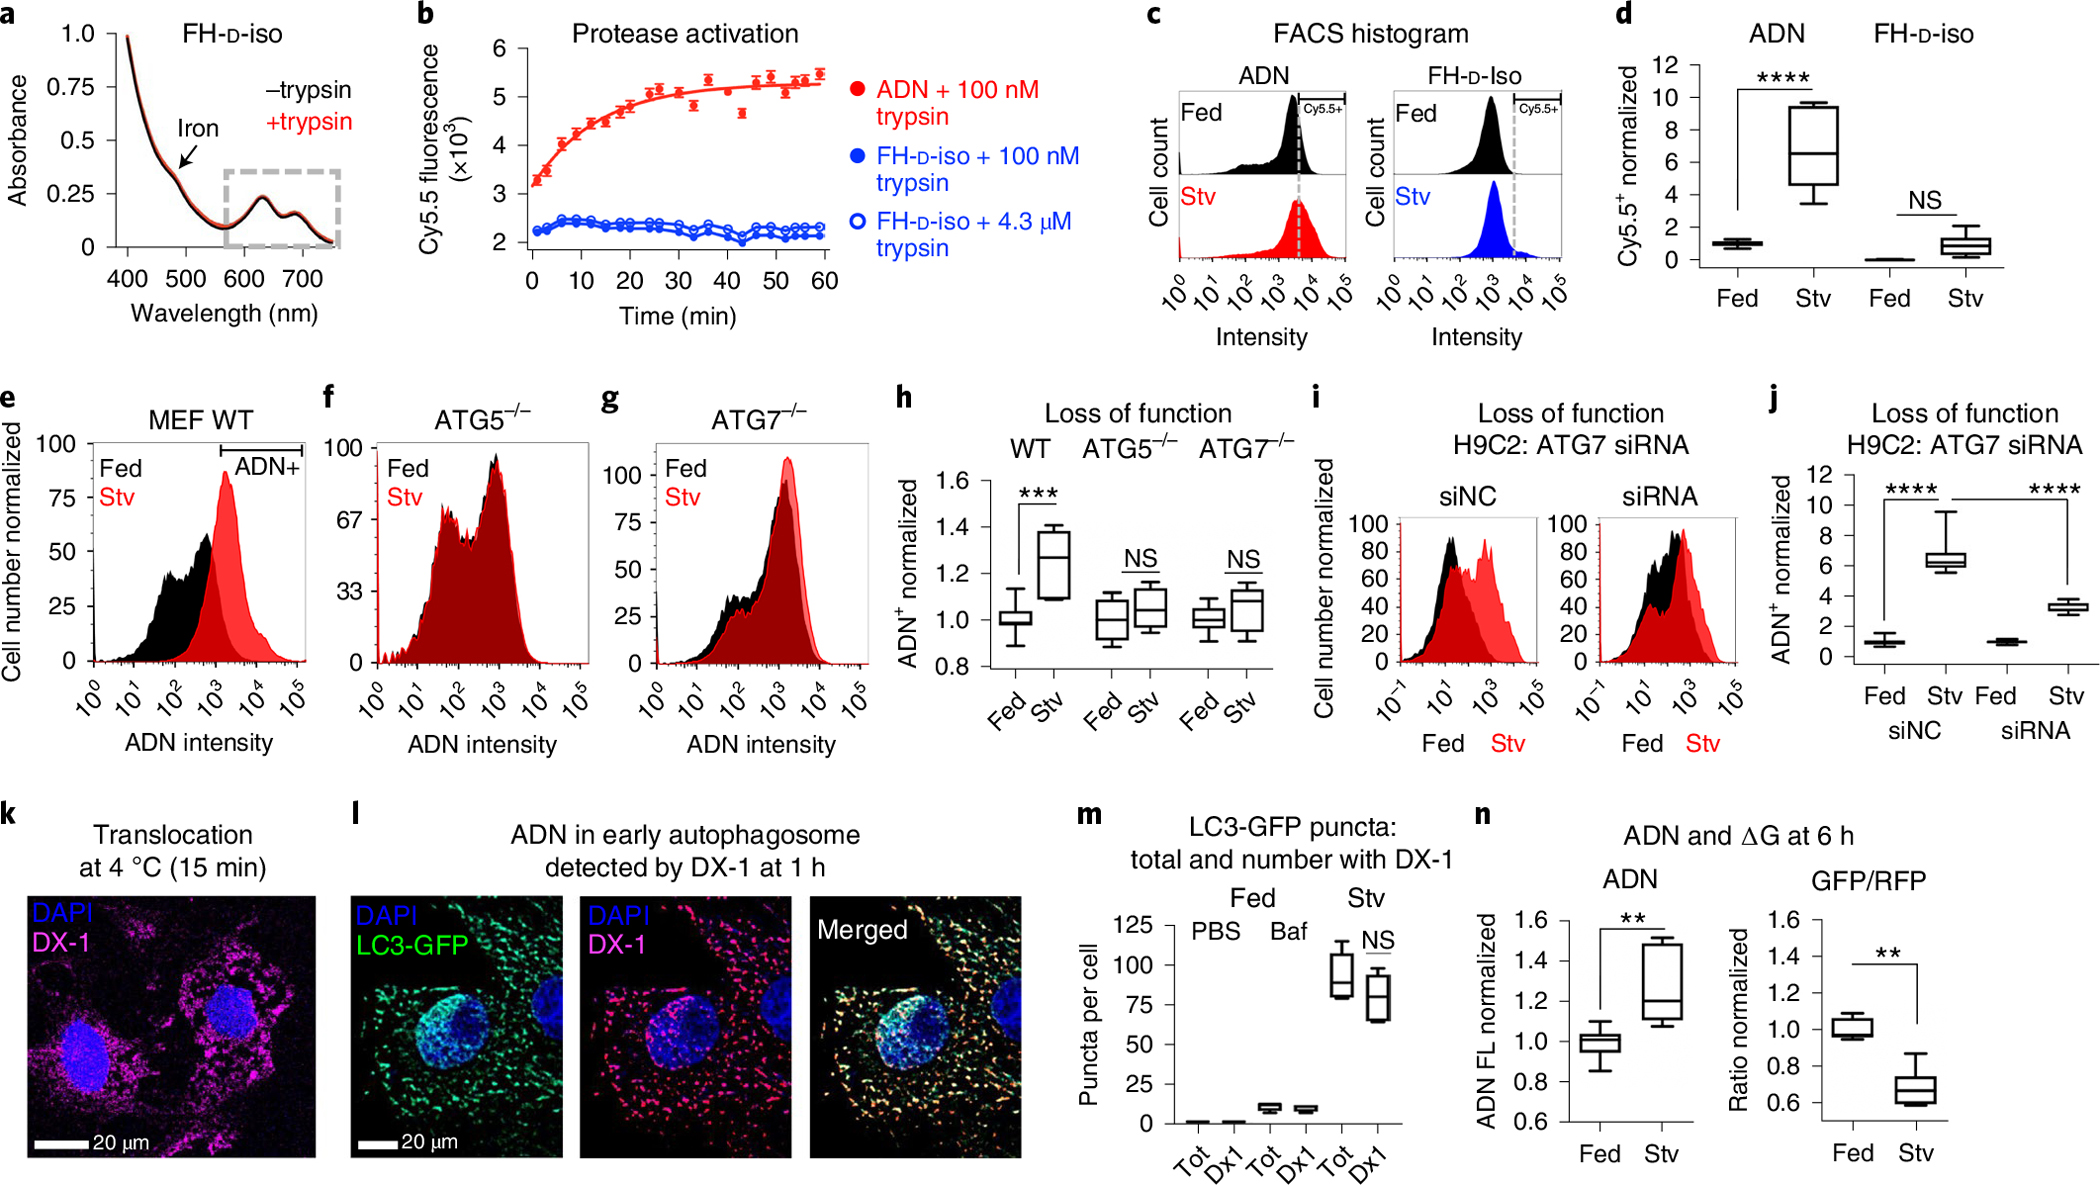
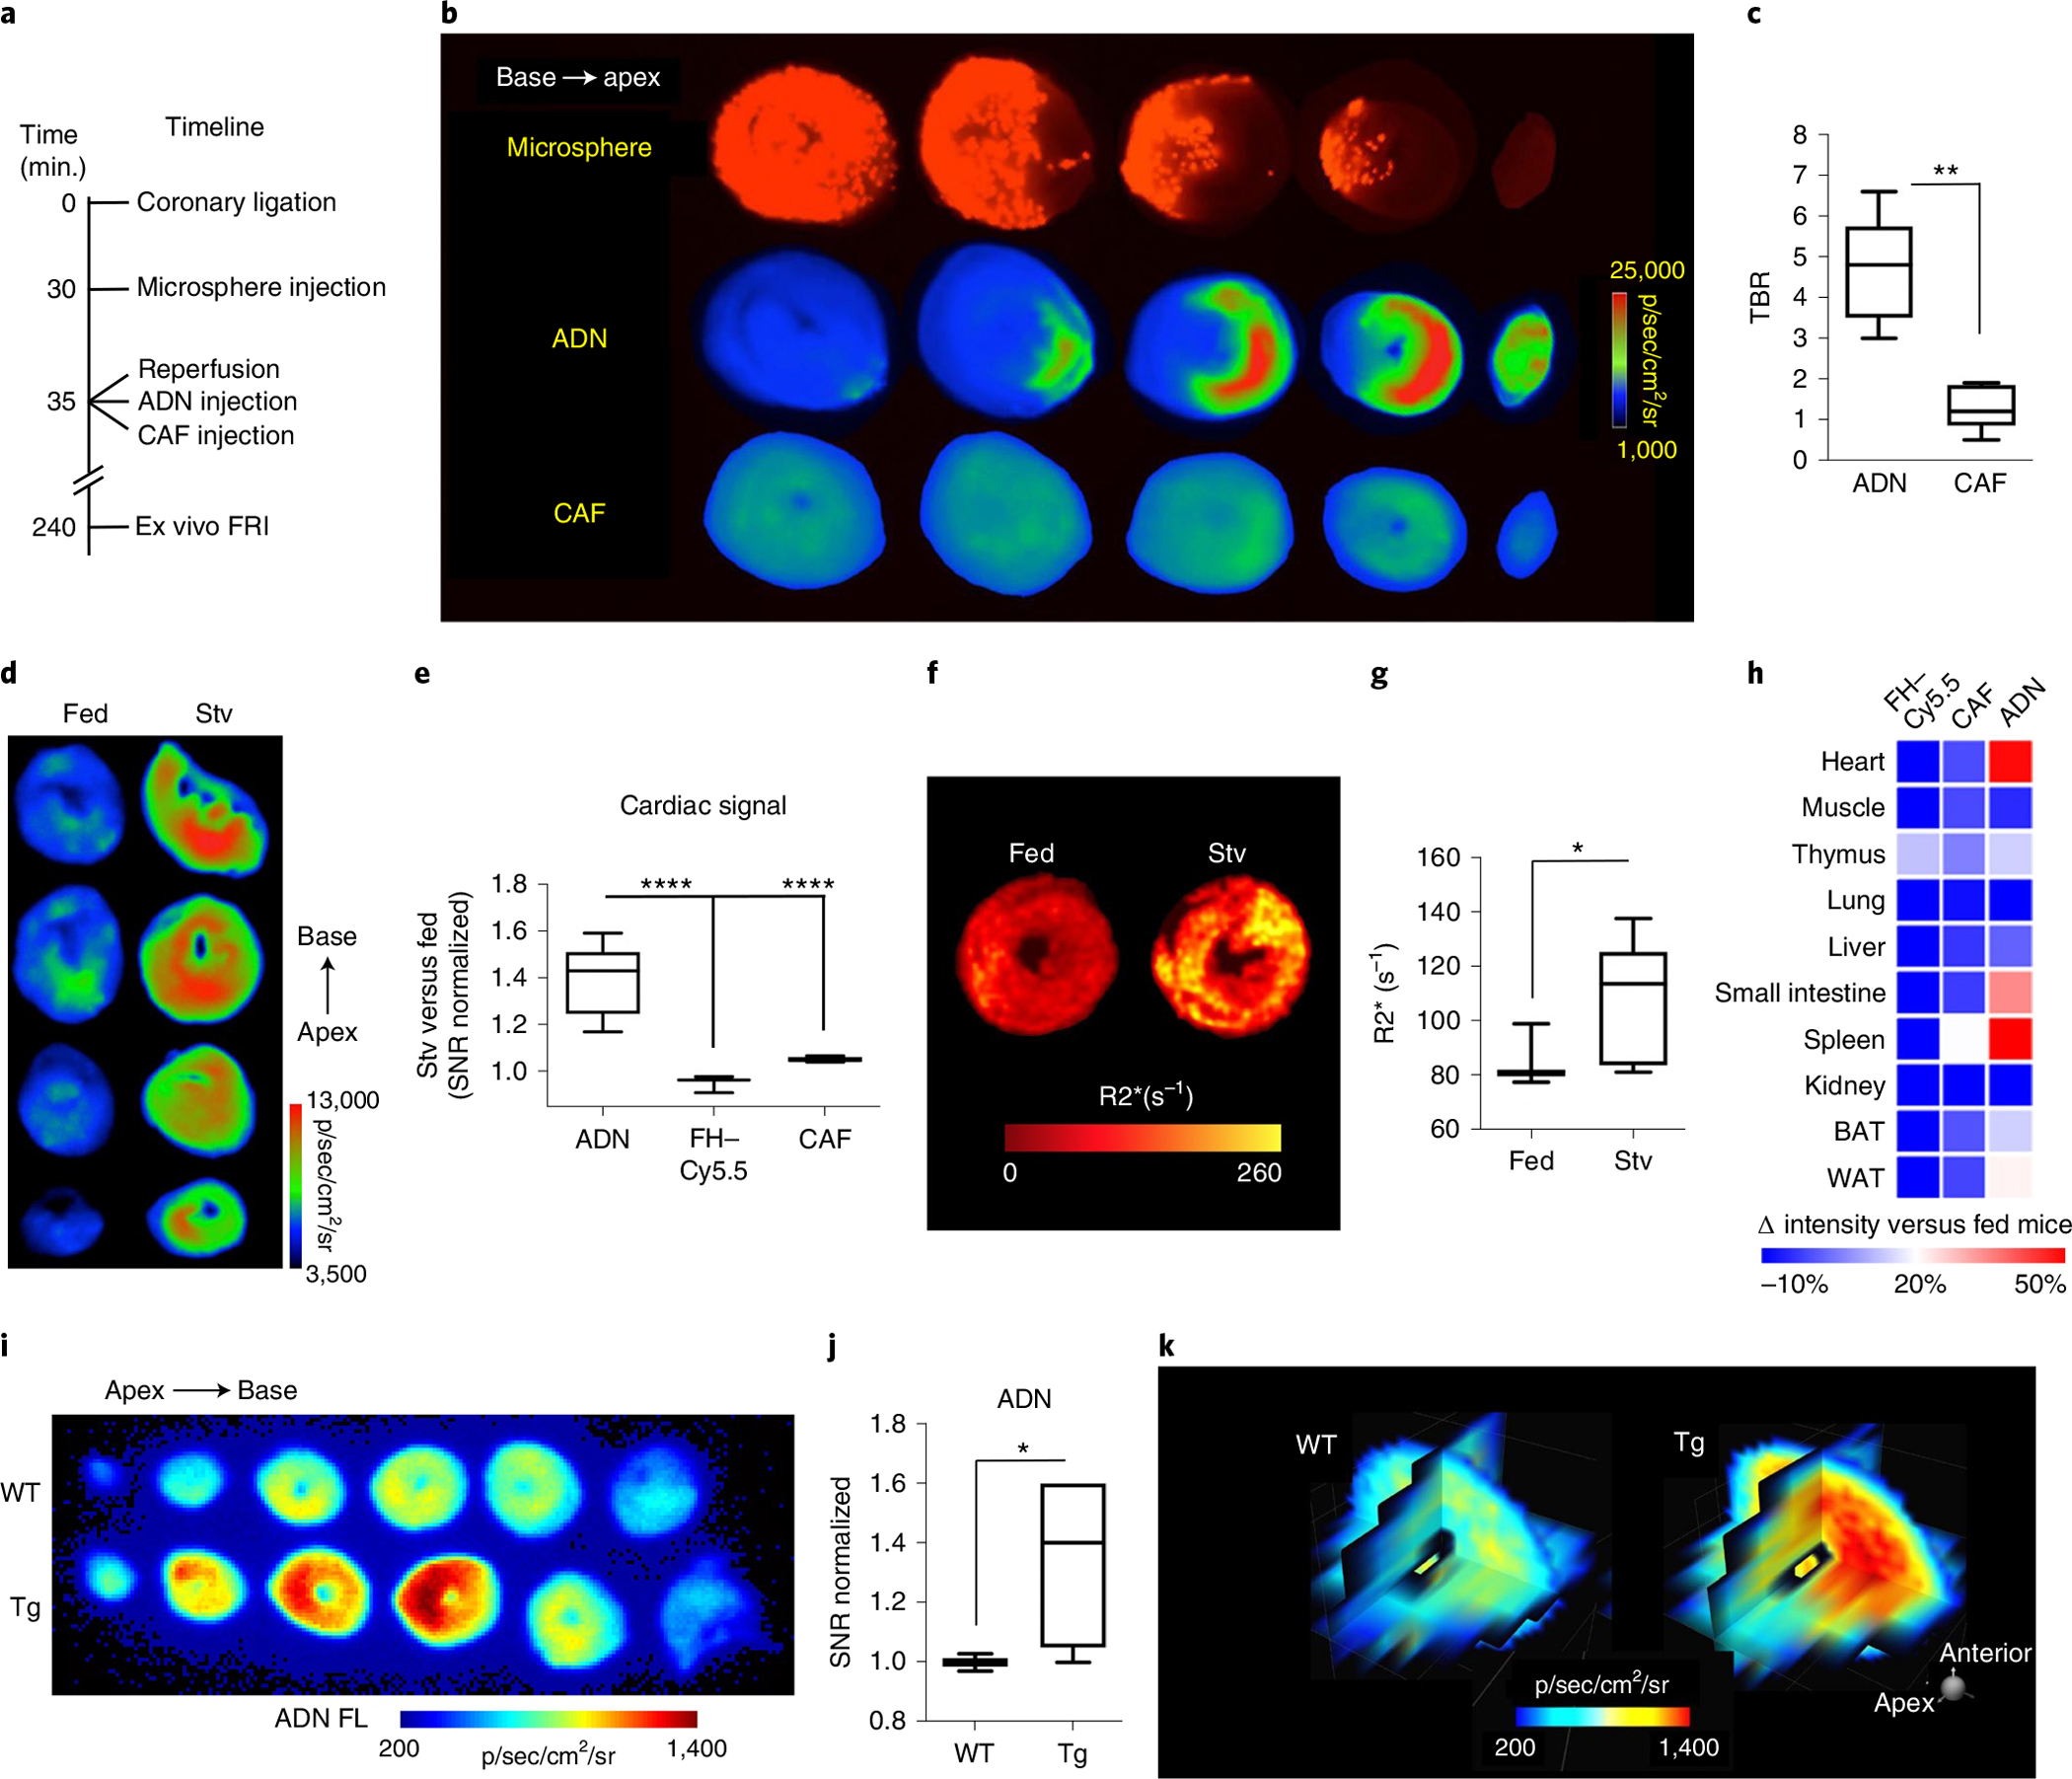
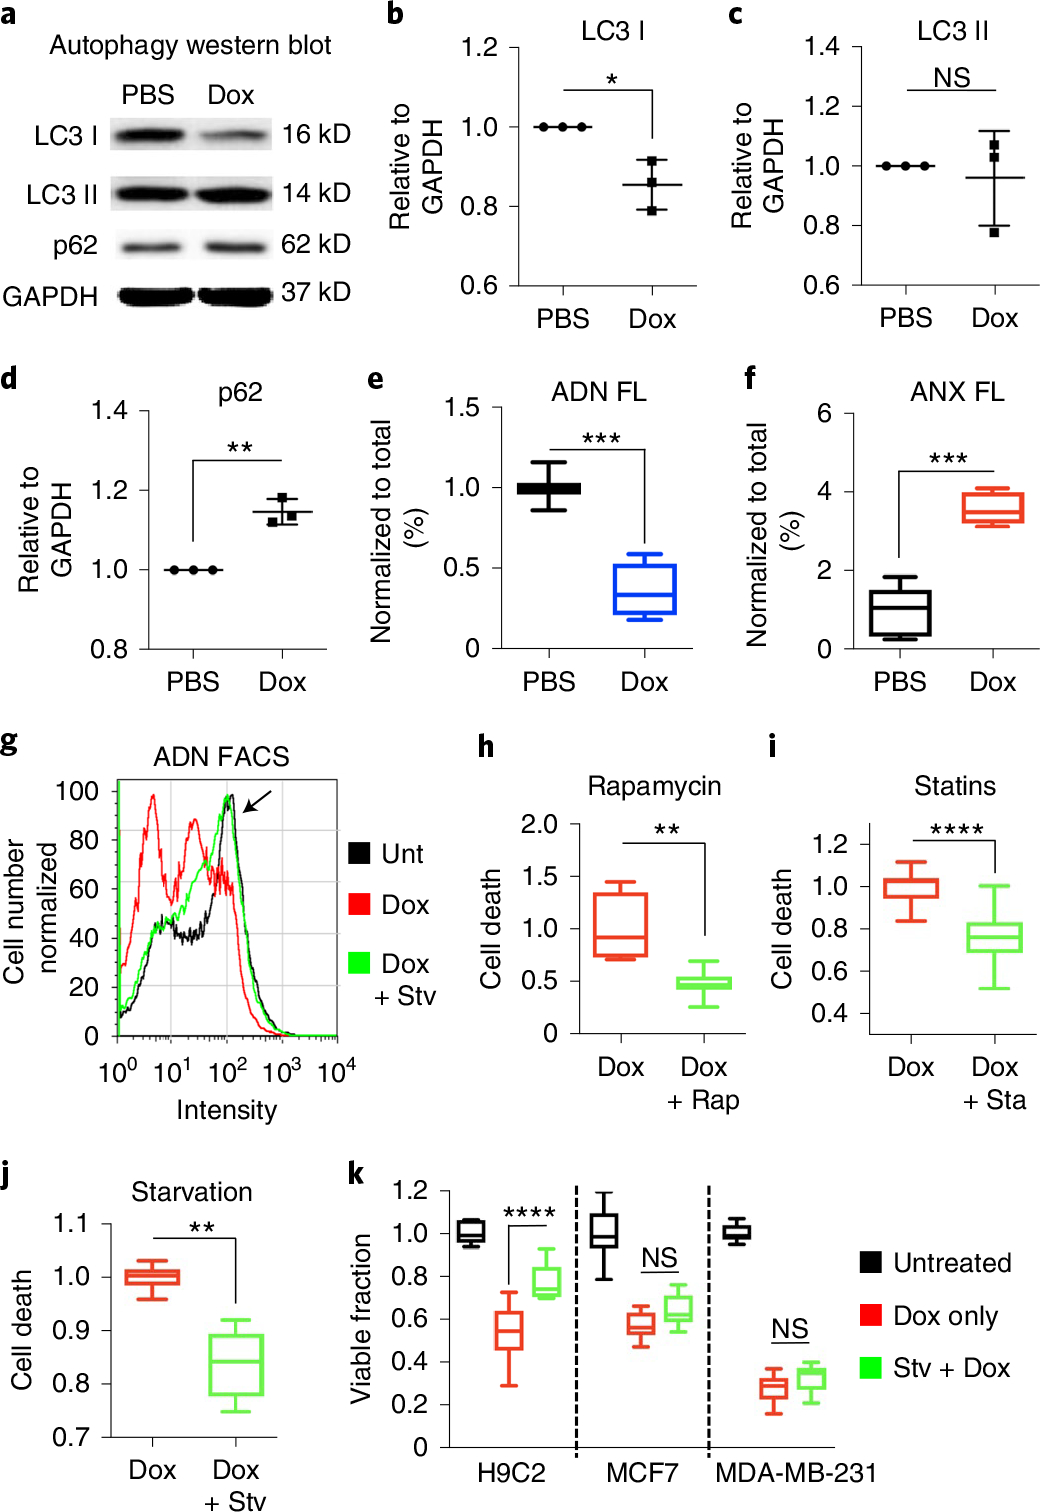
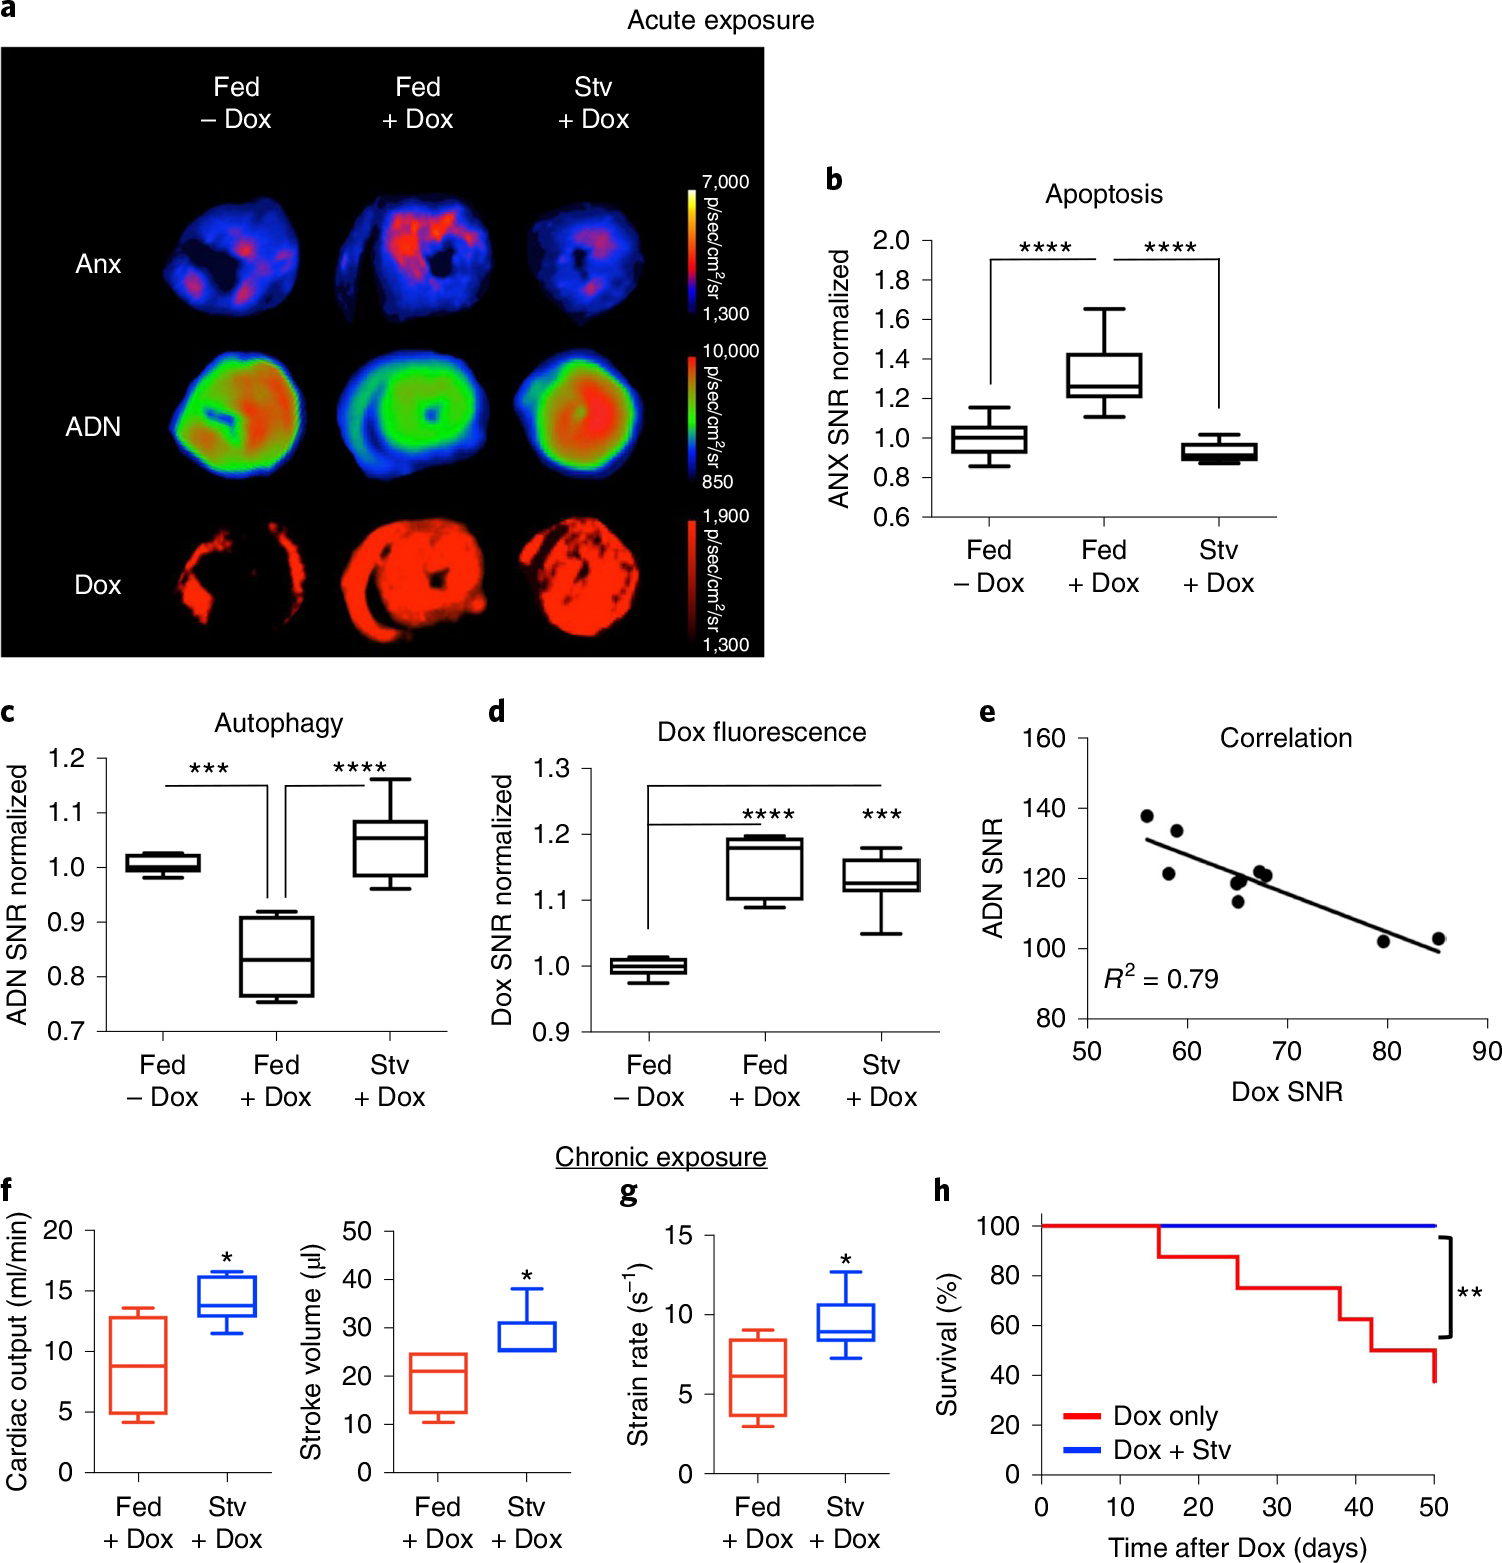
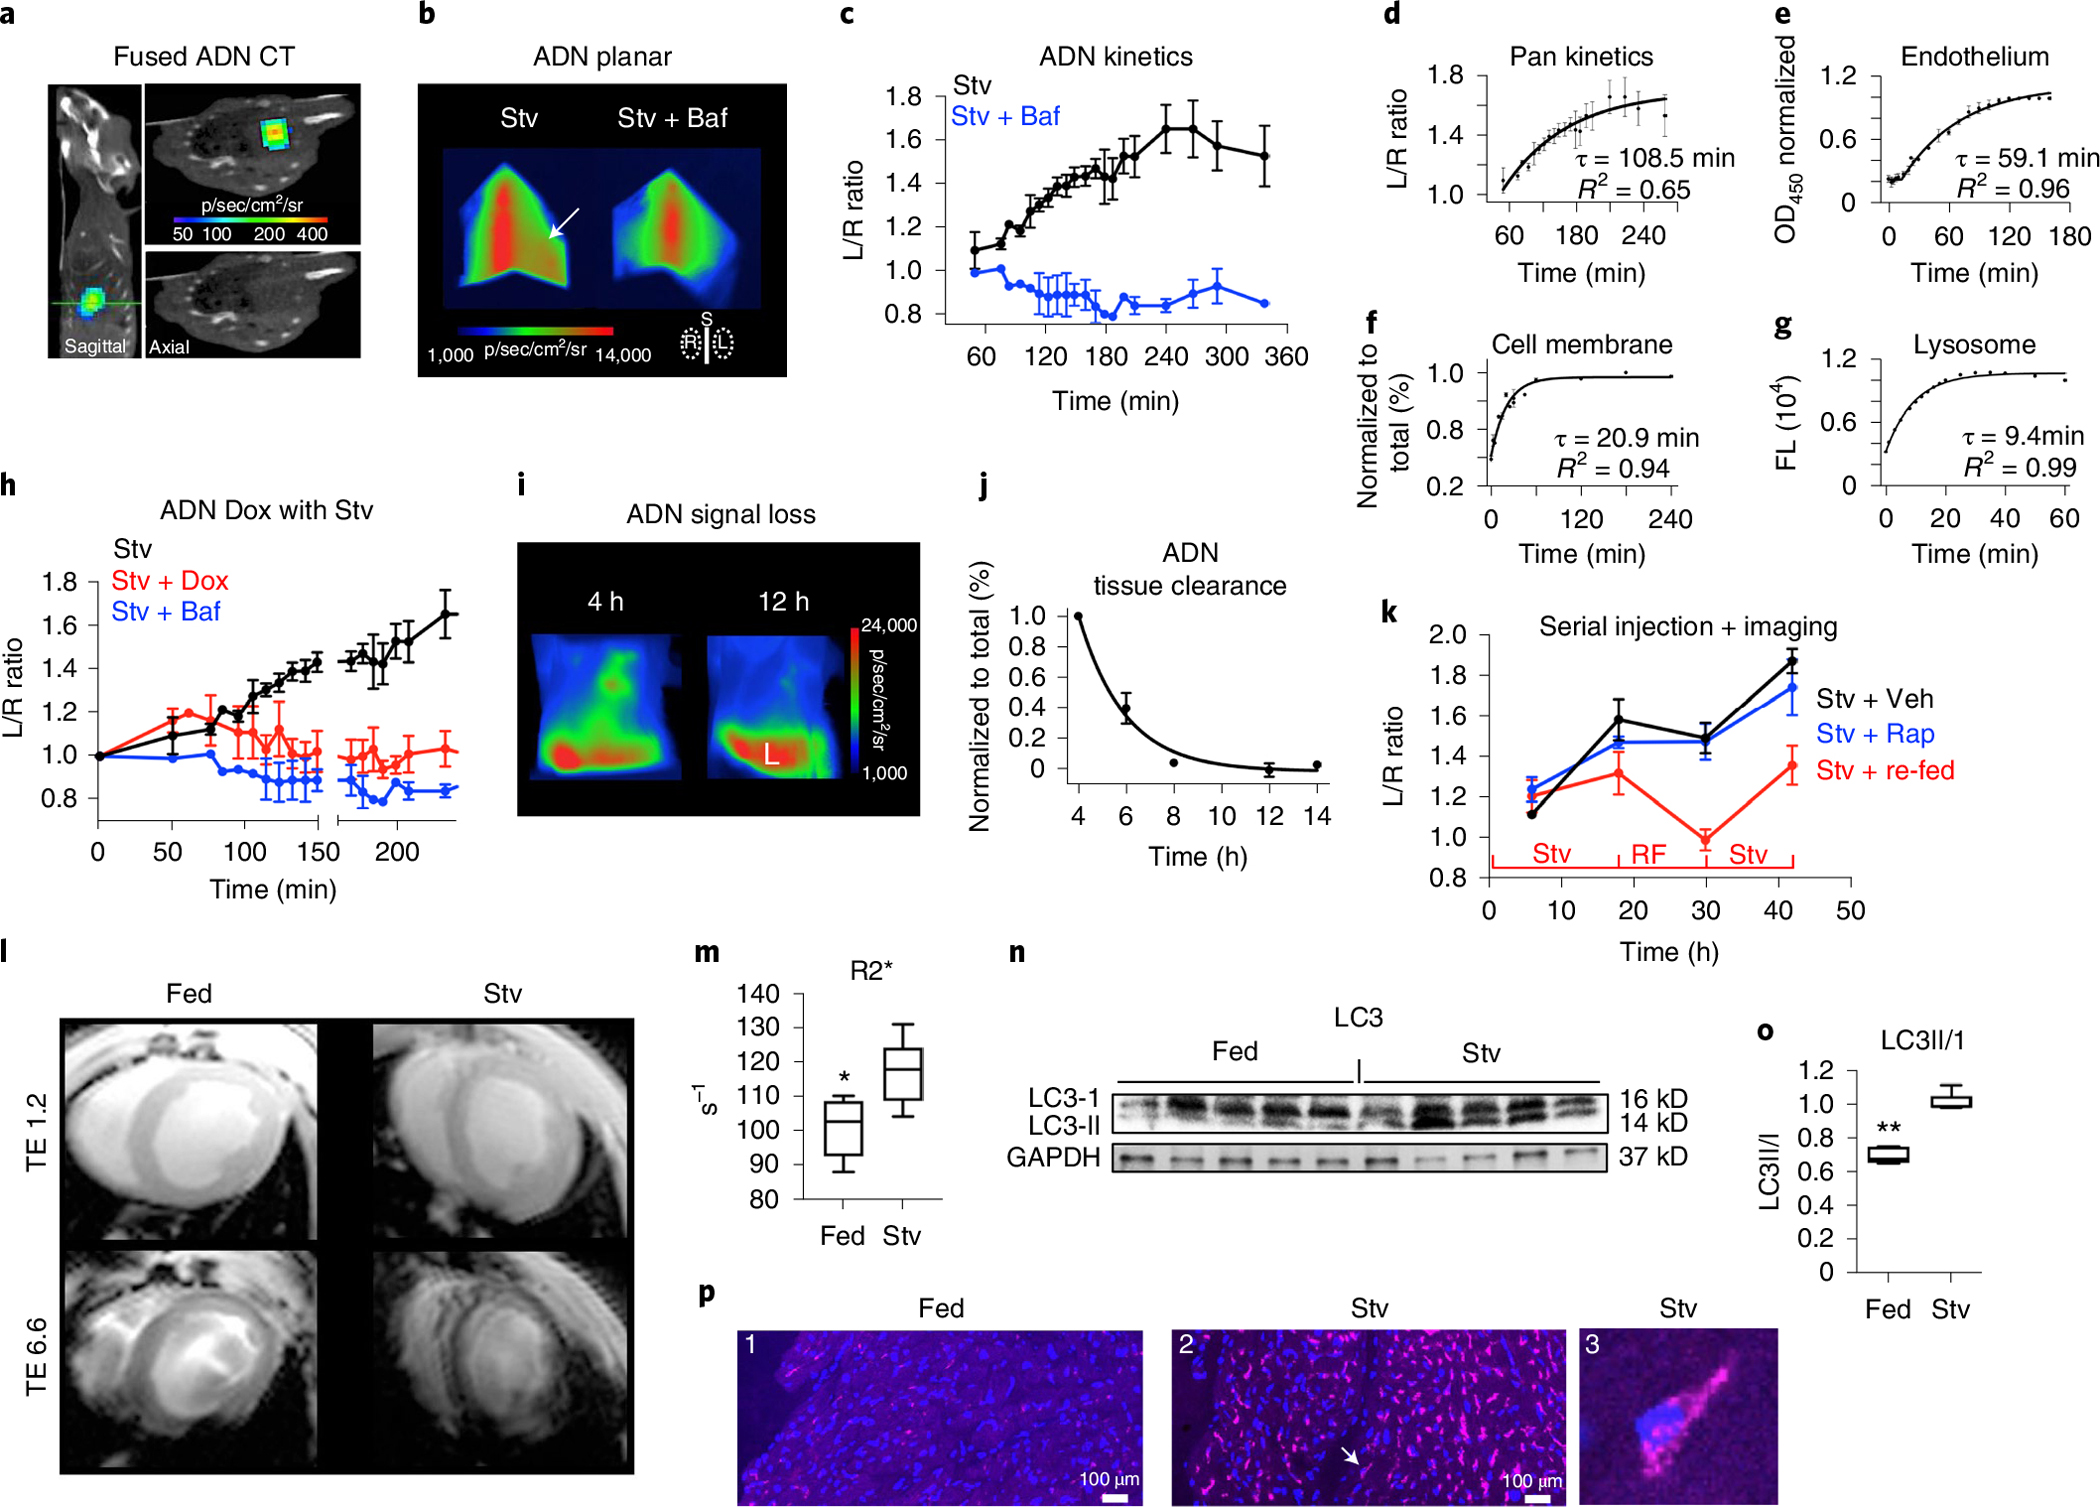
Autophagy-the lysosomal degradation of cytoplasmic components via their sequestration into double-membraned autophagosomes-has not been detected non-invasively. Here we show that the flux of autophagosomes can be measured via magnetic resonance imaging or serial near-infrared fluorescence imaging of intravenously injected iron oxide nanoparticles decorated with cathepsin-cleavable arginine-rich peptides functionalized with the near-infrared fluorochrome Cy5.5 (the peptides facilitate the uptake of the nanoparticles by early autophagosomes, and are then cleaved by cathepsins in lysosomes). In the heart tissue of live mice, the nanoparticles enabled quantitative measurements of changes in autophagic flux, upregulated genetically, by ischaemia-reperfusion injury or via starvation, or inhibited via the administration of a chemotherapeutic or the antibiotic bafilomycin. In mice receiving doxorubicin, pre-starvation improved cardiac function and overall survival, suggesting that bursts of increased autophagic flux may have cardioprotective effects during chemotherapy. Autophagy-detecting nanoparticle probes may facilitate the further understanding of the roles of autophagy in disease.


Conflict of interest statement

Competing interests

The authors declare no competing interests.

Figures

Fig. 1 |
Fig. 1 |. Characterization of the ADN and its in vitro validation.
a, Schematic of ADN: the iron oxide NP ferumoxytol (FH) is decorated with cathepsin-cleavable polyarginine peptides, each conjugated to the NIR fluorochrome Cy5.5. For the control NP, Cy5.5 is conjugated directly to FH without an intervening peptide. b,c, Absorbance spectra of ADN showing a shift in the Cy5.5 peak (625 versus 675 nm) in its unactivated (black) and trypsin-activated (red) states, full spectrum (b) and zoomed in spectrum (c). d, No spectral shifts are seen with FH–Cy5.5. e,f, The absorbance spectra of unactivated ADN and FH–Cy5.5 differ in aqueous solution (e) but not in methanol (MeOH) (f). g,h, Time course of ADN activation following trypsin exposure (arrows) measured by the unstacking (spectral shift) of Cy5.5 and its signal intensity, respectively. i, FACS histogram showing ADN activation in starved (Stv) H9C2 cells. j, The increase in fluorescence in starved versus fed cells is significantly greater with ADN (n = 10) than other constructs: FH–Cy5.5 (n = 8), CAF (n = 6) and free fluorescent polyarginine peptide (FP; n = 7). In the plot, the box extends from the 25th to the 75th percentile, the line in the box indicates the median and the whiskers represent the minimum and maximum. k, Likewise, when the autophagy inhibitors E64d and pepstatin A are added to starved cells, the reduction in fluorescence (versus no inhibitors) is significantly greater with ADN (n = 7) compared with other constructs: FH–Cy5.5 (n = 7), CAF (n = 9) and FP (n = 7). Mean ± s.e.m. is plotted for Stv + Inh. For j and k, one-way ANOVA with Tukey’s post-test was performed. **P = 0.0017 and ****P < 0.0001. l, Confocal microscopy of H9C2 cells transfected with a dual GFP–RFP fluorescent LC3 plasmid (pTF-LC3). When autophagy flux is induced through starvation (Stv, bottom row), the LC3-GFP signal is lost owing to the low pH of the lysosome, while the LC3-RFP signal persists. ADN fluorescence (FL, blue) co-localizes with the red fluorescence from those autophagosomes that have undergone flux to the lysosome. The microscopy experiments were repeated in three biologically independent samples with consistent results. Scale bar, 2 μm.
Fig. 2 |
Fig. 2 |. Specificity of ADN activation and its uptake in early autophagosomes.
a–d, Comparison of ADN and its D-isomer (FH-D-iso): no shift in the absorbance spectra of FH-D-Iso is seen after trypsin treatment (a); while trypsin activates ADN fluorescence, no increase in FH-D-Iso fluorescence is seen, even at high concentrations of trypsin (n = 3 for each condition; data are shown as mean ± s.e.m.) (b); in H9C2 cells, robust activation of ADN (n = 7), but not FH-D-Iso (n = 8), is seen with starvation (Stv, dashed line indicates Cy5.5 threshold; one-way ANOVA with Tukey post-test was performed, ****P < 0.0001; box plots show minimum, maximum, median and 25–75% percentiles) (c,d). NS, not significant. e–j, ADN is not activated in MEFs (e–h) or H9C2 cells (i,j) deficient in ATG5 or ATG7: ADN is strongly activated by wild-type (WT, n = 7) MEFs upon starvation (e) but not by ATG5−/−, n = 4 (f), or ATG7−/−, n = 8 MEFs (g). h, Quantification of ADN activation in WT MEFs versus ATG5−/− or ATG7−/− MEFs. Comparison with one-way ANOVA with Tukey post-test, ***P = 0.0004. Box plots show minimum, maximum, median and 25–75% percentiles. In ij, H9C2 cells were treated with non-coding siRNA (siNC, n = 11) and siRNA to ATG7 (n = 11). ADN activation with starvation is robust with exposure to siNC but highly attenuated by ATG7-targeted siRNA. Comparison with one-way ANOVA with Tukey post-test, ****P < 0.0001. Box plots show minimum, maximum, median and 25–75%. k–m, Uptake of ADN by early autophagosomes detected via the DX1 antibody to its surface dextran. ADN can enter the cytoplasm via endosomal escape or by direct translocation: within 15 min, the probe is diffusely distributed in the cytoplasm of starved H9C2 cells that were pre-cooled to 4 °C for 2 h to eliminate endocytosis (k); at 1 h, the ADN in starved H9C2s that express LC3-GFP, a marker of early autophagosome formation, is punctate and co-localizes strongly with LC3-GFP, where the number of LC3-GFP puncta with co-localized DX-1(ADN) signal increased from a median [and interquartile range] of 1 [1–2] in fed H9C2 cells to 11 [8–12] in fed H9C2 cells exposed to Baf, and 80 [65–94] in starved H9C2 cells, and a median of 92% [90–100%] of the LC3-GFP puncta in the baf-exposed cells, and 85% [81–90%] in the starved cells, stained positively for DX-1 (ADN) (comparison with one-way ANOVA with Tukey post-test; box plots show minimum, maximum, median and 25–75% percentiles) (l,m). Tot, Total. n = 5 biologically independent samples with consistent results. n, Activation of ADN (Cy5.5 fluorescence) after 6 h of starvation in H9C2 cells expressing the ATG4B-sensitive dual-fluorescent-LC3 ΔG construct. The activation of ADN (n = 7 fed versus n = 7 Stv, **P = 0.0012, two-tailed Mann–Whitney test) correlates well with the reduction in the GFP/RFP ratio of the ΔG reporter (n = 6 fed versus n = 7 Stv, **P = 0.0012, two-tailed Mann–Whitney test) consistent with autophagic flux. Box plots show minimum, maximum, median and 25–75% percentiles.
Fig. 3 |
Fig. 3 |. Imaging of cardiomyocyte autophagy ex vivo with ADN is both sensitive and specific.
a–c, IR: experimental scheme (a); short-axis slices of a mouse heart showing robust ADN activation during IR, where the area at risk is delineated by the absence of microspheres and correlates strongly with the region of ADN activation and, in contrast, very low fluorescence is seen with CAF in the same mouse heart. Fluorescence intensity is expressed as p/sec/cm2/sr (radiance unit of photons per second per square centimeter per steradian) (b); the sensitivity of ADN to IR-induced autophagy is significantly higher than CAF (c). N = 5 mice for ADN and CAF, **P = 0.0079, two-tailed Mann–Whitney test. Box plots show minimum, maximum, median and 25–75% percentiles. d–h, ADN activation in mice with starvation-induced autophagy: an increase in cardiac fluorescence is seen only in mice injected with ADN after starvation (n = 15 mice), and not in fed mice (n = 10) or starved mice injected with CAF (n = 6 mice) or FH-Cy5.5 (n = 3 mice) (****P < 0.0001, one-way ANOVA with Tukey post-test; box plots show minimum, maximum, median and 25–75% percentiles (d,e); detection of ADN with MRI via its effect on transverse magnetic relaxation, with short-axis R2* maps at the mid-left ventricle (LV) showing a significant increase in R2* in starved versus fed mice (N = 7 mice in each of the fed and the Stv groups, *P = 0.0262, two-tailed Mann–Whitney test; box plots show minimum, maximum, median and 25–75% percentiles) (f,g); systemic profiling of ADN, CAF and FH-Cy5.5 in starved mice versus fed controls, where the activation of ADN in the heart, small intestine and spleen reflects the upregulation of autophagy in these organs during starvation (h). i–k, Transgenic mouse model characterized by cardiomyocyte-specific upregulation of autophagy: ex vivo short-axis slices of a littermate negative (WT, top) and DDiT4L+ mouse (Tg, bottom) (i); robust activation of ADN is seen in the DDiT4L-overexpressing mice, confirming the molecular specificity of the probe (N = 4 Tg versus N = 5 WT mice, *P = 0.033, two-tailed unpaired t-test. Box plots show minimum, maximum, median and 25–75% percentiles) (j); multiplanar reformats of a wild-type (WT) and transgenic heart (Tg) (k).
Fig. 4 |
Fig. 4 |. ADN detects a reduction in autophagy when H9C2 cardiomyocytes are exposed to Dox and a cytoprotective effect when autophagy is restored.
a–e, Dox exposure inhibits autophagy in H9C2 cells: LC3 I is reduced (n = 3 in each PBS/Dox group, *P = 0.0162, two-tailed unpaired t-test), LC3 II is unchanged, p62 is increased (n = 3 in each PBS/Dox group, **P = 0.0014, two-tailed unpaired t-test) and ADN fluorescence is more than twofold decreased (n = 7 in PBS and n = 9 Dox groups, ***P = 0.0002, two-tailed Mann–Whitney test), consistent with a late block of autophagy flux. Uncropped gels are shown in Source Data Fig. 1. In bd, mean ± s.d. is plotted; in e and f, box plots show minimum, maximum, median and 25–75% percentiles. f, A corresponding increase in cell death (ANX fluorescence) is seen (n = 6 in PBS and n = 9 in Dox groups, ***P = 0.0004, two-tailed Mann–Whitney test). g, Histogram of ADN fluorescence in H9C2 cells exposed to PBS, Dox alone and Dox plus nutrient deprivation/starvation. The peak in the histogram of the Dox + Stv cells is shifted back towards the ADN peak of untreated cells (arrow), consistent with a restoration of autophagy. h–j, The stimulation of autophagy by rapamycin (Dox n = 3 and Dox + Rap n = 9, **P = 0.0091, two-tailed Mann–Whitney test) (h), statins (Dox n = 12 and Dox + Sta n = 12, ****P = < 0.0001, two-tailed Mann–Whitney test) (i) and starvation (Dox n = 6, Dox + Stv n = 6, **P = 0.0022, two-tailed Mann–Whitney test) (j) all reduce cell death (annexin-positive fraction) in H9C2 cells exposed to Dox. Box plots show minimum, maximum, median and 25–75% percentiles. k, In H9C2 cells, starvation also increases cell survival/viability by methylthiazol tetrazolium (MTT) after Dox exposure. However, in common human cancer cell lines (MCF7 and MDA-MB-231), no attenuation in the cytotoxicity (loss of viability by MTT) of Dox is seen with the induction of autophagy through starvation. H9C2 n = 6, MCF7 n = 9 and MDA-MB-231 n = 12 for all conditions. One-way ANOVA with Tukey post-test was performed. ****P < 0.0001. Box plots show minimum, maximum, median and 25–75% percentiles.
Fig. 5 |
Fig. 5 |. Starvation before Dox challenge in mice restores basal levels of autophagy, attenuates apoptosis, enhances cardiac function and improves overall survival.
a–c, Dox administration is associated with increased apoptosis and reduced autophagy. This pattern is reversed by starvation (Stv) before Dox administration, which restores basal levels of autophagy and attenuates apoptosis. Fed n = 9, Fed + Dox n = 9 and Stv + Dox n = 7. One-way ANOVA with Tukey post-test, ***P = 0.0005 and ****P < 0.0001. Box plots show minimum, maximum, median and 25–75% percentiles. In a, fluorescence maps show ADN activation, ANX and Dox distribution in the heart. d, The protective effect of pre-starvation is not due to reduced uptake or retention of Dox in the heart, which is similar in fed (n = 9) and starved (n = 7) mice. One-way ANOVA with Tukey post-test, ***P = 0.0002 and ****P < 0.0001. Box plots show minimum, maximum, median and 25–75% percentiles. e, An inverse correlation is seen between ADN activation and Dox fluorescence in the heart. f,g, Indices of cardiac function including cardiac output, stroke volume (f) and strain rate (g) were significantly improved in mice exposed to pre-starvation (n = 7) before weekly doses of Dox versus fed mice exposed to Dox (n = 4). Two-tailed Mann–Whitney tests were performed, *P = 0.042 (cardiac output), *P = 0.027 (stroke volume) and *P = 0.030 (strain rate). Box plots show minimum, maximum, median and 25–75% percentiles. h, Pre-starvation in this chronic Dox administration model (n = 8 in both groups) also improved the overall survival of the mice. Comparison of survival curves was performed using a log-rank Mantel–Cox test. **P = 0.0085.
Fig. 6 |
Fig. 6 |. In vivo imaging of autophagy with ADN.
a, Three-dimensional fluorescence and computed tomography in a starved C57BL/6 mouse. Sagittal and axial (green line) images, shown with and without fused fluorescence, confirm that the signal from ADN localizes strongly with the heart. b,c, Kinetics of ADN activation in the heart in vivo, determined with serial high-throughput planar reflectance imaging. Intense sternal (S) fluorescence in the planar images facilitates image segmentation and allows the cardiac signal to be estimated from L/R thoracic fluorescence. This ratio is elevated in starved mice (Stv, n = 4 mice) injected with ADN (arrow) but not in those co-injected with Baf (n = 3 mice). Mean ± s.e.m. values are plotted. d–g, Compartmental analysis of ADN kinetics with associated time constants (t): fit of kinetic curve in c, reflecting all compartments (n = 4 mice) (d); passage of ADN across the endothelial (n = 4 biologically independent experiments) and cell membranes (n = 3 biologically independent experiments) (e,f); mean ± s.e.m. values are plotted (df); activation of ADN by lysosomal cathepsins/proteases (average values are plotted of n = 4 biologically independent experiments) (g). The in vivo time constant of autophagic flux (tFlux) is calculated from d–g and equals 20 min. h, The in vivo kinetics of ADN are initially unperturbed by Dox (given 2 h before), but within 4 h show an incomplete but severe block. n = 4 mice (Stv), n = 4 mice (Stv + Dox) and n = 3 mice (Stv + Baf). Mean ± s.e.m. values are plotted. ik, In vivo imaging in starved nude mice over an extended time course (>40 h): the cardiac signal following a single dose of ADN is cleared/undetectable within 12 h (n = 4 mice) (mean ± s.e.m. values are plotted; L, liver) (i,j); ADN activation is strongly modulated by cycles of starvation (Stv) and re-feeding (RF) but not by the addition of rapamycin to starved mice (n = 3 mice in each group; mean ± s.e.m. values are plotted; Veh, vehicle) (k). l,m, In vivo MRI of ADN in fed (n = 6) and starved (n = 6) mice. The signal in the myocardium at the short TE (ms) is similar, but at the longer TE the accumulation of ADN in the myocardium of the starved mouse causes its MRI signal to dephase rapidly. In m, in vivo R2* in the myocardium was significantly higher in starved mice (*P = 0.0108, two-tailed Mann–Whitney test). Box plots show minimum, maximum, median and 25–75% percentiles. n,o, Western blots of the excised hearts confirm that autophagy (LC3II/I) is increased by starvation. n = 5 mice per group, **P = 0.0079, two-tailed Mann–Whitney test. Box plots show minimum, maximum, median and 25–75% percentiles. Uncropped gels are shown in Source Data Fig. 2. p, Confocal microscopy shows little activation of ADN in a fed mouse (P1) but profound activation in a starved mouse (P2–3). The arrow in P2 points to the cardiomyocyte shown in P3, where activated ADN is visible in perinuclear punctates. Microscopy was performed in fed (n = 3) and Stv (n = 4) mice with consistent results.

Comment in

  • Non-invasive monitoring of autophagy.
    Loos B, du Toit A, Hofmeyr JS. Loos B, et al. Nat Biomed Eng. 2022 Sep;6(9):1015-1016. doi: 10.1038/s41551-022-00943-w. Nat Biomed Eng. 2022. PMID: 36127452 No abstract available.

Similar articles

Cited by

References

    1. Levine B & Klionsky DJ Development by self-digestion: molecular mechanisms and biological functions of autophagy. Dev. Cell 6, 463–477 (2004). - PubMed
    1. Levine B Eating oneself and uninvited guests: autophagy-related pathways in cellular defense. Cell 120, 159–162 (2005). - PubMed
    1. Choi AM, Ryter SW & Levine B Autophagy in human health and disease. N. Engl. J. Med 368, 651–662 (2013). - PubMed
    1. Nishino I et al. Primary LAMP-2 deficiency causes X-linked vacuolar cardiomyopathy and myopathy (Danon disease). Nature 406, 906–910 (2000). - PubMed
    1. Mizushima N & Levine B Autophagy in human diseases. N. Engl. J. Med 383, 1564–1576 (2020). - PubMed

Publication types

MeSH terms