. 2022 Sep;21(9):1081-1090.
doi: 10.1038/s41563-022-01294-2. Epub 2022 Jul 11.

Directed cell migration towards softer environments

Affiliations

Directed cell migration towards softer environments

Aleksi Isomursu et al. Nat Mater. 2022 Sep.

Abstract

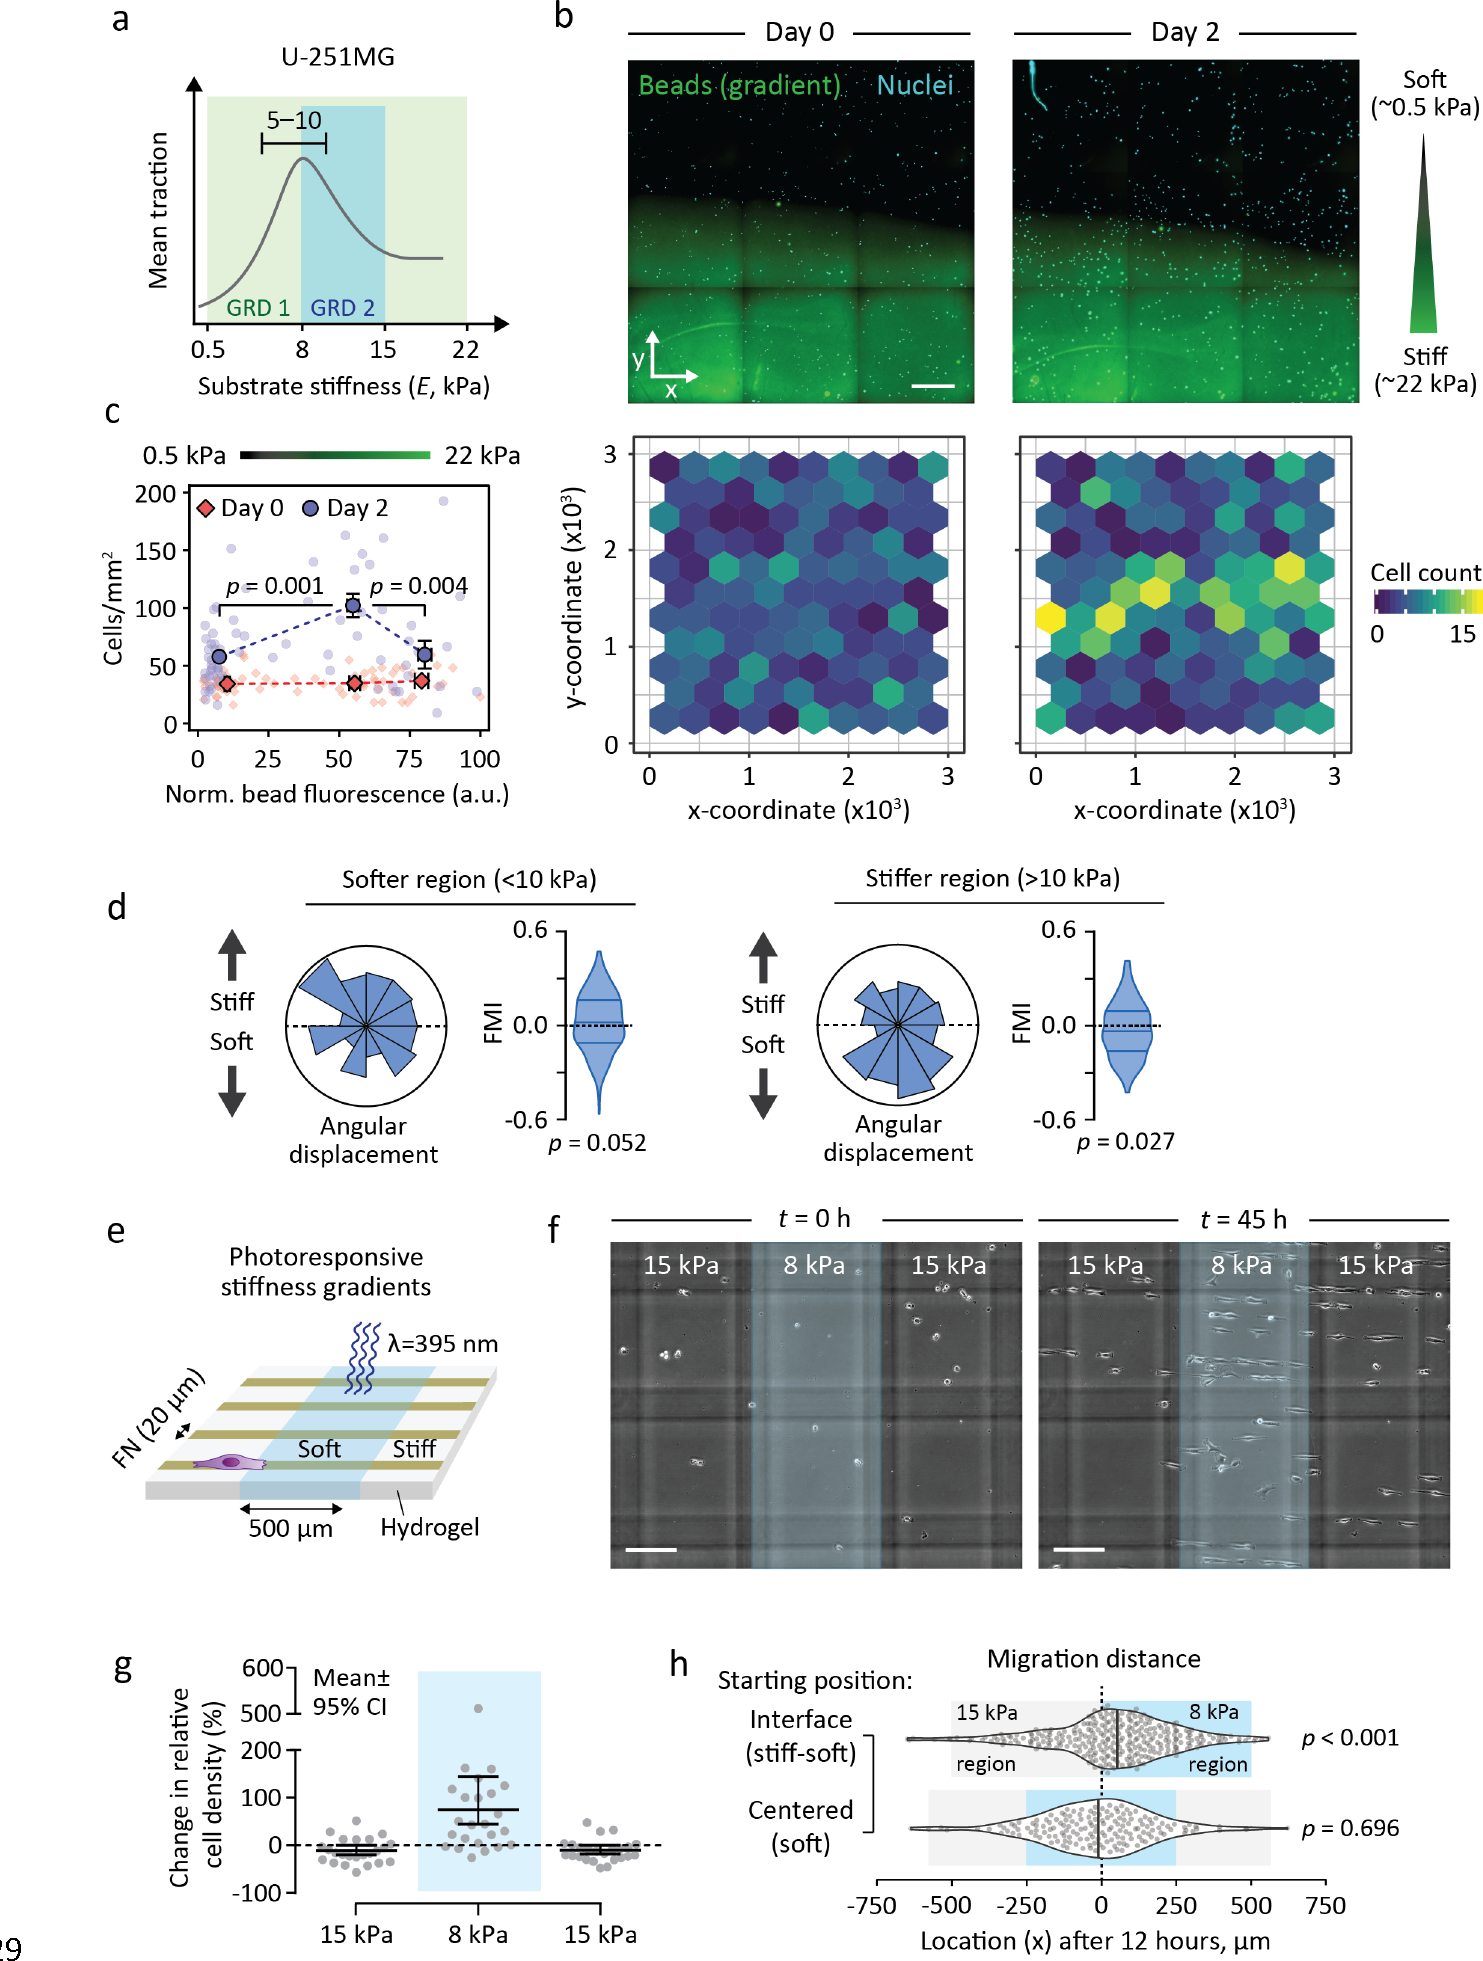
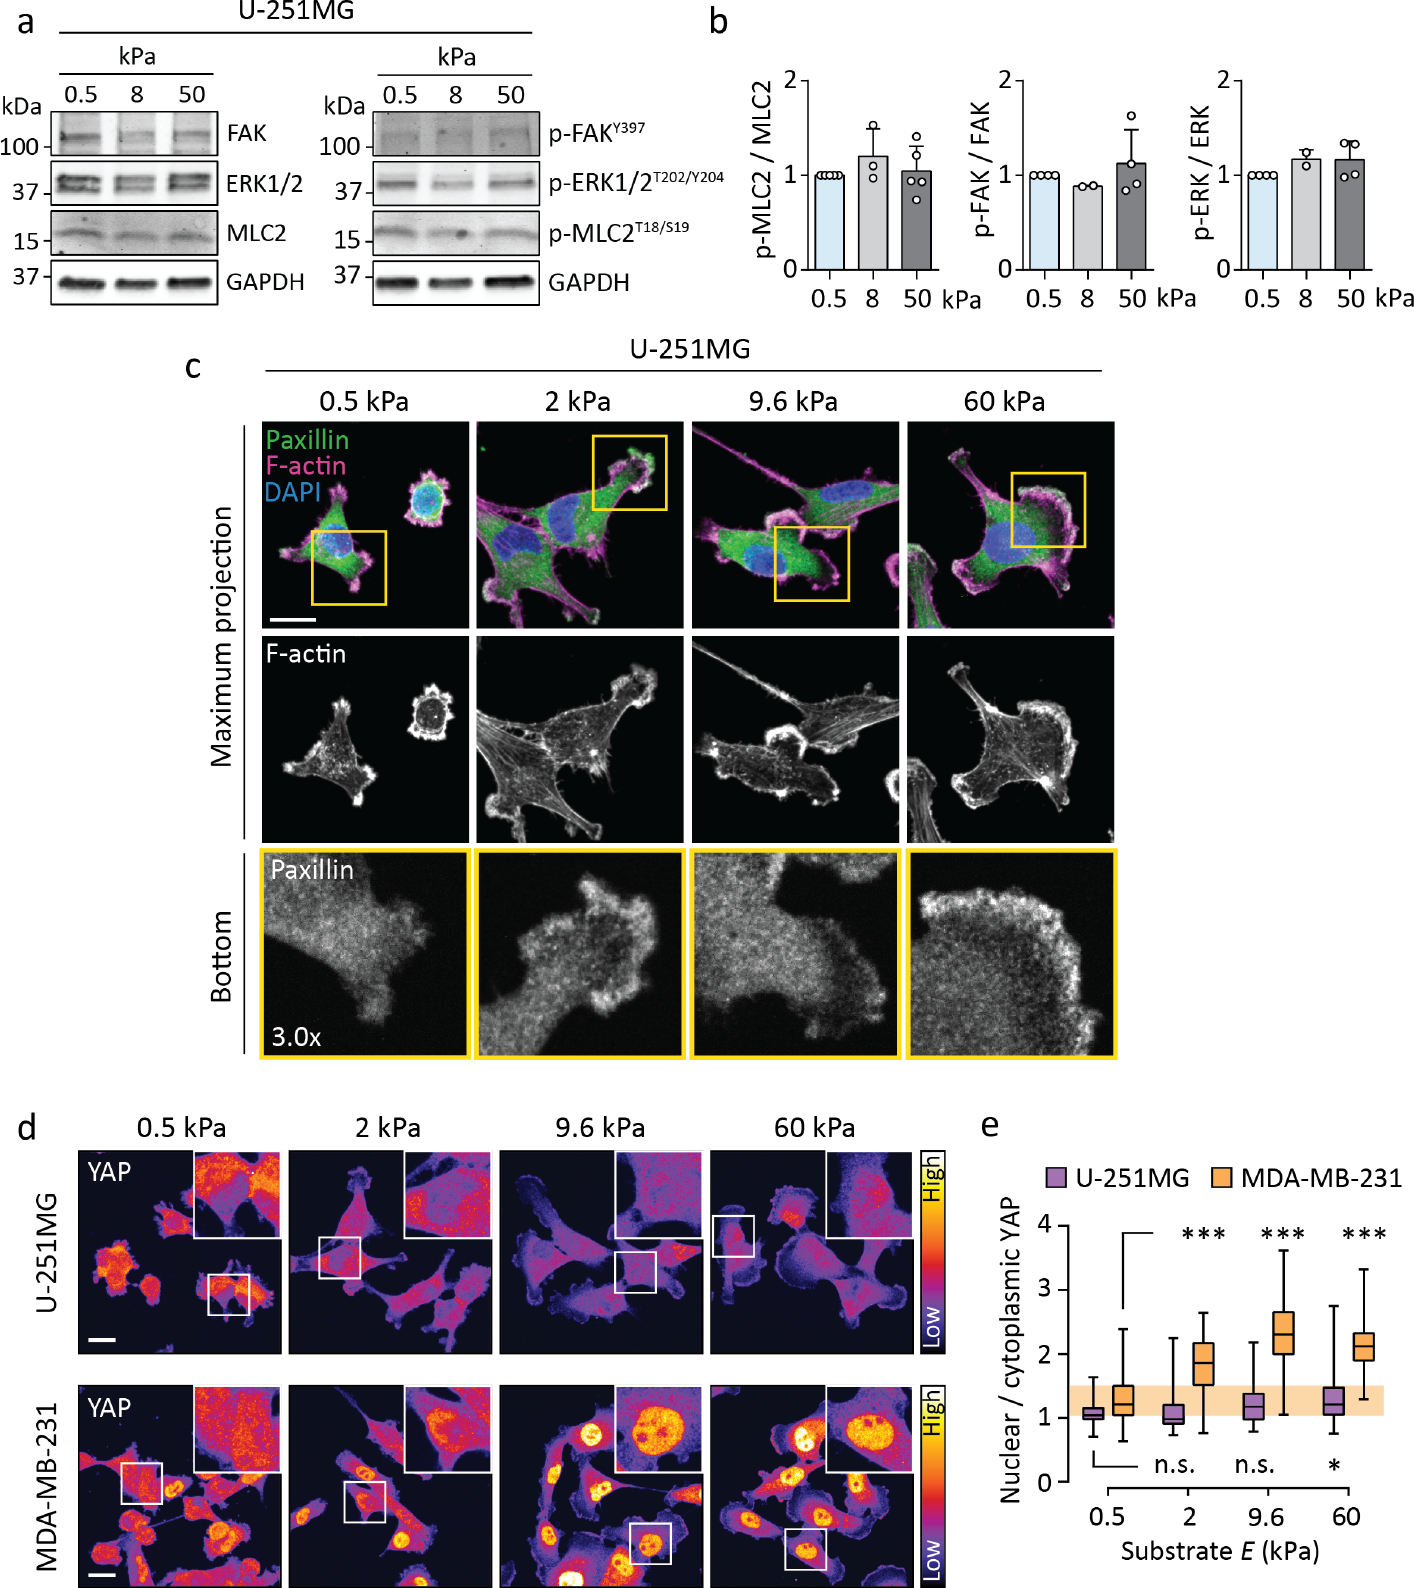
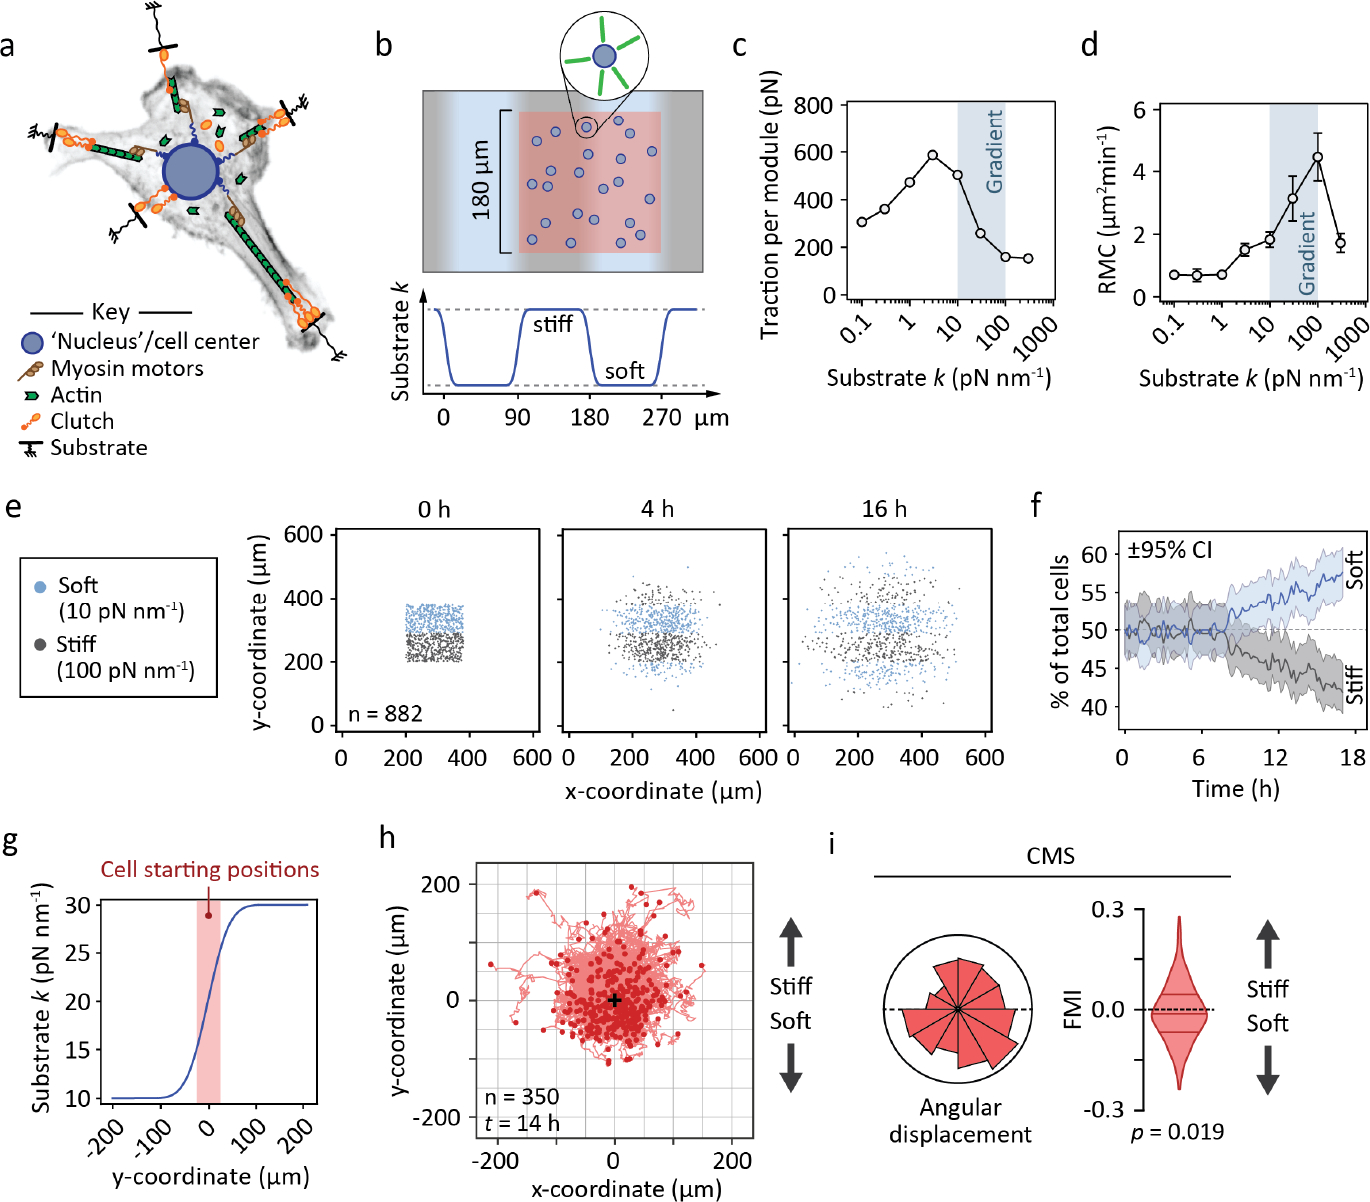
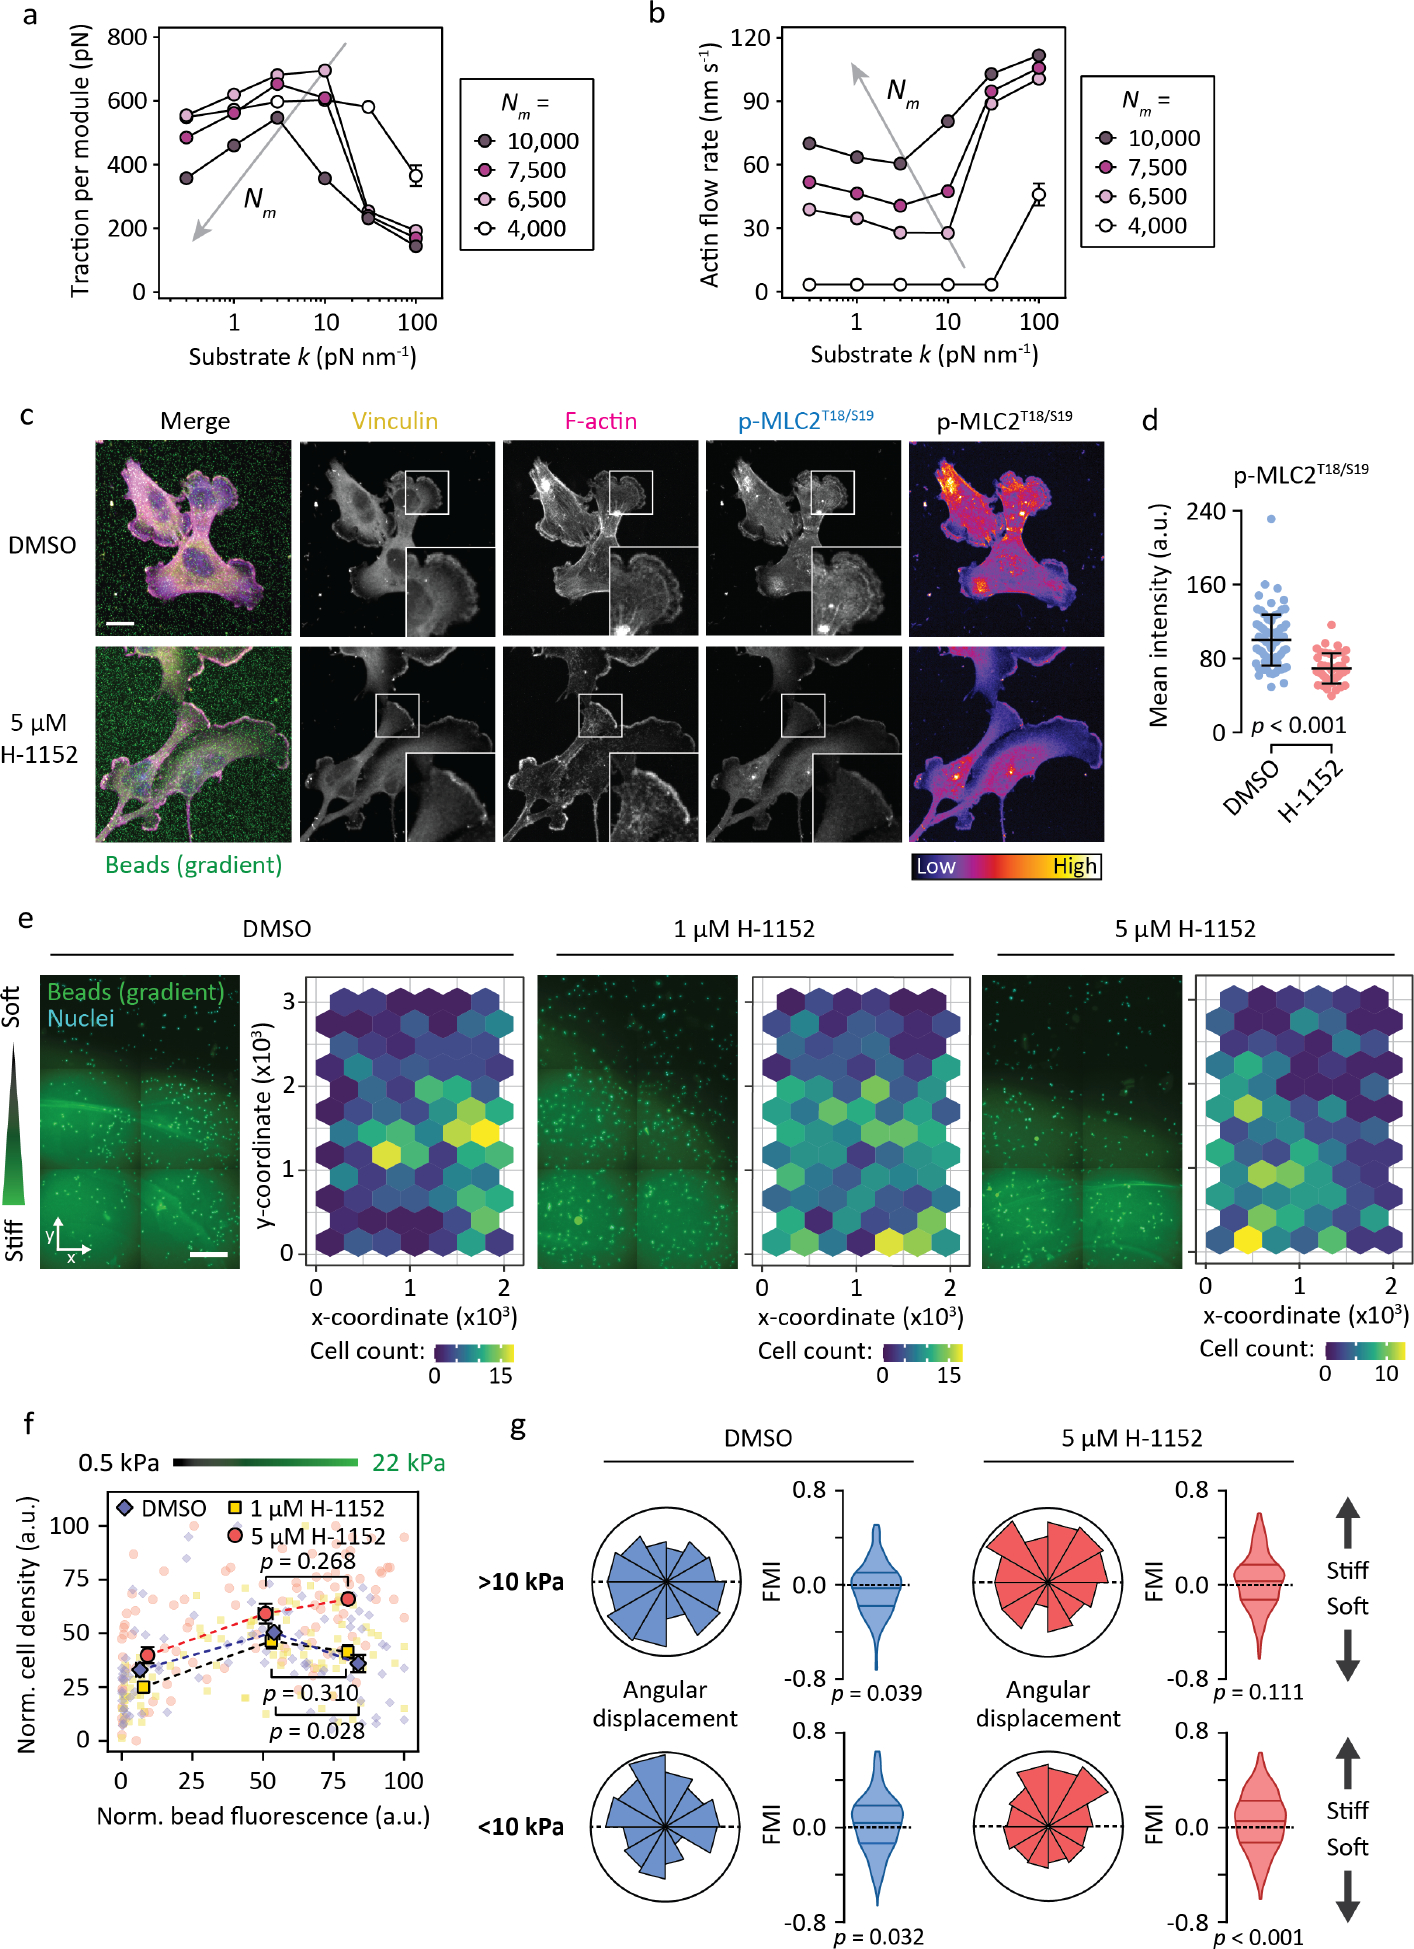
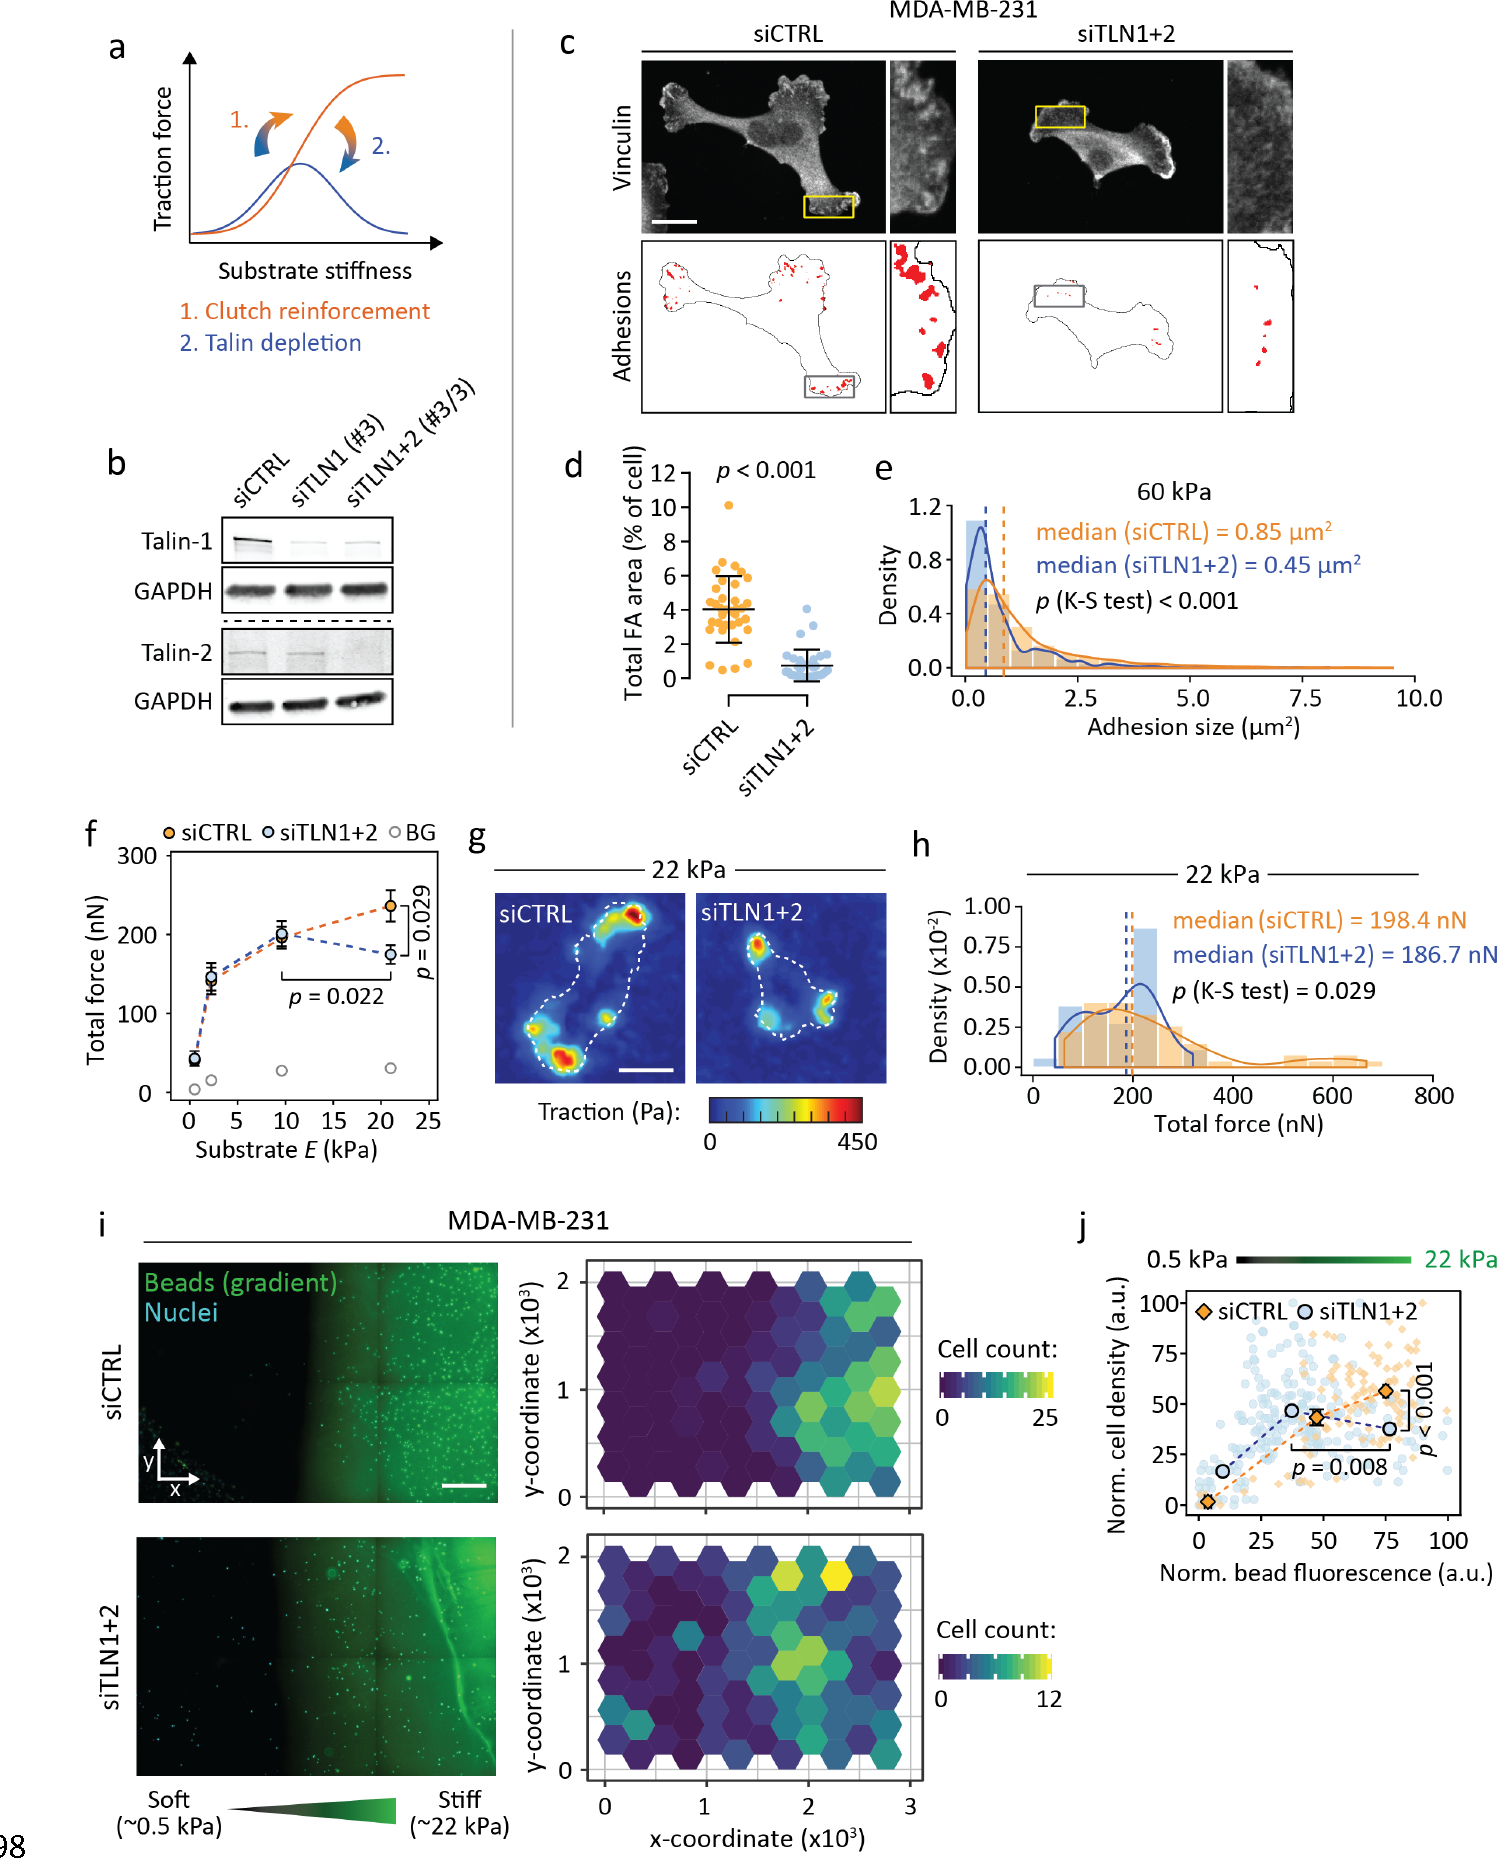
How cells sense tissue stiffness to guide cell migration is a fundamental question in development, fibrosis and cancer. Although durotaxis-cell migration towards increasing substrate stiffness-is well established, it remains unknown whether individual cells can migrate towards softer environments. Here, using microfabricated stiffness gradients, we describe the directed migration of U-251MG glioma cells towards less stiff regions. This 'negative durotaxis' does not coincide with changes in canonical mechanosensitive signalling or actomyosin contractility. Instead, as predicted by the motor-clutch-based model, migration occurs towards areas of 'optimal stiffness', where cells can generate maximal traction. In agreement with this model, negative durotaxis is selectively disrupted and even reversed by the partial inhibition of actomyosin contractility. Conversely, positive durotaxis can be switched to negative by lowering the optimal stiffness by the downregulation of talin-a key clutch component. Our results identify the molecular mechanism driving context-dependent positive or negative durotaxis, determined by a cell's contractile and adhesive machinery.


Conflict of interest statement

Conflicts of Interest

The authors declare no competing interests.

Figures

Figure 1.
Figure 1.. U-251MG glioblastoma cells undergo negative durotaxis.
(a) Schematic representation of U-251MG traction, maximal on 5–10 kPa substrates, and how it relates to the two stiffness gradients employed here. (b) (Top) Representative region of a diffusion-based polyacrylamide stiffness gradient (Young’s modulus ~0.5–22 kPa), at the outset of the experiment and 48 hours later. U-251MG cells are indicated by nuclear staining. Scale bar, 500 μm. (Bottom) Quantification of cells across the gradient. (c) Cell density in different parts of the stiffness gradient. Bins denote pooled regions of interest in the bottom, middle and top third of the gradient, respectively. Mean ± SEM of n = 14–42 ROIs, analyzed by Kruskal-Wallis one-way ANOVA and Dunn’s post hoc test. (d) Angular displacements and forward migration indices of individual U-251MG cells migrating in the softer (<10 kPa, left) and stiffer (>10 kPa, right) regions of a 0.5–22 kPa gradient. n = 174–264 cells from three independent experiments. Analyzed by Wilcoxon signed rank test. (e) Schematic representation of photoresponsive hydrogels with steep repeating stiffness gradients. (f–h) U-251MG migration on photoresponsive gradient hydrogels. A representative example (f) and quantification (g) of the change in cell density across the gradients over time. Blue overlay denotes softer, UV-exposed regions. Vertical and horizontal gray lines in (f) are out-of-focus markings in the underlying glass, used as a reference. Scale bar, 200 μm. Mean ± 95% CI from n = 24 fields of view, from two independent experiments. (h) Violin plots of accumulated distance migrated by individual cells along the x-axis over 12 hours, starting from a gradient (top) or from the middle of a compliant region (bottom). Vertical lines denote medians, n = 164–296 cells from two independent experiments. Analyzed by sign test.
Figure 2.
Figure 2.. U-251MG cells display limited mechanosensitive signaling and adhesion maturation.
(a–b) Representative western blot (a) and quantification (b) depicting protein phosphorylation in U-251MGs on 0.5–50 kPa substrates. Mean ± SD of 2–5 independent experiments. (c) Immunofluorescence images of paxillin and F-actin in U-251MGs on 0.5–60 kPa substrates. The bottom panels show individual focal planes from confocal stacks, corresponding to the basal side of each cell. Scale bar, 20 μm. (d–e) Immunofluorescence images (d) and quantification (e) showing the intracellular localization of YAP as a function of substrate stiffness in U-251MG and MDA-MB-231 cells. Insets depict representative nuclei. Scale bar, 20 μm. Each box displays upper and lower quartiles and a median, the whiskers denote minimum and maximum values. n = 57–135 cells, ***p < 0.001, *p = 0.018, n.s. = not significant, analyzed by Kruskal-Wallis one-way ANOVA and Dunn’s post hoc test.
Figure 3.
Figure 3.. Motor-clutch simulations recapitulate negative durotaxis.
(a) Schematic representation of the cell migration simulator. Individual modules and a central cell body are attached to the elastic substrate by sets of clutch molecules (Supplementary Text 2). (b) Experimental setup used here and in Figs. S8 and S9. Simulated cells in a dynamic steady state were placed on a substrate with repeating stiff and soft regions and tracked over time. An equal number of cells were placed on both stiffnesses (red area). (c–d) Module-wise traction forces (c) and RMC (d) of the simulated cells as a function of substrate stiffness. Overlays highlight the range of the 10–100 pN nm−1 gradient in (e–j). Mean ± SEM of n = 10 cells. (e–f) Evolution of cell density on mechanically heterogeneous substrates over time. (e) Coordinates of individual cells 0, 4 and 16 hours into the simulation. Stiff (≥55 pN nm−1) and compliant (<55 pN nm−1) regions are indicated by gray and blue, respectively. (f) Fraction of cells residing in the stiff and soft regions over the course of the simulation. ±95% CI, n = 882 cells. (g) Experimental setup used for investigating the migration tracks of individual simulated cells on a continuous stiffness gradient. Cells in a dynamic steady state were placed randomly on the linear part of a 10–30 pN nm−1 gradient and tracked for 14 simulated hours. (h) Tracks from individual cells on the 10–30 pN nm−1 gradient. The origo (0, 0) is highlighted by a black (+), n = 350 cells. (i) Angular displacements and forward migration indices of the cells depicted in (h). Analyzed by Wilcoxon signed rank test.
Figure 4.
Figure 4.. Decreasing actomyosin contractility selectively inhibits negative durotaxis in U-251MG cells.
(a–b) Simulated (CMS) traction forces (a) and actin retrograde flow rates (b) as functions of substrate stiffness, for different pools of molecular motors. Gray arrows denote shifts in local minima/maxima upon increasing motor numbers. Mean ± SEM of n = 10 cells. (c–d) Immunofluorescence images (c) and quantification (d) depicting vinculin and levels of phosphorylated MLC2 in U-251MG cells after 48 h on 0.5–22 kPa gradients, with or without ROCK inhibitor H-1152. Scale bar, 20 μm. Mean ± SD of n = 42–83 cells, analyzed by Mann-Whitney test. Representative of two independent experiments. (e) Representative regions of three 0.5–22 kPa stiffness gradients, 48 hours after being seeded with U-251MG cells and supplemented with varying concentrations of H-1152. Scale bar, 500 μm. Interspaced with depictions of cell counts across the gradients. (f) Relative cell densities in different parts of the gradients, overlaid with binned data. Mean ± SEM of n = 16–41 ROIs per bin, from two gradient hydrogels per condition, representative of two independent experiments. Analyzed by Mann-Whitney test. (g) Angular displacements and forward migration indices of individual U-251MG cells migrating in the stiffer (>10 kPa, top) and softer (<10 kPa, bottom) regions of 0.5–22 kPa gradients. n = 177–327 cells from one (DMSO) to two (H-1152) independent experiments. Analyzed by Wilcoxon signed rank test.
Figure 5.
Figure 5.. Lowering stiffness optimum by blocking adhesion reinforcement shifts MDA-MB-231 cells from positive to negative durotaxis.
(a) Schematic representation of the relationship between traction forces, substrate stiffness and talin/vinculin-mediated ‘clutch reinforcement’. Depletion of these clutch components forces some cell types back into a biphasic traction regime. (b) Representative western blot depicting talin-1 and talin-2 double knockdown in MDA-MB-231 cells. (c–d) Immunofluorescence images (c) and quantification (d) of focal adhesions in MDA-MB-231s on 60 kPa substrate, without and after talin knockdown. Scale bar, 20 μm. Mean ± SD of n = 32–35 cells, analyzed by Mann-Whitney test. (e) Distribution of focal adhesion sizes in control and talin-low cells. Histograms overlaid with probability density functions, dashed lines indicate medians. n = 524–1844 adhesions from 32–35 cells, analyzed by Kolmogorov-Smirnov test. Representative of two independent experiments. (f–h) Traction force analysis of control and talin-low MDA-MB-231s. (f) Total force exerted by the cells as a function of substrate stiffness. Background, BG. Mean ± SEM of n = 18–55 cells from three independent experiments. (g) Representative traction maps from cells on 22 kPa substrate. Cell outlines are indicated by white dashed lines. Scale bar, 20 μm. (h) Histograms of the 22 kPa data overlaid with probability density functions, with dashed lines indicating medians. n = 37–55 cells from three independent experiments, analyzed by Kolmogorov-Smirnov test. (i) (Left) Representative regions of two 0.5–22 kPa polyacrylamide stiffness gradients, 72 hours after being seeded with MDA-MB-231 cells (indicated by nuclear staining). Scale bar, 500 μm. (Right) Quantification of cells across the gradients. (j) Relative cell densities in different parts of the gradients, overlaid with binned data. Mean ± SEM of n = 13–141 ROIs per bin, from one (siCTRL) or two (siTLN1+2) gradient gels, representative of three independent experiments. Analyzed by Mann-Whitney test.

References

    1. Ladoux B, Mège R-M & Trepat X Front-Rear Polarization by Mechanical Cues: From Single Cells to Tissues. Trends Cell Biol. 26, 420–433 (2016). - PMC - PubMed
    1. Hamidi H & Ivaska J Every step of the way: integrins in cancer progression and metastasis. Nat. Rev. Cancer 18, 533–548 (2018). - PMC - PubMed
    1. Lo CM, Wang HB, Dembo M & Wang YL Cell movement is guided by the rigidity of the substrate. Biophys. J. 79, 144–152 (2000). - PMC - PubMed
    1. Isenberg BC, DiMilla PA, Walker M, Kim S & Wong JY Vascular Smooth Muscle Cell Durotaxis Depends on Substrate Stiffness Gradient Strength. Biophys. J. 97, 1313–1322 (2009). - PMC - PubMed
    1. Plotnikov SV, Pasapera AM, Sabass B & Waterman CM Force fluctuations within focal adhesions mediate ECM-rigidity sensing to guide directed cell migration. Cell 151, 1513–1527 (2012). - PMC - PubMed

Publication types