. 2022 Jul;54(7):996-1012.
doi: 10.1038/s41588-022-01108-w. Epub 2022 Jul 11.

Functional landscapes of POLE and POLD1 mutations in checkpoint blockade-dependent antitumor immunity

Affiliations

Functional landscapes of POLE and POLD1 mutations in checkpoint blockade-dependent antitumor immunity

Xiaoxiao Ma et al. Nat Genet. 2022 Jul.

Abstract

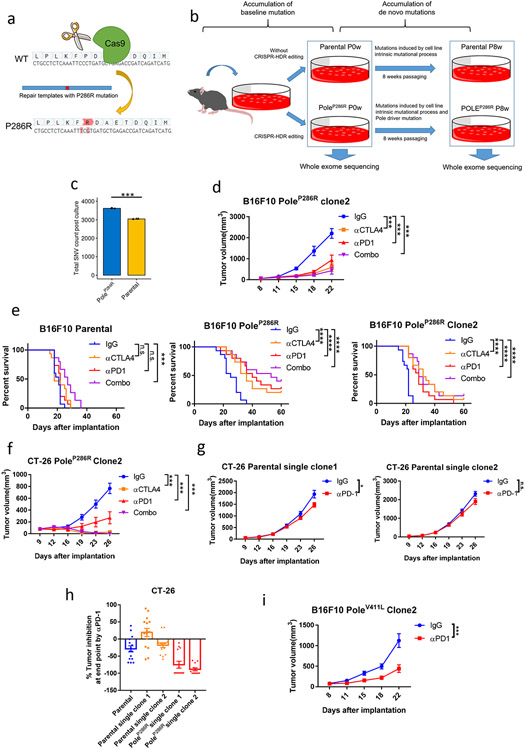
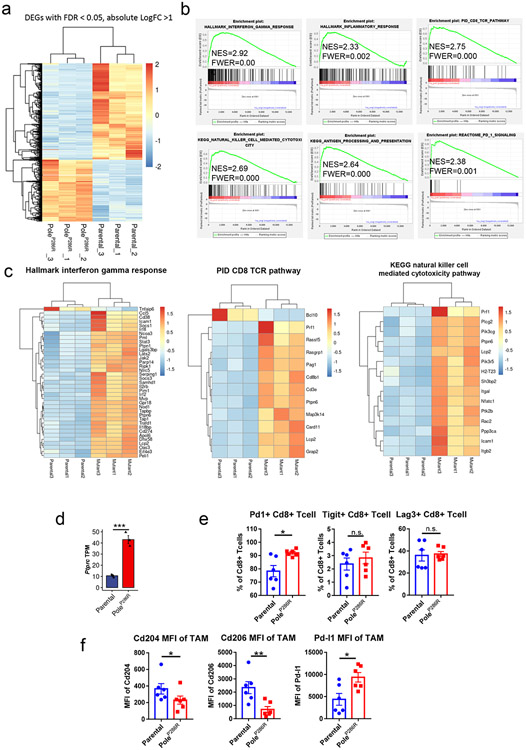
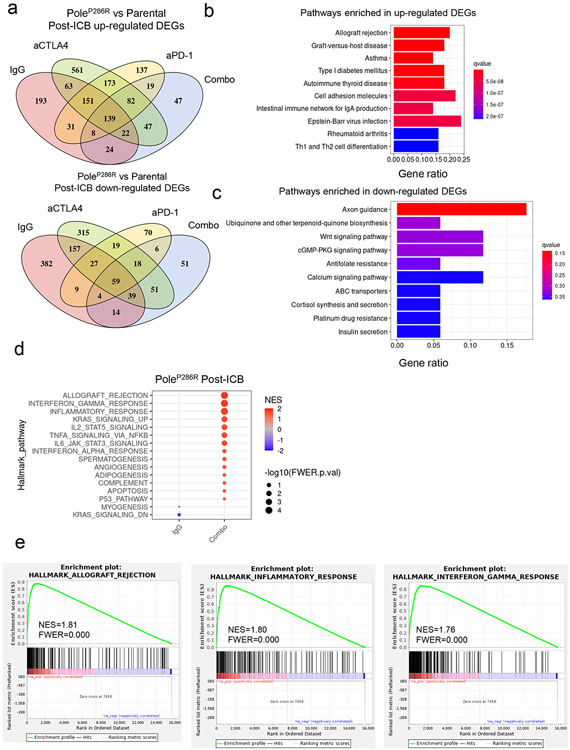
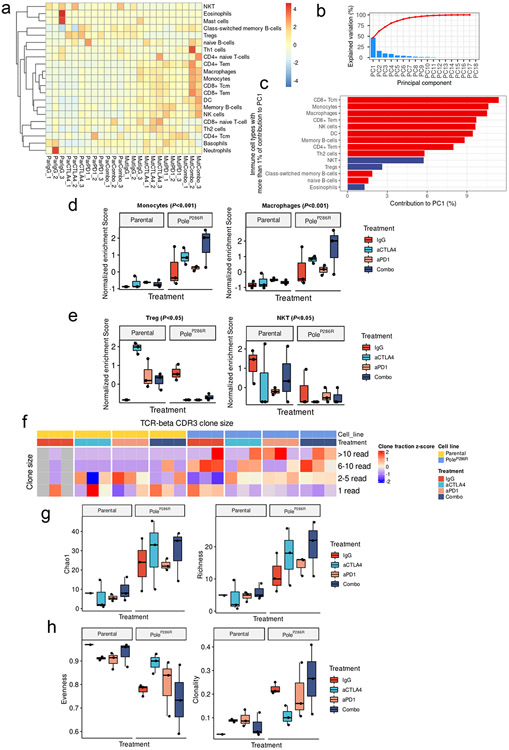
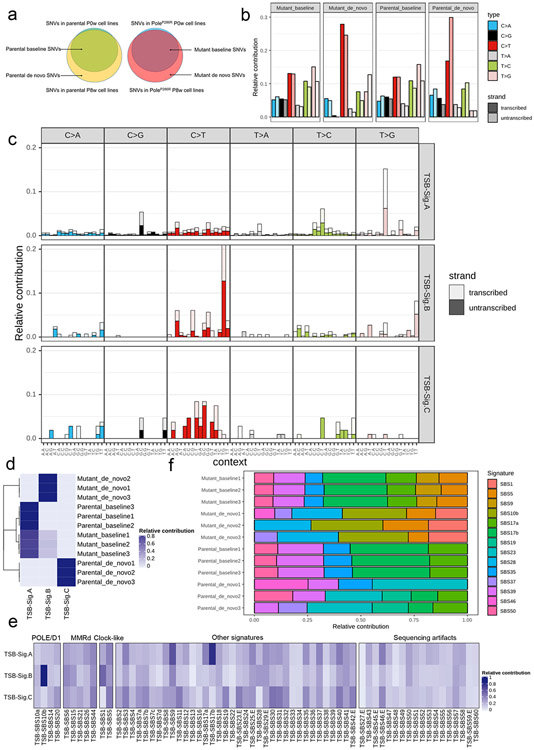
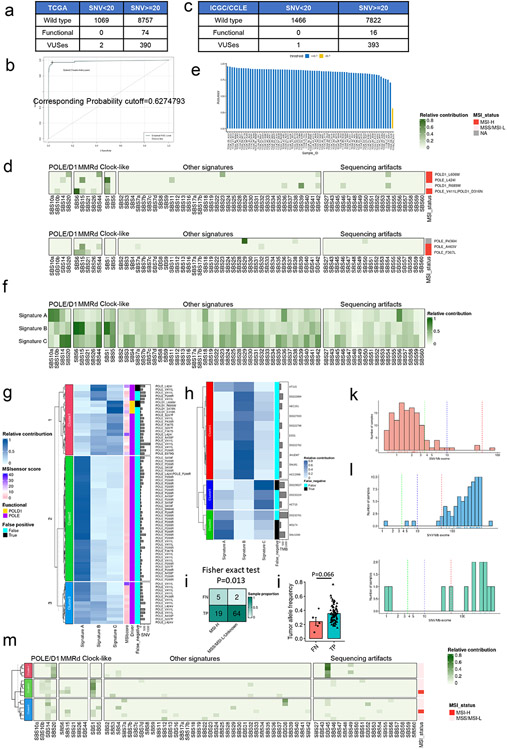
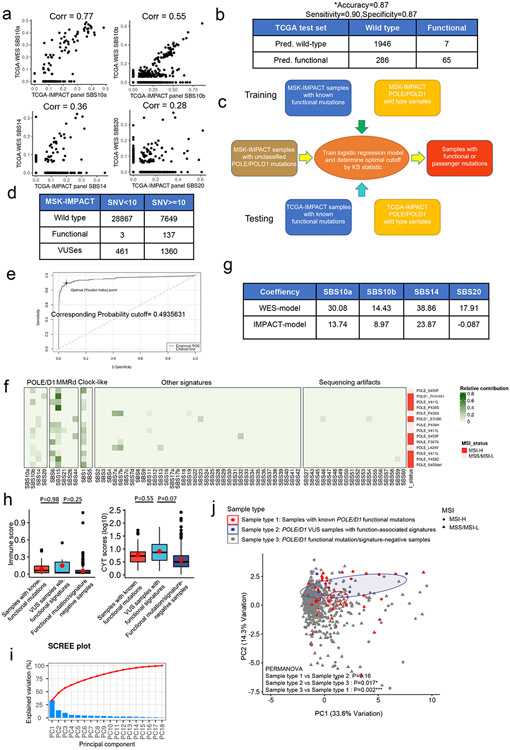
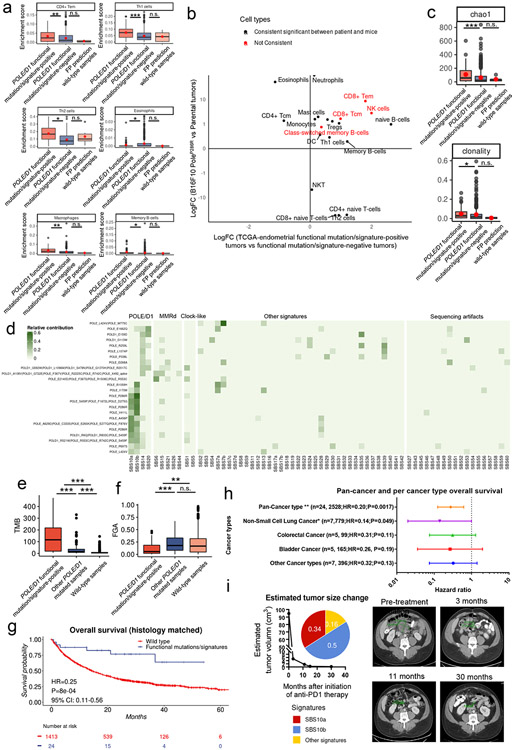
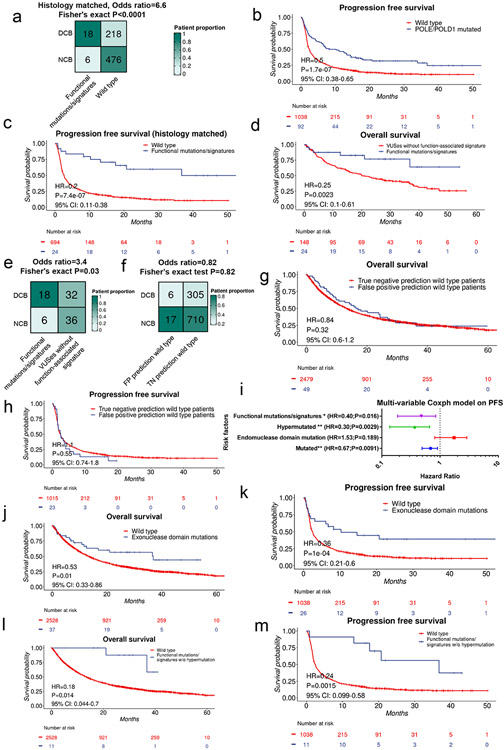
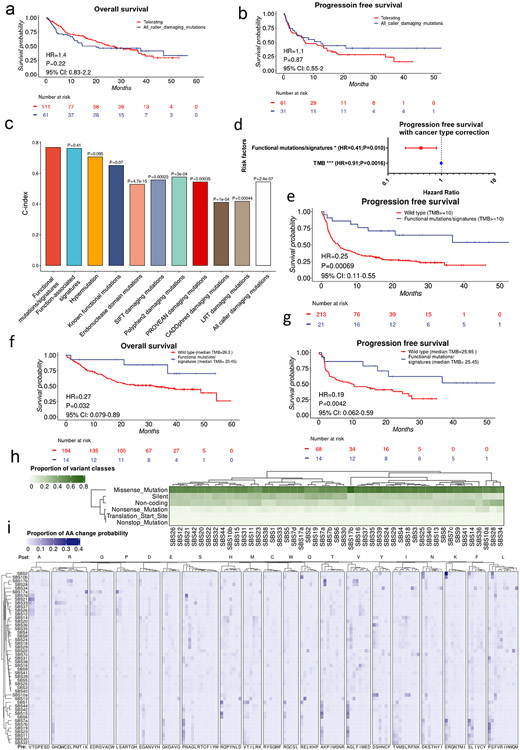
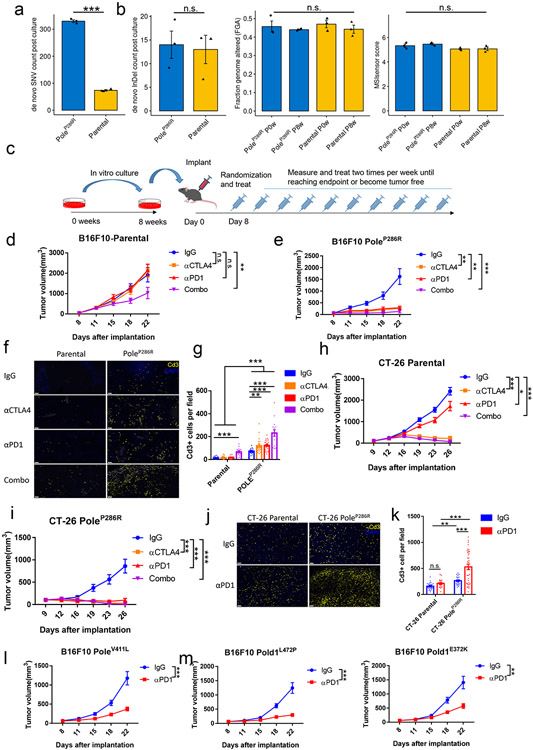
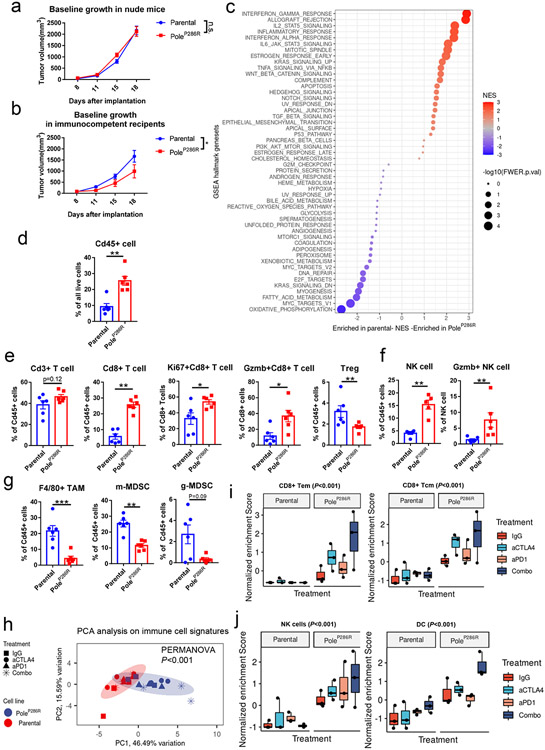
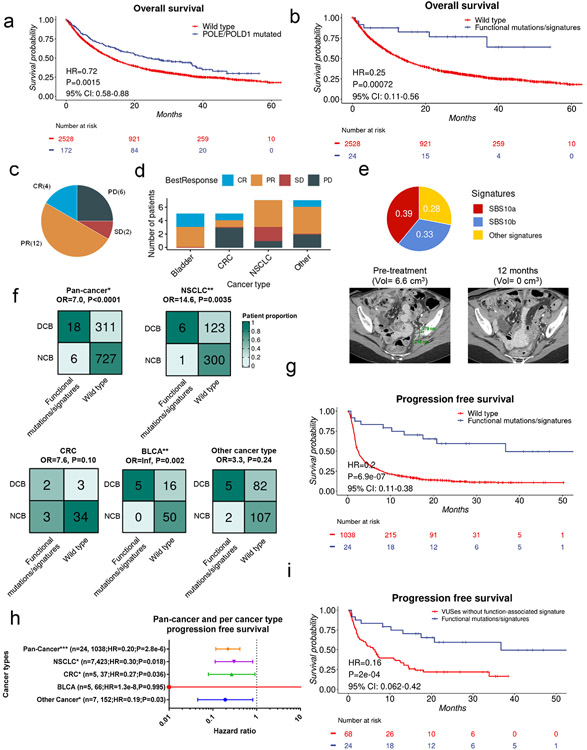
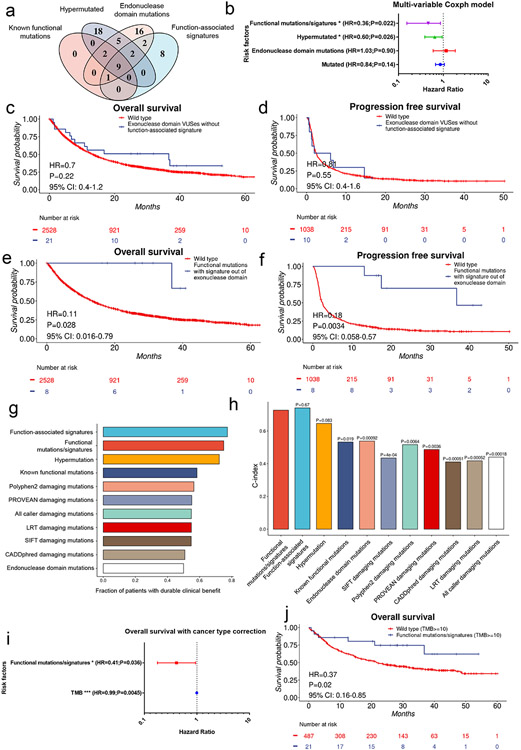
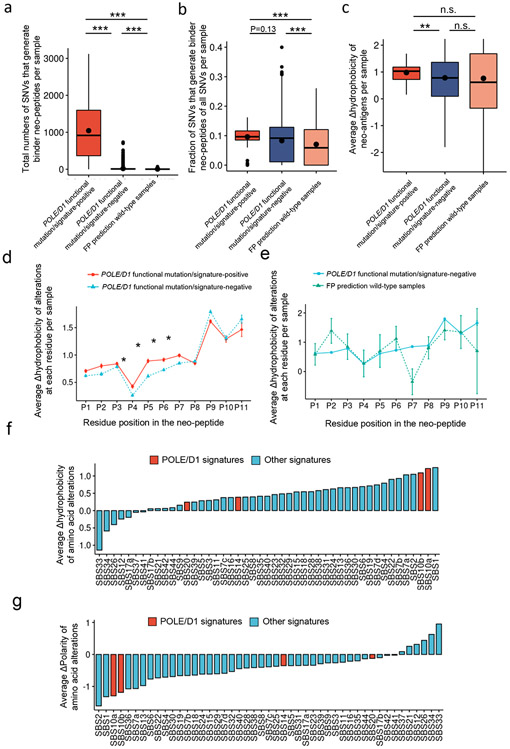
Defects in pathways governing genomic fidelity have been linked to improved response to immune checkpoint blockade therapy (ICB). Pathogenic POLE/POLD1 mutations can cause hypermutation, yet how diverse mutations in POLE/POLD1 influence antitumor immunity following ICB is unclear. Here, we comprehensively determined the effect of POLE/POLD1 mutations in ICB and elucidated the mechanistic impact of these mutations on tumor immunity. Murine syngeneic tumors harboring Pole/Pold1 functional mutations displayed enhanced antitumor immunity and were sensitive to ICB. Patients with POLE/POLD1 mutated tumors harboring telltale mutational signatures respond better to ICB than patients harboring wild-type or signature-negative tumors. A mutant POLE/D1 function-associated signature-based model outperformed several traditional approaches for identifying POLE/POLD1 mutated patients that benefit from ICB. Strikingly, the spectrum of mutational signatures correlates with the biochemical features of neoantigens. Alterations that cause POLE/POLD1 function-associated signatures generate T cell receptor (TCR)-contact residues with increased hydrophobicity, potentially facilitating T cell recognition. Altogether, the functional landscapes of POLE/POLD1 mutations shape immunotherapy efficacy.


Figures

Extended data figure 1.
Extended data figure 1.. Mouse tumors harboring Pole/d1 functional mutations are sensitive to immunotherapy.
a, Strategy to introduce PoleP286R into murine cell lines. The P286R nonsynonymous mutation was introduced into endogenous Pole genes via CRISPR-HDR technique. b, Scheme of in vitro culture and WES (whole exome sequencing) of parental and PoleP286R mutant cell lines. After validated by amplicon sequencing, single cell clone derived PoleP286R mutant cell lines (clone 1) were subject to WES sequencing. The cell lines were further cultured for another 8 weeks, cryopreserved and subjected to WES sequencing again. c, Total SNV (single nucleotide variant) counts of the PoleP286R mutant and parental cell lines before and after 8 weeks of in vitro culture (N=3 biological replicates). P values indicate two-sided Student’s t-tests. Data are presented as mean values ± s.e.m. (n.s., no statistical significance, * P<0.05, ** P<0.01, *** P<0.005). d, Growth curve of the B16F10 PoleP286R clone2 cell line with ICB therapies (N=15 mice per group). P values (anti-CTLA4, P=0.0003; anti-PD1, P=0.0002; Combo, P= 0.0001). e, Survival analysis of mice bearing the B16F10 parental (anti-CTLA4, P=0.14; anti-PD1, P=0.13; Combo, P= 0.0003), the B16F10 PoleP286R (anti-CTLA4, P<0.0001; anti-PD1, P<0.0001; Combo, P<0.0001) or the B16F10 PoleP286R clone2 tumors (anti-CTLA4, P<0.0001; anti-PD1, P<0.0001; Combo, P<0.0001) after ICB (N=15 mice per group). P values indicate log rank test significance (n.s., no statistical significance, * P<0.05, ** P<0.01, *** P<0.005, **** P<0.0001). f, Growth curves of the CT26- PoleP286R clone2 cell line with ICB therapies (N=15 mice per group). P values (CTLA4 P=1.1e-8, PD-1 P=0.0015, Combo P=3.2e-9). g, Growth curves of the CT-26 PoleWT single cell clone 1 and clone 2 tumors with IgG or anti-PD1 therapy (N=15 mice per group). P values (Clone 1 P=0.023, Clone2 P=0.053). h, Quantification of tumor inhibition rates of the CT-26 parental, CT-26 PoleWT single clones and CT-26 PoleP286R clone 1 and clone 2 tumors with anti-PD1 therapy at the last time point. Tumor inhibition rate was calculated as percentage of reduced tumor volume compared to the IgG treated tumors (N=15). Dots represent individual biological replicates. P values indicate two-sided Student’s t-tests (n.s., no statistical significance, *P<0.05, ** P<0.01, *** P<0.005). Data are presented as mean values +/− SEM. i, Growth curves of the B16F10 PoleV411L clone2 with anti-PD1 therapy (N=15 mice per group, P=0.0001). For all growth curves related panels (d, f, g, i), P values indicate two-sided Student’s t-tests at the end time points (n.s., no statistical significance, * P<0.05, ** P<0.01, *** P<0.005). Data are presented as mean values ± s.e.m.. No multiple comparisons adjustment was performed.
Extended data figure 2.
Extended data figure 2.. The baseline immune microenvironment of the Pole mutant tumors.
a, Heatmap of 1298 DEGs (differentially regulated genes) from RNA-seq analysis of the B16F10 parental and PoleP286R mutant tumors 14 days post implantation. Color sale indicates normalized z-score. b, GSEA (gene set enrichment assay) indicating enrichment of gene sets related to interferon gamma response, T cell and NK cell activation, inflammation, antigen presenting pathway and PD1 signaling in the mutant tumors versus parental tumors. c, Heatmap showing DEGs (FDR P <= 0.05) between parental and mutant tumors from the Hallmark interferon gamma response pathway, PID CD8 TCR pathway and KEGG natural killer cell mediated cytotoxicity pathway. d, Ptprc TPM of parental and mutant tumors from the RNA-seq data showed in Fig. 2c (N=3 biological replicates). P=0.0008 indicate two-sided Student’s t-tests (n.s., no statistical significance, * P<0.05, ** P<0.01, *** P<0.005). Data are presented as mean values +/− SEM. e, Flow cytometry analysis of the percentage of Cd8 T cells expressing Pd-1 (P=0.026), Tigit (P=0.48) and Lag3 (P=0.78) in the parental and mutant tumors 14 days post implantation (N=6 biological replicates). P values indicate two-sided Student’s t-tests (n.s., no statistical significance, * P<0.05, ** P<0.01, *** P<0.005). Data are presented as mean values +/− SEM. f, Flow cytometry analysis of expression intensity of Pd-l1 (P=0.045), Cd204 (P=0.043) and Cd206 (P=0.0087) on tumor associated macrophages in the parental and mutant tumors 14 days post implantation (N=6 biological replicates). P values indicate two-sided Student’s t-tests at the end time points (n.s., no statistical significance, * P<0.05, ** P<0.01, *** P<0.005). Data are presented as mean values +/− s.e.m..
Extended data figure 3.
Extended data figure 3.. Immune microenvironment of the post-treatment Pole mutant tumors.
a, Differentially expressed genes up-regulated or down-regulated in the post-ICB PoleP286R tumors versus the parental tumors. There are 82 DEGs that are consistently upregulated in all ICB treatment arms, while there are 59 genes are consistently downregulated in mutant tumors of all immune checkpoint blockade (ICB) arms. b, Top 10 KEGG pathways that were significantly enriched in the consistently up-regulated DEGs. c, Top 10 KEGG pathways that were enriched in the consistently down-regulated DEGs across all ICB arms. No pathway is statistical significantly enriched, as determined by q value <0.05. d, GSEA analysis of PoleP286R tumor in the combo arm versus the IgG arm. Only pathways with nominal p value <0.05 were shown. e, GSEA plot of enriched gene sets related with inflammatory response in combo ICB arm versus IgG arm of the PoleP286R tumors.
Extended data figure 4.
Extended data figure 4.. Both adaptive and innate immune cell types contribute to the distinct immune profiles of the post-treatment Pole mutant tumors, compared to that of the parental tumors.
a, Heatmap of immune-cell-type-signatures enrichment in the post-ICB samples. Color scale indicates normalized enrichment scores. b, Screen plot of the principal component analysis. Bars indicate the explained variations for each PC. The red line and dots indicate the accumulatively explained variations from PC1 to each other PC. c, Contribution of each immune-cell-type-signature to PC1. Red indicates the enrichment score of the immune-cell-type-signatures aligned to the same direction with the PC1 axle, blue indicates the enrichment score of the immune-cell-type-signatures aligned to the opposite direction with the PC1 axle. d, Normalized enrichment score of monocytes and macrophages in post-ICB tumors (N=3 biological replicates). P values (monocytes P=3.98e-5; macrophage P=4.1e-6) were derived from two-way ANOVA test. The minima (0% percentile), maxima (100% percentile) were plotted as the whiskers, 25% percentile and 75% percentile were plotted as the bounds of the boxes, medians were plotted as the center bar. e, Normalized enrichment score of Treg (regulatory T cell) and NKT cells in post-immunotherapy tumors (N=3 biological replicates). P values (Treg P=0.030; NKT P=0.022) were derived from two-way ANOVA test. i, z-score transformed fraction of the TCR-beta CDR3 clone types in the post-treated parental and PoleP286R tumors. Note that no CDR3 clone type is successfully extracted from two of the parental tumors treated with IgG. f, Chao1 index and richness score of the TCR-beta CDR3 sequence of post-treated tumors (N=3 biological replicates). g-h, Chao1, richness, evenness and clonality scores of the TCR-beta CDR3 sequences of post-treated tumors (N=3 biological replicates). P values (Chao1 P=0.012; Richness P=0.051; Evenness P=0.26; Clonality P=0.26) were derived from two-way ANOVA test. For all boxplots (d-e, g-h), the minima (0% percentile), maxima (100% percentile) were plotted as the whiskers, 25% percentile and 75% percentile were plotted as the bounds of the boxes, medians were plotted as the center bar.
Extended data figure 5.
Extended data figure 5.. Mutation signatures of the Pole mutant cell lines.
a, Schematic explanation of the baseline and de novo SNVs in parental and mutant cell lines. b, Transcriptional strand bias (TSB) of the six base substitution categories of the baseline and de novo mutations from the B16F10 parental and PoleP286R mutant cell lines. De novo mutations in the parental and the PoleP286R mutation cell lines showed distinct transcriptional strand bias, indicating that these mutations are generated by different biological processes. c, The 192 TSB base substitutions in trinucleotide sequence contexts of the three NMF extracted de novo TSB mutational signatures from the baseline and de novo SNVs of the B16F10 parental and PoleP286R mutant cell lines. d, Contribution of the three NMF extracted de novo TSB mutation signatures to the baseline and de novo mutations in the B16F10 parental and PoleP286R mutant cell lines showed that the TSB-Sig.B is exclusively contributed to the de novo mutations discovered in the B16F10 PoleP286R mutant cell lines. e, Cosine similarity of the de novo mutational TSB signatures with COSMIC TSB-SBS signatures v3. The TSB-Sig.B is highly similar to the POLE/D1 functional signature TSB-SBS10b (cosine similarity of 0.84). f, COSMIC SBS signatures extracted from B16F10 parental and PoleP286R mutant cell lines by NNLS method. The POLE/D1 functional signature SBS10b can only be extracted from the de novo SNVs of the PoleP286R mutant samples.
Extended data figure 6.
Extended data figure 6.. Statistical models based on functional mutational signatures can be used to identify tumors with POLE/D1 functional mutations.
a, Sample summary of the TCGA data set. Wild-type, tumors are wild-type for POLE/D1 (POLE or POLD1); Functional, tumors harboring at least one known POLE/D1 functional mutation; Mutated, tumors with only POLE/D1 variant of unknown significance (VUS); SNV, total counts of SNV in the exome region of the tumors. b, the optimal Youden Index point and corresponding probability cutoff value on the logistic regression model trained on the TCGA training set. TPR, True Positive Rate, FPR, False Negative Rate. c, Sample summary of the ICGC/CCLE test set. d, Heatmap of the Non-negative least squares (NNLS) extracted COSMIC SBS signatures of false negative predictions in the TCGA training set and ICGC/CCLE test set. e, Reconstitution accuracy of the non-negative matrix factorization (NMF) extracted signatures on SNVs from the TCGA samples with POLE/D1 functional mutations, an accuracy threshold of 0.7 were used determine the reliability of the reconstitution. f, Cosine similarity of the three NMF extracted mutational signatures from the TCGA tumors samples with known POLE/D1 functional mutations to the COSMIC SBS signatures. Cosmic SBS signatures were clusters based on their associated biological processes. POLE/D1, SBS mutational signatures associated with POLE/D1 functional mutations; MMRd, SBS mutational signatures related to mismatch repair deficiency; Clock-like, SBS mutational signatures that related to Clock-like mutational processes; Sequencing artifacts, SBS signatures possibly generated by sequencing artifacts; Other signatures, SBS signatures associated with all other biological processes. g, Contribution of the three NMF extracted de novo mutational signatures to the TCGA samples with known POLE/D1 functional mutation in the training set, with the known functional mutation in each sample labeled. MSIscore, MSI sensor score. TMB, SNV count in the exome region by WES sequencing. Functional mutation, whether the functional mutation in the samples belongs to POLE or POLD1 mutations. False negative, samples harboring known POLE/D1 functional mutations in the TCGA training set are predicted as non-functional mutation samples by the logistic regression model. h, Contribution of the three NMF extracted de novo mutational signatures from TCGA samples with known POLE/D1 functional mutations in the corresponding samples in the ICGC/CCLE test set. Cluster 1,2&3 corresponding to Cluster 1,2&3 in (g). i, Fisher exact test on the MSI status of the TP and FN samples from the WES training and test sets when MSI status is available. j. Tumor allele frequencies of the POLE/D1 functional mutations from the false negative predictions (FN, N=5), True positive predictions (TP, N=77) from the TCGA and ICGC WES cohorts, as tumor allele frequency is not available for some of the functional mutations in these samples. P value was calculated with two-sided Wilcoxon Rank Sum Test. k, Distribution of the false positive prediction (FP) samples from the WES training set based on SNV count/Mb exome. The green dash line indicates cutoff for SNVlow (3 SNV/Mb exome), the blue dash line indicates cutoff for SNVint/hi (10 SNV/Mb exome) and the red dash line indicates cutoff for SNVhyper (50SNV/Mb exome). l, Distribution of the TP samples (top plot) or VUS samples (bottom plot) that were predicted as functional mutation samples from the WES training model based on SNV count/Mb exome. The green dash lines indicate cutoff for SNVlow (3.6 SNV/Mb exome), the blue dash lines indicate cutoff for SNVint/hi (10 SNV/Mb exome) and the red dash lines indicate cutoff for SNVhyper (50SNV/Mb exome). m. Unsupervised clustering of the SNVint/hi FP samples from the TCGA training set based on the extracted COSMIC SBS signatures.
Extended data figure 7.
Extended data figure 7.. Statistical models based on functional mutational signatures predict functional mutations and associated immune features.
a, Proportion of functional-related COSMIC SBS signatures extracted from TCGA WES data or TCGA-IMPACT panel simulation data in each samples in the training set. Pearson correlation coefficients were shown. b. Confusion table of the WES model applying to the TCGA-impact cohort. Accuracy, sensitivity and specificity were calculated and presented. Pred. wild-type, samples that were predicted as wild-type for POLE/D1 (POLE or POLD1) functional mutations; Pred. functional, samples that were predicted harboring POLE/D1 functional mutations. c, Scheme of training a logistic regression model to identify tumors containing known POLE/D1 functional mutations from MSK-IMPACT targeted panel sequencing data. d, Sample summary of the MSK-IMPACT training set. e, Optimal Youden Index point and corresponding probability cutoff value on the logistic regression model trained on MSK-IMPACT training set. f, Heatmap of the NNLS extracted COSMIC SBS mutational signatures of the false negative predictions from the MSK-IMPACT training set. POLE/D1, SBS mutational signatures associated with POLE/D1 functional mutations; MMRd, SBS mutational signatures related to mismatch repair deficiency; Clock-like, SBS mutational signatures that related to Clock-like mutational processes; Sequencing artifacts, SBS signatures possibly generated by sequencing artifacts; Other signatures, SBS signatures associated with all other biological processes. g, Co-efficiency of the four POLE/D1 functional-associated mutational signatures in the WES trained logistic regression model and the IMPACT panel trained model. h. Immune infiltration score and CYT score (log10 transformed) of the samples with known POLE/D1 functional mutations (N=53) and POLE/D1 variant of unknown significance (VUS) samples with functional signatures (N=7) compared to the POLE/D1 functional mutation/signature-negative tumors (N=520) from the TCGA endometrial cohort. samples with known POLE/D1 functional mutations, tumors harbor known POLE/D1 functional mutations; VUS samples with functional signatures, samples harbor POLE/D1 VUSes and were positive for POLE/D1 functional signatures predicted by the functional signature-based model, POLE/D1 functional mutation/signature-negative tumors, wild type samples or samples harbor POLE/D1 VUSes and did not show POLE/D1 functional signature. P values were calculated with two-sided Wilcoxon Rank Sum Test. The minima (0% percentile), maxima (100% percentile) were plotted as the whiskers, 25% percentile and 75% percentile were plotted as the bounds of the boxes, medians were plotted as the center bar and means were plotted as center black dot. i. Screen plot of the principal component analysis on the TCGA-endometrial cohort showing how much variation could be explained by each principal component (PC). Bars indicate the explained variations for each PC. The red line and dots indicate the accumulatively explained variations from PC1 to other PCs respectively. j, Sample separation plot of the three groups of samples in (h) based on the first two PCs of the above PCA analysis, P values were calculated with Permutational multivariate analysis of variance (PERMANOVA) test. (n.s., no statistical significance, * P<0.05, ** P<0.01, *** P<0.005)
Extended data figure 8.
Extended data figure 8.. Immune features and the outcome of patients with POLE/D1 functional mutations/signatures.
a, Enrichment scores of the immune cell types that are significantly upregulated or down-regulated in the POLE/D1 (POLE or POLD1) functional mutation/signature-positive tumors and FP (false positive) prediction wild-type tumors compared to the POLE/D1 functional mutation/signature-negative tumors (POLE/D1 functional mutation/signature-positive tumors N=60, POLE/D1 functional mutation/signature-negative tumors N=520, FP prediction wild-type tumors N=6; also see Fig. 5d). POLE/D1 functional mutation/signature-positive, tumors either harbored known POLE/D1 functional mutations, or only harbored POLE/D1 variants of unknown significance (VUS) and were positive for POLE/D1 functional signatures; POLE/D1 functional mutation/signature-positive tumors, samples were predicted as wild-type samples by the functional signature-based model, regardless of the POLE/D1 mutation status; FP prediction wild-type tumors, wild type sample predicted as POLE/D1 functional signature-positive (i.e., false positive) by the logistic regression model. P values (CD4 Tem P=0.0042; Th1 P=6.2e-5; Th2 P=1.6e-9; Eosinophils P=0.027; Macrophages P=4.8e-5; Memory B-cell P=0.036). b, Log-fold changes of the enrichment scores of different immune cell types from the human tumors (POLE/D1 functional mutation/signature-positive tumors versus POLE/D1 functional mutation/signature-negative tumors) and mouse tumors (PoleP286R baseline tumors versus parental baseline tumors). Red color indicates cell types that are consistently upregulated or downregulated with P<0.05 for both human and mouse tumor comparisons. c, Chao1 and clonality index of the TCR-beta CDR3 repertoires from the POLE/D1 functional mutation/signature-positive tumors (N=59), POLE/D1 functional mutation/signature-negative tumors (N=463), and FP prediction wild-type tumors (N=5) of the TCGA-endometrial cohort when TCR-beta CDR3 repertoire data is available. P values (Chao1 P= 8.5e-5, clonality P=0.045). d, COSMIC SBS signature profiles of the 24 POLE/D1 functional mutation/signature-positive patients in the ICB cohort. e-f. Comparison of the TMB (e) and copy number alterations (f) between the POLE/D1 functional mutation/signature-positive patients, other POLE/D1 mutated patients, and wild-type patients (N=24, 148 and 2528 patients). TMB, tumor mutational burden, non-synonymous mutation count/Mb IMPACT panel exome region (P=2.2e-5; P=0.0021). FGA, fraction of genome copy number alteration (P<2.2e-16; P=0.0095). g, Kaplan-Meier overall survival plot of the POLE/D1 functional mutation/signature-positive patients by the MSK-IMPACT logistic regression model versus the histology matched POLE/D1 wild-type patients. Log-Rank P value and hazard ratio shown were calculated from coxph model with cancer type correction. h, Forest plot of the POLE/D1 functional mutations/signatures in coxph models of overall survival after immunotherapy with cancer type correction for pan-cancer or single cancer type categories that have at least three POLE/D1 functional mutation/signature-positive patients. Number of POLE/D1 functional mutation/signature-positive patients, number of wild-type patients, hazard ratio and Log-Rank P value are shown for each cancer type category in the figure. Horizontal bars represent the 95% confidence interval for the hazard ratios. Each line indicates an individual coxph model generated for the indicated cancer type category. Error bar centres indicate Hazard ratios for each individual cox model. Statistical significance was evaluated with two-sided test. (n.s., no statistical significance, * P<0.05, ** P<0.01, *** P<0.005). i, estimated tumor size change and composition of the mutational signatures for one of the CR patients who harbored POLEP286R functional mutation. Composition of the mutational signatures, and MRI image (pre-ICB and different time point post-ICB, Green mark indicated tumor location and sizes) with estimated tumor volume curve were shown. For all boxplots (a, c, e), P values were calculated from Wilcoxon Rank Sum Test (n.s., no statistical significance, * P<0.05, ** P<0.01, *** P<0.005). The minima (0% percentile), maxima (100% percentile) were plotted as the whiskers, 25% percentile and 75% percentile were plotted as the bounds of the boxes, medians were plotted as the center bar.
Extended data figure 9.
Extended data figure 9.. POLE/D1 functional signatures predicts immunotherapy response.
a. Comparison of the proportion of clinical beneficial cases between the POLE/D1 (POLE or POLD1) functional mutation/signature-positive patients and the histology matched wild-type patients. Functional mutations/signatures, patients either harbored known POLE/D1 functional mutations, or only harbored POLE/D1 variants of unknown significance (VUSes) but were predicted as functional signature-positive, determined by the logistic regression model. P value was derived from Fisher’s exact test. b, Kaplan-Meier progression free survival probability plot of the patients harboring any types of POLE/D1 mutations versus POLE/D1 wild-type patients. c, Kaplan-Meier progression free survival plot of the POLE/D1 functional mutation/signature-positive patients versus the histology matched POLE/D1 wild-type patients. d, Kaplan-Meier overall survival plot of the POLE/D1 functional mutation/signature-positive patients versus the POLE/D1 functional signature-negative VUS patients. e. Comparison of the proportion of clinical beneficial cases of the POLE/D1 functional mutation/signature-positive patients to all the other POLE/D1 mutated patients after immunotherapy. P value was derived from Fisher’s exact t-test. F. Comparison of the proportion of clinical beneficial cases of the FP (false positive) prediction wild-type patients versus the TN (true negative) prediction wild-type patients upon ICB. FP prediction wild-type patients, POLE/D1 wild-type patients that were predicted as POLE/D1 functional mutation-positive by the logistic regression model. TN prediction wild-type patients, POLE/D1 wild-type patients that were predicted as wild-type samples by the logistic regression model. P value was derived from Fisher’s exact t-test. g-h, Kaplan-Meier overall survival (g) and progression free survival plot (h) of FP prediction wild-type patients versus TN prediction wild-type patients. I, A multivariable coxph model comparing the predictive capability of different patient selection strategies on the progression free survival on patients after ICB (N=1130). Hazard ratio and P value are presented in the figure. Horizontal bars represent the 95% confidence interval of the hazard ratio. Error bar centres indicate hazard ratios. Statistical significance levels were generated from the coxph model without adjustment for multiple comparison (* P<0.05, ** P<0.01, *** P<0.005). j-k, Kaplan-Meier overall survival plot (j) and progression free survival plot (k) of the POLE/D1 exonuclease domain mutation-positive patients versus the POLE/D1 wild-type patients. l-m, Kaplan-Meier overall survival plot (l) and progression free survival plot (m) of the POLE/D1 functional mutation/signature-positive patients that were not hypermutated, versus the POLE/D1 wild-type patients. For all Kaplan-Meier plots (b-d, g-h, j-m), Log-Rank P value and hazard ratio shown were calculated from coxph model with cancer type correction.
Extended data figure 10.
Extended data figure 10.. POLE/D1 functional signature-based model predicts ICB outcome and outperforms traditional approaches.
a-b. Kaplan-Meier overall survival plot (a) and progression free survival plot (b) of the patients with at least one POLE/D1 (POLE or POLD1) mutation classified as damaging mutation by all five in silico prediction algorithms versus all the rest patients with POLE/D1 mutations. c, C-index (concordance index) of the coxph models generated based on different patient selection strategies with cancer type correction on the ICB related progression free survival of all the POLE/D1 mutated patients (N=172). Two-sided P values were calculated from paired student t-tests of coxph model based on POLE/D1 functional mutation/signature-positive against other models without multiple comparison adjustment. Functional mutations/signatures, patients either harbored known POLE/D1 functional mutations, or only harbored POLE/D1 variants of unknown significance (VUSes) but were predicted as functional signature-positive, determined by the logistic regression model. d, Multi-variable coxph model of ICB progression free survival for ‘POLE/D1 functional mutation/signature-positive’ and TMB with cancer type correction (N=1130). Only POLE/D1 functional mutation/signature-positive and TMB are shown in the forest plot, * log-rank P<0.05. *** log-rank P<0.005. Error bar indicating 95% CI of the Hazard ratio. e, Kaplan-Meier progression free survival plot of the POLE/D1 functional mutation/signature-positive patients versus the POLE/D1 wild-type patients in the ICB treated patient cohort with high TMB (TMB>=10). f, Kaplan-Meier overall survival plot of a random sub-cohort of the POLE/D1 functional mutation/signature-positive patients versus the POLE/D1 wild-type patients with matched median and minimum TMB. g, Kaplan-Meier progression free survival plot of a random sub-cohort of the POLE/D1 functional mutation/signature-positive patients versus the POLE/D1 wild-type patients with matched median and minimum TMB. h, Proportion heatmap of the observed association between SBS mutational signatures with each SNV class in the TCGA pan-cancer cohort. i. Proportion heatmap of the observed association between SBS mutational signatures with each amino acid alteration class in the TCGA pan-cancer cohort. Amino acids on the top row are the new AA generated from the SNV mutation (Post); Amino acids on the bottom row are the AA from the wild-type allele (Pre). For all Kaplan-Meier plots (a-b, e-g), Log-Rank P value and hazard ratio shown were calculated from coxph model with cancer type correction.
Figure 1.
Figure 1.. Mouse tumors harboring Pole/Pold1 functional mutations are sensitive to immunotherapy.
a, SNV accumulation in B16F10 parental and PoleP286R mutant cell lines after 8 weeks of in vitro cell passaging compared to before 8 weeks passaging (N=3 biological replicates). Two-sided P=1.7e-5 was derived from student t-test (*** p<0.005). b, Changes of insertion/deletion, copy number alternation and MSIsensor score in the B16F10 parental and PoleP286R mutant cell lines after 8 weeks of in vitro cell passaging. FGA, fraction of genome with copy number alteration (N=3 biological replicates). Two-sided P values (InDel P=0.82, SCNVs P=0.74; MSIsensor score P=0.68) were derived from student t-tests (n.s., no statistical significance). c, Schematic of immunotherapy experiments with murine models. Parental and Pole mutant cell lines after 8 weeks of in vitro passaging were implanted into animals and treated with ICB. Tumor volume was monitored until the end point or when the tumor was no longer identifiable. d, Tumor growth curves of the B16F10 parental cell line with ICB alone or in combination. Representative results from two independent experiments (N=15 mice per group). P values (anti-CTLA4, P=0.67; anti-PD1, P=0.61; Combo, P= 0.007). e, Tumor growth of the B16F10 PoleP286R mutant cell line with ICB alone or in combination. Representative results from two independent experiments (N=15 mice per group). P values (anti-CTLA4, P=0.002; anti-PD1, P=0.003; Combo, P= 0.0009). f, Immunofluorescence analysis of Cd3+ T cell in the B16F10 parental and PoleP286R tumors after two weeks of immunotherapy, bars represent 50um. g, Immunofluorescence staining from (f) was quantified (N= at least 15 independent fields). Dots represent individual fields. For comparison between two treatments, P values (Mutant IgG vs anti-CTLA4 P=0.0079; Mutant IgG vs anti-PD1 P=5.7e-6; Mutant IgG vs Combo P=4.1e-8; Parental IgG vs Combo P= 9.7e-8) indicate two-sided Student’s t-tests. The comparison between parental and mutant tumors indicates two-way ANOVA tests (P<0.001). h, Tumor growth curves of the CT-26 parental colorectal cell line with single and combination ICB. Representative results from two independent experiments (N=15 mice per group). P values (anti-CTLA4, P=8.5e-14; anti-PD1, P=0.019; Combo, P= 1.3e-14). i, the CT-26 PoleP286R colorectal cell line are more sensitive to anti-Pd1 therapy than the parental CT-26 cell line. Representative results from two independent experiments (N=15 mice per group). P values (anti-CTLA4, P=1.3e-6; anti-PD1, P=3.2e-7; Combo, P= 0.0009). j, Immunofluorescence analysis of Cd3+ T cell in the CT-26 parental and PoleP286R tumors after two weeks of anti-PD1 therapy, bars represent 50um. k, Immunofluorescence staining from (j) was quantified (N= at least 15 independent fields). Dots represent individual fields. P values (Mutant IgG vs anti-PD1 P=0.0002; Parental anti-PD1 vs Mutant anti-PD1 P=0.0005; Parental IgG vs Mutant IgG P=0.0022; Parental IgG vs Parental anti-PD1 P=0.09). i, Tumor growth curves of the isogenic B16F10 cell lines harboring PoleV411L with anti-PD1 or IgG therapy (N=15 mice per group). P=0.0002. m, Tumor growth curves of isogenic B16F10 cell lines harboring Pold1L472P or Pold1E372K mutations after treatment with anti-PD1 therapy or IgG control (N=15 mice per group). P values (Pold1L472P P=1.4e-4; Pold1E372K P=0.0051). For all panels, data are presented as mean values ± s.e.m. with no multiple comparison adjustment performed (n.s., no statistical significance, * P<0.05, ** P<0.01, *** P<0.005). For all growth curves related panels (d-e, h-i, l-m), P values indicate two-sided Student’s t-tests at the end time points.
Figure 2.
Figure 2.. The immune microenvironment of tumors harboring PoleP286R functional mutations.
a, Tumor growth curves of the parental and B16F10 PoleP286R mutant tumors in immuno-deficient nude mice. Representative results from two independent experiments (N=10 mice per group). P values from two-sided Student’s t-tests at the end time points (n.s., no statistical significance). b, Tumor growth curves of the parental and B16F10 PoleP286R mutant tumors in immunocompetent B6 mice. Representative results from two independent experiments (N=10 mice per group). P=0.047 indicate two-sided Student’s t-tests at the end time points (* p<0.05). c, Summary of GSEA analysis on MsigDB hallmark gene sets comparing the mutant vs. parental gene expression profiles. NES, normalized enrichment score; FWER.p.val, the family-wise error rate p value. d, Flow cytometry quantification of the Cd45+ immune cell in B16F10 parental and PoleP286R mutant tumors 14 days post implantation (N=6 biological replicates). P=0.002 indicate two-sided Student’s t-tests at the end time points (n.s., no statistical significance, ** p<0.01). e, Flow cytometry analysis of the T cell populations in the B16F10 parental and PoleP286R mutant tumors 14 days post implantation (N=6 biological replicates). Gzmb, Granzyme B protein. Treg, regulatory T cells. P values (Cd8+ T cell P=0.002; Ki67+ Cd8 T cell P=0.018; Gzmb+Cd8 T cell P=0.015; Treg P=0.0087) indicate two-sided Student’s t-tests. f, Flow cytometry analysis of the NK cell population in the parental and mutant tumors (N=6 biological replicates). P values (NK cell P=0.0053, Gzmb+ NK cell P=0.0062) indicate two-sided Student’s t-tests at the end time points. g, Flow cytometry analysis of the innate immune components in parental or PoleP286R tumors 14 days after implanting into B6 mice (N=6 biological replicates). TAM, tumor associated macrophage; m-MDSC, monocytic myeloid derived suppressor cell, determined by Cd11b+Ly6GLy6Chi phenotype (P=0.0022); g-MDSC, granulocytic myeloid derived suppressor cell, determined by Cd11b+Ly6G+Ly6Cint phenotype; P values (TAM P=0.0043, m-MDSC P=0.0022, g-MDSC P=0.093) indicate two-sided Student’s t-tests. h, PCA analysis based on immune cell type signature enrichment of post-ICB tumors. Colored areas indicate confidence ellipses. P values were derived from PERMANOVA test on the first two PCs. i, Normalized enrichment scores of the CD8+ effector memory T-cells (Tem) and CD8+ central memory T-cells (Tcm) in post-ICB tumors (N=3 biological replicates). P values (CD8 Tem P=7.7e-4; CD8 Tcm P=3.2e-5) were derived from two-way ANOVA tests. j, Normalized enrichment score of the NK cells and Dendritic cells (DC) in post-ICB tumors (N=3 biological replicates). P values (NK P=3.4e-5; DC P=8.6e-6) were derived from two-way ANOVA tests. For all panels excepting c&h, data are presented as mean values ± s.e.m. with no multiple comparison adjustment performed (n.s., no statistical significance, * P<0.05, ** P<0.01, *** P<0.005). For boxplots in i-j, the minima (0% percentile), maxima (100% percentile) were plotted as the whiskers, 25% percentile and 75% percentile were plotted as the bounds of the boxes, medians were plotted as the center bar.
Figure 3.
Figure 3.. Dissecting the de novo mutational signatures in the B16F10 PoleP286R model.
a, Analysis of the six classes of base substitutions of the baseline and de novo mutations in the B16F10 parental and PoleP286R mutant cell lines indicating altered mutational profile after introduction of the PoleP286R mutation (N=3). Baseline, SNVs found in the parental or PoleP286R mutant cell lines before 8 weeks of cell culture. De novo, SNVs found only in parental or PoleP286R mutant cell lines after 8 weeks cell culture. P values (C>T P=0.005, T>G P=0.007) indicate two-sided Student’s t-tests (** P<0.01). Data are presented as mean values ± s.e.m. b, Contribution of the three NMF extracted de novo mutation signatures to the baseline and de novo mutations in the B16F10 parental and PoleP286R mutant cell lines showed that the mSig. B exclusively contributed to the de novo mutations discovered in the B16F10 PoleP286R mutant cell lines. c, 96 base substitutions in trinucleotide sequence contexts of the three NMF extracted de novo mutational signatures from the baseline and de novo mutations of the B16F10 parental and PoleP286R mutant cell lines. d, Analysis of cosine similarity of the three NMF extracted de novo mutation signatures with the established human cancer mutational signatures from COSMIC SBS signatures v3 indicates a high similarity between the mSig. B and the known POLE/D1 function-associated mutational signature SBS10b. Cosmic SBS signatures were clusters based on their associated biological processes. POLE/D1, SBS mutational signatures associated with POLE/D1 functional mutations; MMRD, SBS mutational signatures related to mismatch repair deficiency; Clock-like, SBS mutational signatures that related to Clock-like mutational processes; Sequencing artifacts, SBS signatures possibly generated by sequencing artifacts; Other signatures, SBS signatures associated with all other biological processes.
Figure 4.
Figure 4.. Statistical models based on mutational signatures can accurately identify tumors harboring POLE/D1 functional mutations from WES data and target panel sequencing data.
a, Scheme of training a logistic regression model to identify tumors that contain POLE/D1 functional mutations from whole exome sequencing data. Tumor samples harboring known POLE/D1 functional mutations and POLE/D1 wild-type tumors were used to generate the training set, while samples from the ICGC and CCLE dataset were used to generate test set to evaluate the performance of the model. The trained model was then applied on tumor samples with POLE/D1 VUSes from the TCGA, ICGC and CCLE data sets, to identify potential samples containing new functional mutations. b, ROC (receiver operating characteristic) curve with AUC (area under the curve) and confusion matrix of the logistic regression model trained on the TCGA WES training set. Accuracy, sensitivity and specificity were calculated and presented. Pred. wild-type, samples predicted to be wild type for POLE/D1 functional mutation; Pred. functional, samples predicted to be harboring POLE/D1 functional mutations. c, ROC curve with AUC and confusion matrix of the trained logistic regression model on the ICGC/CCLE test set. Sensitivity and specificity were calculated and presented. d, ROC curve with AUC and confusion matrix for the MSK-IMPACT training set. Sensitivity and specificity were calculated and presented. e, ROC curve with AUC and confusion matrix for TCGA-IMPACT panel test set. Sensitivity and specificity were calculated and presented. f, Fraction of POLE/D1 VUS samples identified as functional mutation-positive samples by the WES and MSK-IMPACT logistic regression models, in the WES datasets and MSK-IMPACT datasets, accordingly. Functional, POLE/D1 VUS samples were predicted to harbor functional mutations; Passenger, POLE/D1 VUS samples were predicted as only harbored POLE/D1 passenger mutations. g, Association of the POLE/D1 function-associated signature-positive VUS samples with known POLE/D1 functional mutations, mutations that are associated with familial or early onsite tumors, or POLE/D1 mutator alleles in other species; h, Association of functional mutational signatures and SNV burden with the five categories of tumor samples, determined by the known POLE/D1 functional mutation and functional mutational signature status of the samples (Known functional mutation samples with function-associated signatures, N=206; Known functional mutation samples without function-associated signature N=21; VUS samples with function-associated signatures N=85; VUS samples without function-associated signature, N=2522; Wild type N=55630). Known functional mutation samples with function-associated signatures , samples harbored known POLE/D1 functional mutations and were also function-associated signature-positive; Known functional mutation samples without function-associated signature, samples harbored known POLE/D1 functional mutations but were function-associated signature negative; VUS samples with function-associated signatures, samples harbored POLE/D1 VUSes and were positive for the function-associated signatures; VUS samples with function-associated signatures, samples harbored POLE/D1 VUSes and did not show functional mutational signature based on our model; Wild type, POLE/D1 wild type samples. The minima (0% percentile), maxima (100% percentile) were plotted as the whiskers, 25% percentile and 75% percentile were plotted as the bounds of the boxes, medians were plotted as the center bar and means were plotted as red dot. P values (‘Known functional mutation samples with function-associated signatures’ vs ‘VUS samples with function-associated signatures’ P<2.2e-16; ‘VUS samples with function-associated signatures’ vs ‘VUS samples without function-associated signature’ P=0.045; ‘VUS samples with function-associated signatures’ vs ‘Wild type’ P<2.2e-16; ‘Known functional mutation samples with function-associated signatures’ vs ‘VUS samples without function-associated signature’ P<2.2e-16) were generated with two-sided Wilcoxon Rank Sum Tests (n.s., no statistical significance, * P<0.05, ** P<0.01, *** P<0.005). i, Genomic features and mutational signature landscapes of tumor samples harbored known POLE/D1 functional mutations or were predicted to harbor functional mutations from WES and MSK-IMPACT data sets. Each bar represents a tumor sample, proportional contribution of the four POLE/D1 functional SBS signatures were shown. Sample with VUS, tumor samples only harbored POLE/D1 VUS but were predicted as functional samples by the logistic regression models; MSI status, MSI instability status were determined by MSIsensor score (MSI-H, MSIsensor score >=10; MSS/MSI-L, MSIsensor score<10; NA, MSI information not available); Primary site, the primary sites where the tumors were developed.
Figure 5.
Figure 5.. POLE/D1 functional mutation/signature-positive tumors are more immune active and share similar immune features with the baseline mouse PoleP286R tumors.
a, Immune infiltration score and CYT score (log10 transformed) of the POLE/D1 functional mutation/signature-positive tumors (N=60) and POLE/D1 functional mutation/signature-negative tumors (N=560) compared to the FP prediction wild-type samples (N=6) from the TCGA endometrial cohort. P value (Immune score: POLE/D1 functional mutation/signature-positive tumors vs POLE/D1 functional mutation/signature-negative tumors P=5.2e-4; FP prediction wild-type samples vs POLE/D1 functional mutation/signature-negative tumors P=0.26; CYT score: POLE/D1 functional mutation/signature-positive tumors vs POLE/D1 functional mutation/signature-negative tumors P=8.6e-6; FP prediction wild-type tumors vs POLE/D1 functional mutation/signature-negative tumors P=0.53) were generated with two-sided Wilcoxon Rank Sum Tests (n.s., no statistical significance, * P<0.05, ** P<0.01, *** P<0.005). POLE/D1 functional mutation/signature-positive tumors, tumors either harbored known POLE/D1 functional mutations, or only harbored POLE/D1 VUSes but were predicted as function-associated signature-positive based on the functional-signature-based model; POLE/D1 functional mutation/signature-negative tumors, tumors were predicted as wild-type samples by the function-associated signature-based model, regardless of the POLE/D1 mutation status; FP prediction wild-type tumors, POLE/D1 wild type tumors that were predicted as function-associated signature-positive (i.e., false positive) by the function-associated signature-based model. CYT score, cytotoxicity score. The minima (0 percentile), maxima (100% percentile) were plotted as the whiskers, 25% percentile and 75% percentile were plotted as the bounds of the boxes, medians were plotted as the center bar and means were plotted as red dot. b, PCA analysis on the immune features of the tumors from the TCGA-endometrial cohort (POLE/D1 functional mutation/signature-positive tumors N=60, POLE/D1 functional mutation/signature-negative tumors N=520, FP prediction wild-type tumors N=6), P values were calculated with PERMANOVA tests. (n.s., no statistical significance, * P<0.05, ** P<0.01, *** P<0.005) c, Heatmap of the transformed enrichment scores of the immune cell types of the three indicated groups of samples from the TCGA-endometrial cohort. d, Enrichment scores of the immune cell types that are significantly upregulated or down-regulated in the POLE/D1 functional mutation/signature-positive tumors and FP prediction wild-type tumors compared to the POLE/D1 functional mutation/signature-negative tumors (POLE/D1 functional mutation/signature-positive tumors N=60, POLE/D1 functional mutation/signature-negative tumors N=520, FP prediction wild-type tumors N=6; also see Extended data fig. 8a). P values (CD8 Tcm P=4.1e-6; CD8 Tem P=0.024; naïve CD8 T cell P=1.7e-4; B-cell P=0.015; NK cell P=0.021; DC P=0.0077) were generated with two-sided Wilcoxon Rank Sum Tests (n.s., no statistical significance, * P<0.05, ** P<0.01, *** P<0.005). The minima (0 percentile), maxima (100% percentile) were plotted as the whiskers, 25% percentile and 75% percentile were plotted as the bounds of the boxes, medians were plotted as the center bar and means were plotted as red dot. e, Immune cell types consistently altered in the human Functional tumors and the mouse B16F10 PoleP286R baseline tumors when compared to their corresponding control samples. Statistical significances were determined by two tailed student t-tests (P<0.05). f, Richness, and evenness index of the TCR-beta CDR3 repertoires from the POLE/D1 functional mutation/signature-positive tumors (N=59), POLE/D1 functional mutation/signature-negative (N=463), and FP prediction wild-type tumors (N=5) samples of the TCGA-endometrial cohort when TCR-beta CDR3 repertoire data is available. P value (richness P=8.7e-5, evenness P=0.045) were generated with two-sided Wilcoxon Rank Sum Tests (n.s., no statistical significance, * P<0.05, ** P<0.01, *** P<0.005). The minima (0% percentile), maxima (100% percentile) were plotted as the whiskers, 25% percentile and 75% percentile were plotted as the bounds of the boxes, medians were plotted as the center bar and means were plotted as red dot.
Figure 6.
Figure 6.. Patients with POLE/D1 functional mutations/signatures have better response and survival after anti-PD-1/PD-L1 immunotherapy.
a, Kaplan-Meier overall survival probability plot of the patients harboring any type of POLE/D1 mutations versus POLE/D1 wild-type patients. Log-Rank Log-Rank P value and hazard ratio were derived from coxph model with cancer type correction. b, Kaplan-Meier overall survival probability plot of POLE/D1 functional mutation/signature-positive patients versus POLE/D1 wild-type patients in a PD-1/PD-L1 treated MSS/MSI-L patient cohort. Log-Rank Log-Rank P value and hazard ratio shown were calculated from coxph model with cancer type correction. Functional mutations/signatures, patients either harbored known POLE/D1 functional mutations, or only harbored POLE/D1 variants of unknown significance (VUSes) but were predicted as function-associated signature-positive. c, Proportion of the POLE/D1 functional mutation/signature-positive patients deriving clinical benefit from immune checkpoint inhibition in the MSK-IMPACT cohort. PR, partial response; SD, stable disease (>6 months); PD, progressive disease; CR, complete response. d, Proportion of POLE/D1 functional mutation/signature-positive patients deriving clinical responses from immune checkpoint inhibition in different cancer type categories. e, MRI images and SBS signature profile of the tumor from one of the POLE/D1 functional mutation/signature-positive patients that harbors POLEE277Q function-associated signature-positive VUS reached complete response with anti-PD1 therapy. Black, green marker and numbers on the image indicate the location, sizes of the tumor before and after initiation of therapy. f, Comparison of the proportion of clinical beneficial cases of the POLE/D1 functional mutation/signature-positive patients and wild-type patients in pan-cancer and each individual cancer type category. Numbers indicate actual numbers of patients in each category. BLCA, bladder cancer; CRC, colorectal cancer; NSCLC, non-small cell lung cancer; Others, other cancer types with at least one POLE/D1 functional mutation/signature-positive patients combined. P values were derived from Fisher's exact tests. OR, odds ratio from Fisher’s exact t-tests. g, Kaplan-Meier progression free survival probability plot of the POLE/D1 functional mutation/signature-positive patients versus wild-type patients. Log-Rank Log-Rank P value and hazard ratio showed were calculated from the coxph model with cancer type correction. h, Forest plot of the POLE/D1 functional mutations/signatures as a predictive factor in coxph models of progression free survival after immunotherapy with cancer type correction for pan-cancer or each single cancer type category with at least three POLE/D1 functional mutation/signature-positive patients. Number of POLE/D1 functional mutation/signature-positive patients, number of wild-type patients, hazard ratio and p value were shown for each cancer type category in the figure. Horizontal bars represent the 95% confidence interval of the hazard ratio. Error bar centre indicate hazard ratio. Each line represents an individual coxph model on the indicated cancer type category. i, Kaplan-Meier progression free survival plot of the POLE/D1 functional mutation/signature-positive patients by the MSK-IMPACT logistic regression model versus other POLE/D1 functional mutation/signature-negative mutant patients. VUSes without function-associated signature, samples harbored POLE/D1 VUSes, but were predicted as function-associated signature-negative; Log-Rank P value and hazard ratio shown were calculated from coxph model with cancer type correction.
Figure 7.
Figure 7.. POLE/D1 function-associated signatures positive status is an independent predictor that can enrich patients who benefit from immunotherapy in the patient population with POLE/D1 mutation.
a, Comparison of the patient populations selected by different strategies. Known functional mutations, tumors with at least one known POLE/D1 functional mutation determined by the functional list used to build the MSK-IMPACT model; Hypermutated, tumors with at least 50 non-synonymous mutations per MB exome; Exonuclease domain mutations, tumors have at least one POLE/D1 mutation located in the exonuclease domain of POLE or POLD1. Function-associated signatures, i.e., function-associated signature-positive, tumor samples that were predicted to harbor POLE/D1 functional mutations by the MSK-IMPACT logistic regression model. Numbers of patients in each category were shown. b, A multivariable coxph model includes all the above patient selection strategies to compare the predictive capability on patients’ overall survival after ICB (N=2700). Functional mutations/signatures, i.e., POLE/D1 functional mutation/signature-positive patients, patients either harbored known POLE/D1 functional mutations, or only harbored POLE/D1 variants of unknown significance (VUSes) but were predicted as function-associated signature-positive. Hazard ratio and Log-Rank P value are presented. Horizontal bars represent the 95% confidence interval of hazard ratio. Error bar centre indicates hazard ratio. Two-sided tests were performed for statistical significance without multiple comparison adjustment. (n.s., no statistical significance, * P<0.05, ** P<0.01, *** P<0.005) c, Kaplan-Meier overall survival plot of patients harboring POLE/D1 exonuclease domain mutations but are also negative for known functional mutation and function-associated signature, versus the POLE/D1 wild-type patients. Log-Rank P value and hazard ratio shown were calculated from coxph model with cancer type correction. d, Kaplan-Meier progression free survival plot of the two patient groups in c when progression free survival data is available. Log-Rank P value and hazard ratio shown were calculated from coxph model with cancer type correction. e, Kaplan-Meier overall survival plot of the POLE/D1 functional mutation/signature-positive patients whose POLE/D1 mutations are not located in the exonuclease domain, versus the POLE/D1 wild-type patients. Log-Rank P value and hazard ratio shown were calculated from coxph model with cancer type correction. f, Kaplan-Meier progression free survival plot of the two groups of patients in e, when progression free survival data available. Log-Rank P value and hazard ratio shown were calculated from coxph model with cancer type correction. g. Fraction of patients with durable clinical response of the patient groups selected from all the patients with POLE/D1 mutations based on different strategies. h, C-index of the coxph models generated based on different patient selection strategies with cancer type correction on the ICB related overall survival of all the POLE/D1 mutated patients (N=172). P values were calculated from student t-tests of the coxph model based on POLE/D1 functional mutations/signatures, against other models based on other strategies. i, Multi-variable coxph test of ICB overall survival for POLE/D1 functional mutations/signatures and TMB with cancer type correction (N=2700). Only POLE/D1 functional mutations/signatures and TMB are shown in the forest plot. * log-rank P<0.05. *** log-rank P<0.005. Error bar indicating 95% CI of the Hazard ratio. j, Kaplan-Meier overall survival plot of the POLE/D1 functional mutation/signature-positive patients versus the POLE/D1 wild-type patients in the ICB treated patient cohort with high TMB (TMB>=10). Log-Rank P value and hazard ratio shown were calculated from the coxph model with cancer type correction.
Figure 8.
Figure 8.. Trinucleotide context spectrum of SBS mutational signatures and immunogenicity of neoantigens.
a. Total number of SNVs per sample that generate at least one neo-peptide binding to at least one HLA-I allele of the same patient from the TCGA cohort, when HLA and neoantigen data is available (POLE/D1 functional mutation/signature-positive N=82, POLE/D1 functional mutation/signature-negative N=7003, FP prediction wild-type samples N=85). POLE/D1 functional mutation/signature-positive, samples either harbored known POLE/D1 functional mutations, or only harbored POLE/D1 variants of unknown significance (VUSes) but were predicted as functional samples based on the logistic regression model; POLE/D1 functional mutation/signature-negative, samples didn’t harbor any known POLE/D1 functional mutation, and were predicted as function-associated signature-negative by the logistic regression model, regardless of the POLE/D1 mutation status; FP prediction wild-type samples, wild type samples that were predicted as POLE/D1 function-associated signature-positive (i.e., false positive). P values (POLE/D1 function-associated signature-positive vs POLE/D1 function-associated signature-negative P<2.2e-16; FP prediction wild-type vs POLE/D1 function-associated signature-negative P=0.037; POLE/D1 function-associated signature-positive vs FP prediction wild-type P<2.2e-16) were generated with two-sided Wilcoxon Rank Sum Tests (n.s., no statistical significance, * P<0.05, ** P<0.01, *** P<0.005). The minima (0% percentile), maxima (100% percentile) were plotted as the whiskers, 25% percentile and 75% percentile were plotted as the bounds of the boxes, medians were plotted as the center bar and means were plotted as center black dot. b. Fraction of SNVs per sample that generate at least one neo-peptide bind to at least one HLA-I allele of the same patient from the TCGA cohort, when HLA and neo-antigen data is available (POLE/D1 functional mutation/signature-positive N=82, POLE/D1 functional mutation/signature-negative N=7003, FP prediction wild-type N=85). P values ( POLE/D1 functional mutation/signature-positive vs POLE/D1 functional mutation/signature-negative P=0.13; FP prediction wild-type vs POLE/D1 functional mutation/signature-negative P=0.85; POLE/D1 functional mutation/signature-positive vs FP prediction wild-type P<2.2e-16) were generated with two-sided Wilcoxon Rank Sum Tests (n.s., no statistical significance, * P<0.05, ** P<0.01, *** P<0.005). The minima (0% percentile), maxima (100% percentile) were plotted as the whiskers, 25% percentile and 75% percentile were plotted as the bounds of the boxes, medians were plotted as the center bar and means were plotted as center black dot. c, Sample-level average Δ hydrophobicity of neo-peptide-associated amino acid (AA) alterations in three sample groups from the TCGA cohort (POLE/D1 functional mutation/signature-positive N=82, POLE/D1 functional mutation/signature-negative N=7003, FP prediction wild-type N=85). Bars indicate medians and dots indicate mean values. P values (POLE/D1 functional mutation/signature-positive vs POLE/D1 functional mutation/signature-negative P=0.0075; FP prediction wild-type vs POLE/D1 functional mutation/signature-negative P=0.93; POLE/D1 functional mutation/signature-negative vs FP prediction wild-type P=0.26) were generated with two-sided Wilcoxon Rank Sum Tests (n.s., no statistical significance, * P<0.05, ** P<0.01). The minima (0% percentile), maxima (100% percentile) were plotted as the whiskers, 25% percentile and 75% percentile were plotted as the bounds of the boxes, medians were plotted as the center bar and means were plotted as center black dot. d, Per peptide-residue-position Δhydrophobicity of the AA alterations in the POLE/D1 functional mutation/signature-positive samples (N=82) versus the POLE/D1 functional mutation/signature-negative (N=7003) samples described in (c). ‘*’ symbols indicate the residues at which Δ hydrophobicity of the AA alterations in the functional samples are significantly (P<0.05) higher than the other groups, as determined by two independent two-sided Wilcoxon Rank Sum Tests. Data are presented as mean values ± s.e.m. e, Per peptide-residue-position Δhydrophobicity of the AA alterations in the FP prediction wild-type (N=85) samples versus the POLE/D1 functional mutation/signature-negative (N=7003) samples described in (c). Data are presented as mean values ± s.e.m. g, Observed mean Δhydrophobicity of the neo-peptide-associated AA alterations for each SBS mutational signature in the TCGA cohort. Positive values indicated mutational signatures that are more likely associated with AA alterations generating residues with higher hydrophobicity compared to the original residues. POLE/D1 signatures, POLE/D1 function-associated signatures; Other signatures, signatures not associated to POLE/D1 functional mutations. h, Observed mean Δpolarity of neo-peptide-associated AA alterations for each SBS mutational signature in the TCGA cohort. Positive values indicated mutational signatures that are more likely associated with AA alterations generating residues with higher polarity compared to the original residues.

References

    1. Borcoman E et al. Novel patterns of response under immunotherapy. Ann Oncol 30, 385–396 (2019). - PubMed
    1. Hegde PS & Chen DS Top 10 Challenges in Cancer Immunotherapy. Immunity 52, 17–35 (2020). - PubMed
    1. Mouw KW, Goldberg MS, Konstantinopoulos PA & D'Andrea AD DNA Damage and Repair Biomarkers of Immunotherapy Response. Cancer Discov 7, 675–693 (2017). - PMC - PubMed
    1. Bever KM & Le DT DNA repair defects and implications for immunotherapy. J Clin Invest 128, 4236–4242 (2018). - PMC - PubMed
    1. Hsiehchen D et al. DNA Repair Gene Mutations as Predictors of Immune Checkpoint Inhibitor Response beyond Tumor Mutation Burden. Cell Rep Med 1(2020). - PMC - PubMed

Methods-only References

    1. Samstein RM et al. Mutations in BRCA1 and BRCA2 differentially affect the tumor microenvironment and response to checkpoint blockade immunotherapy. Nature Cancer (2020). - PMC - PubMed
    1. Mandal R et al. Genetic diversity of tumors with mismatch repair deficiency influences anti-PD-1 immunotherapy response. Science 364, 485–491 (2019). - PMC - PubMed
    1. Campbell BB et al. Comprehensive Analysis of Hypermutation in Human Cancer. Cell 171, 1042–1056 e10 (2017). - PMC - PubMed
    1. Cong L et al. Multiplex genome engineering using CRISPR/Cas systems. Science 339, 819–23 (2013). - PMC - PubMed
    1. Aran D, Hu Z & Butte AJ xCell: digitally portraying the tissue cellular heterogeneity landscape. Genome Biol 18, 220 (2017). - PMC - PubMed

Publication types