. 2022 Jul;54(7):940-949.
doi: 10.1038/s41588-022-01102-2. Epub 2022 Jul 11.

A sequence-based global map of regulatory activity for deciphering human genetics

Affiliations

A sequence-based global map of regulatory activity for deciphering human genetics

Kathleen M Chen et al. Nat Genet. 2022 Jul.

Abstract

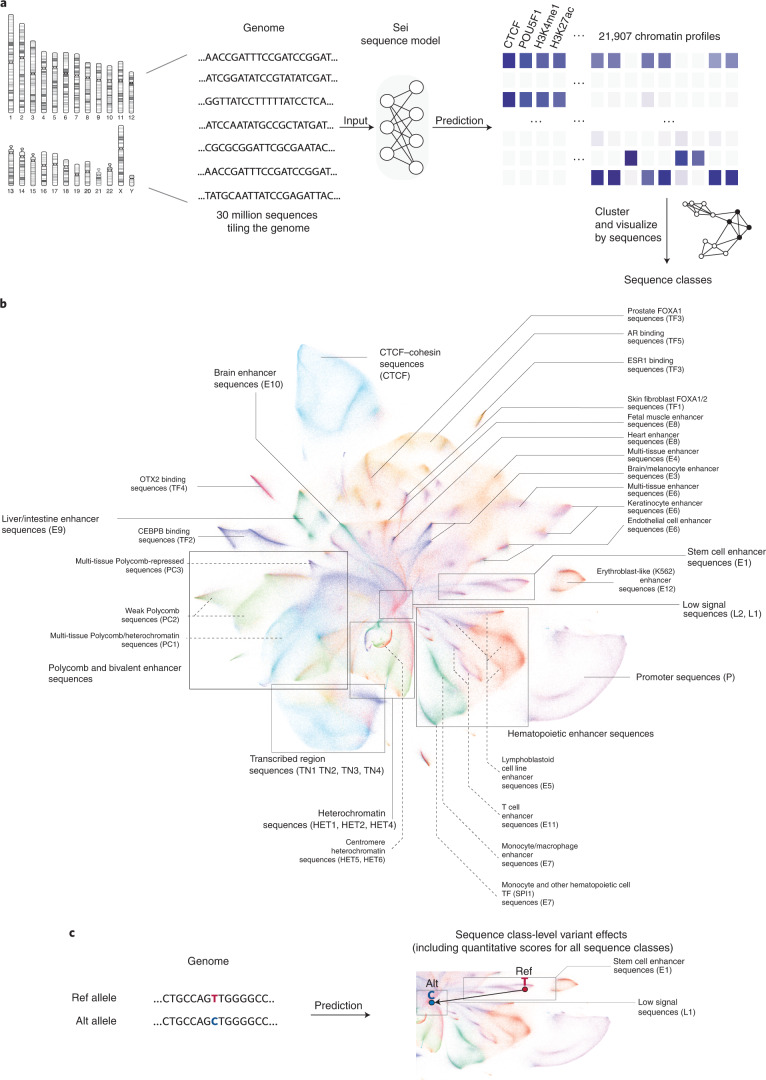
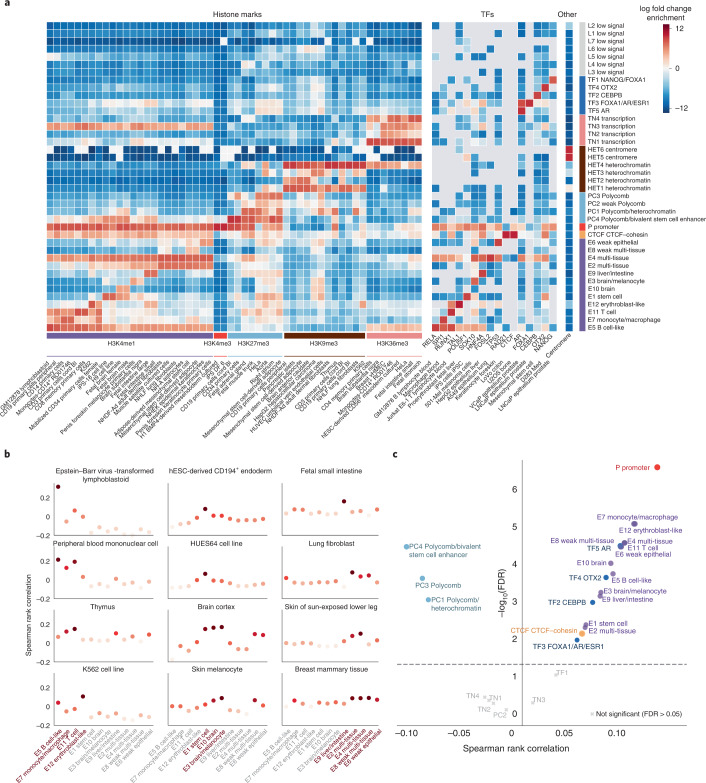
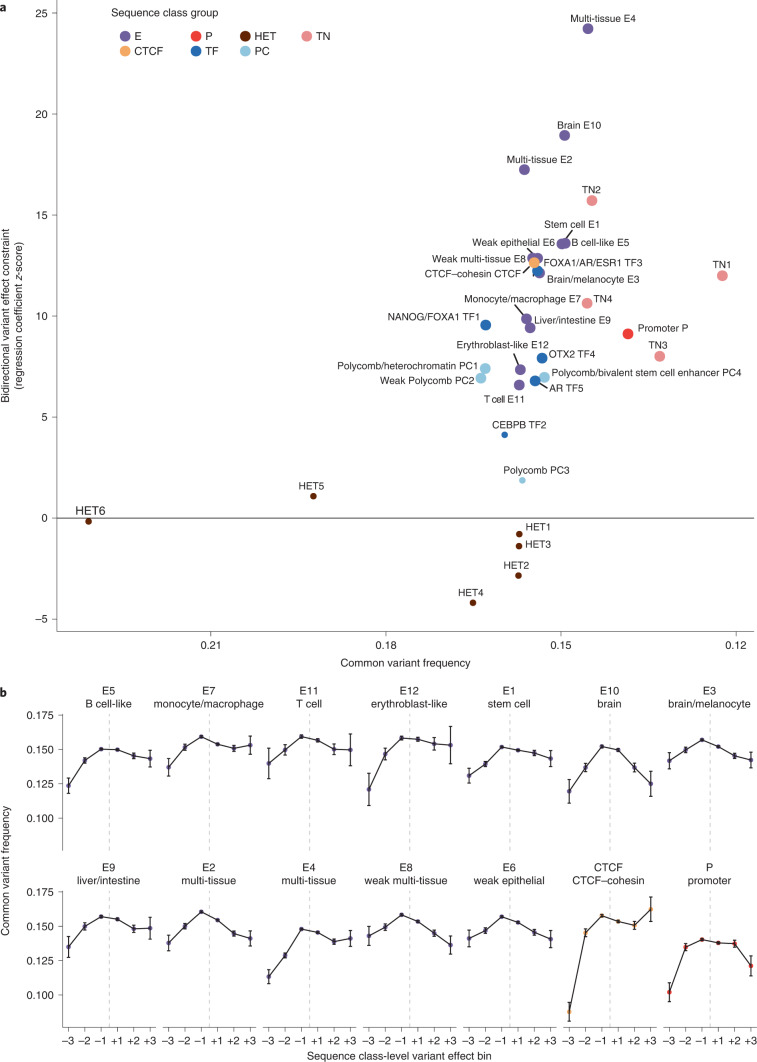
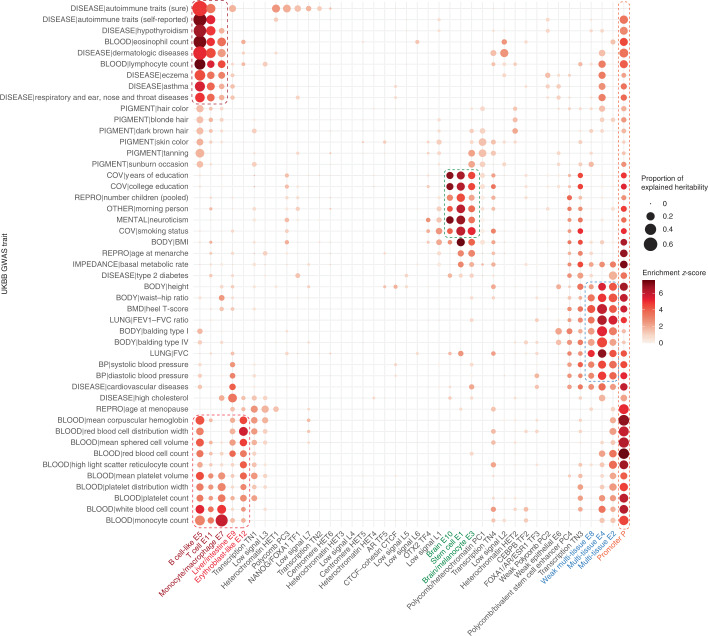
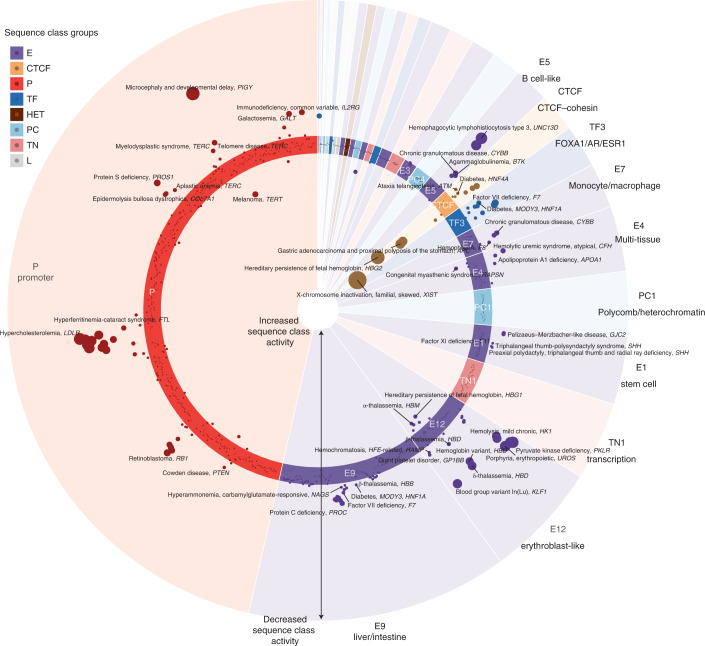
Epigenomic profiling has enabled large-scale identification of regulatory elements, yet we still lack a systematic mapping from any sequence or variant to regulatory activities. We address this challenge with Sei, a framework for integrating human genetics data with sequence information to discover the regulatory basis of traits and diseases. Sei learns a vocabulary of regulatory activities, called sequence classes, using a deep learning model that predicts 21,907 chromatin profiles across >1,300 cell lines and tissues. Sequence classes provide a global classification and quantification of sequence and variant effects based on diverse regulatory activities, such as cell type-specific enhancer functions. These predictions are supported by tissue-specific expression, expression quantitative trait loci and evolutionary constraint data. Furthermore, sequence classes enable characterization of the tissue-specific, regulatory architecture of complex traits and generate mechanistic hypotheses for individual regulatory pathogenic mutations. We provide Sei as a resource to elucidate the regulatory basis of human health and disease.


Conflict of interest statement

The authors declare no competing interests.

Figures

Fig. 1
Fig. 1. Mapping the global regulatory landscape of genomic sequences.
a, Overview of the Sei framework for systematic prediction of sequence regulatory activities. Sequence classes were extracted from the predicted chromatin profiles of 30 million sequences evenly tiling the genome. The predictions were made by Sei, a new deep convolutional network sequence model trained on 21,907 chromatin profiles. Specifically, classes are identified by applying Louvain community detection to the nearest neighbor graph of 180 principal components extracted from the predictions data. b, Visualizing the global regulatory landscape of human genome sequences discovered by this approach with UMAP. Major sequence classes include cell type-specific enhancer classes, CTCF–cohesin, promoter, TF-specific and heterochromatin/centromere classes. AR, androgen receptor. c, This framework was further applied to predict sequence class-level genome variant effects, quantified by changes in sequence class scores.
Fig. 2
Fig. 2. Sequence classes predict cell type-specific regulatory activities and directional, expression-altering variant effects.
a, Sequence class-specific enrichment of histone marks, TFs and repeat annotations; log fold change enrichment over genome-average background is shown in the heatmap. No overlap is indicated by the gray color in the heatmap. The top 1–2 histone mark and TF annotation enrichments were selected for each sequence class. hESC, human embryonic stem cell. b, Enhancer sequence classes near TSS were correlated with cell type-specific gene expression in the applicable tissue or cell types (Methods). The y axis shows the Spearman rank correlation between the proportion of each sequence class annotation within 10 kb of TSS and the tissue-specific differential gene expression (fold over tissue average). c, Regulatory sequence class-level variant effects are predictive of directional GTEx variant gene expression effects. The x axis shows Spearman correlations between the predicted sequence-class-level variant effects and the signed GTEx variant effect sizes (slopes) for variants with strong predicted effects near the TSS (Methods); the y axis shows the corresponding −log10 P values. All colored dots are above the Benjamini–Hochberg false discovery rate (FDR) <0.05 threshold.
Fig. 3
Fig. 3. Variants with strong regulatory sequence class effects show negative selection signatures.
a, Scatter plot for AF-based analysis of each sequence class. The x axis shows 1 − common variant frequency (AF >0.01) across all 1000 Genomes variants per sequence class; the y axis shows the bidirectional variant effect constraint z-score, which was computed based on logistic regressions predicting a common variant (AF >0.01) from the sequence class-level variant effect score for both positive and negative effects (Methods). Sequence classes with significant (Benjamini–Hochberg FDR <0.05) bidirectional variant effect constraint are indicated with larger dots. L sequence classes are excluded due to lack of interpretation for their sequence class-level variant effect scores. b, Comparison of common variant frequencies for 1000 Genomes variants (n = 81,501,608) assigned to different sequence classes and variant effect bins. The common variant threshold is >0.01 AF across the 1000 Genomes population (n = 12,803,919). The error bars show ±1 s.e. and the center of the error bars represents the mean. The sequence class-level variant effects are assigned to six bins (+3, top 1% positive; +2, top 1–10% positive; +1, top 10–100% positive; −1, top 10–100% negative; −2, top 1–10% negative; −3, top 1% negative).
Fig. 4
Fig. 4. Sequence class-based partitioning of GWAS heritability shows trait associations with tissue-specific regulation.
Partitioned genome-wide heritability in the UKBB GWAS with all 40 sequence classes. The size of the dot indicates the proportion of heritability estimated from LDSR, which is conservatively estimated as 1 s.e. below the estimated heritability proportion (bounded by 0). The color of the dot indicates the significance z-score of the fold enrichment of heritability relative to the proportion of all SNPs assigned to the sequence class (bounded by 0). The colored boxes indicate traits associated with blood (red), brain (green), multiple tissues (blue) and promoters (orange). BMI, body mass index; FEV1, forced expiratory volume in one second.
Fig. 5
Fig. 5. Disease regulatory mutations are predicted to disrupt promoter, CTCF and tissue-specific enhancer sequence classes.
Sequence class-level mutation effects of pathogenic noncoding HGMD mutations were plotted. A polar coordinate system was used, where the radial coordinate indicates the sequence class-level effects. Each dot represents a mutation and mutations inside the circle are predicted to have positive effects (increased activity of sequence class); mutations outside the circle are predicted to have negative effects (decreased activity of sequence class). Dot size indicates the absolute value of the effect. Mutations were assigned to sequence classes based on their sequences and predicted effects (Methods). Within each sequence class, mutations were ordered by chromosomal coordinates. The associated disease and gene name were annotated for each mutation and only the strongest mutation was annotated if there were multiple mutations associated with the same disease, gene and sequence class.

Comment in

References

    1. Edwards SL, Beesley J, French JD, Dunning M. Beyond GWASs: illuminating the dark road from association to function. Am. J. Hum. Genet. 2013;93:779–797. doi: 10.1016/j.ajhg.2013.10.012. - DOI - PMC - PubMed
    1. Dunham I, et al. An integrated encyclopedia of DNA elements in the human genome. Nature. 2012;489:57–74. doi: 10.1038/nature11247. - DOI - PMC - PubMed
    1. Kundaje A, et al. Integrative analysis of 111 reference human epigenomes. Nature. 2015;518:317–330. doi: 10.1038/nature14248. - DOI - PMC - PubMed
    1. Zheng R, et al. Cistrome Data Browser: expanded datasets and new tools for gene regulatory analysis. Nucleic Acids Res. 2019;47:D729–D735. doi: 10.1093/nar/gky1094. - DOI - PMC - PubMed
    1. Alipanahi B, Delong A, Weirauch MT, Frey BJ. Predicting the sequence specificities of DNA- and RNA-binding proteins by deep learning. Nat. Biotechnol. 2015;33:831–838. doi: 10.1038/nbt.3300. - DOI - PubMed

Publication types