. 2022 Jul;54(7):1026-1036.
doi: 10.1038/s41588-022-01117-9. Epub 2022 Jul 11.

In vivo dissection of a clustered-CTCF domain boundary reveals developmental principles of regulatory insulation

Affiliations

In vivo dissection of a clustered-CTCF domain boundary reveals developmental principles of regulatory insulation

Chiara Anania et al. Nat Genet. 2022 Jul.

Abstract

Vertebrate genomes organize into topologically associating domains, delimited by boundaries that insulate regulatory elements from nontarget genes. However, how boundary function is established is not well understood. Here, we combine genome-wide analyses and transgenic mouse assays to dissect the regulatory logic of clustered-CCCTC-binding factor (CTCF) boundaries in vivo, interrogating their function at multiple levels: chromatin interactions, transcription and phenotypes. Individual CTCF binding site (CBS) deletions revealed that the characteristics of specific sites can outweigh other factors such as CBS number and orientation. Combined deletions demonstrated that CBSs cooperate redundantly and provide boundary robustness. We show that divergent CBS signatures are not strictly required for effective insulation and that chromatin loops formed by nonconvergently oriented sites could be mediated by a loop interference mechanism. Further, we observe that insulation strength constitutes a quantitative modulator of gene expression and phenotypes. Our results highlight the modular nature of boundaries and their control over developmental processes.


Conflict of interest statement

The authors declare no competing interests.

Figures

Fig. 1
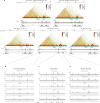
Fig. 1. Impact of individual CBS deletions on boundary function.
a, cHi-C maps from E11.5 distal limbs from DelBs mutants at 10-kb resolution. Data were mapped on a custom genome containing the DelBs deletion (n = 1 with an internal control comparing 6 different experiments; Methods). The red rectangle marks the EP boundary region. Insets represent a magnification (5-kb resolution) of the centromeric (left) and telomeric (right) loops highlighted by brackets on the map. Cen, Centromeric; Tel, Telomeric. Arrowheads represent reverse- (light blue) and forward- (orange) oriented CBSs. Below, Lac-Z staining (left) and WISH (right) of E11.5 mouse forelimbs show activation pattern of Epha4 enhancers and Pax3 expression, respectively. b, CTCF ChIP–seq track from E11.5 mouse distal limbs. Schematic shows CBS orientation. c, Insulation score values. The gray dot represents the local minima of the insulation score at the EP boundary. BS, boundary score. d, Relationship between BS and the number of CBSs (data from ref. ). The boxes in the boxplots indicate the median and the first and third quartiles (Q1 and Q3). Whiskers extend to the last observation within 1.5 times the interquartile range below and above Q1 and Q3, respectively. The rest of the observations, including maxima and minima, are shown as outliers. N = 8,127 insulation minima found in mESC Hi-C matrices. e, WISH shows Pax3 expression in E11.5 forelimbs from CBS mutants. Note Pax3 misexpression on the distal anterior region in ΔR1, ΔF1 and ΔF2 mutants (white arrowheads). Scale bar, 250 μm. f, Pax3 qPCR analysis in E11.5 limb buds from CBS mutants. Bars represent the mean and white dots represent individual replicates. Values were normalized against DelBs mutant (ΔΔCt) (two-sided t-test *P ≤ 0.05; NS, nonsignificant; P values from left to right: DelBs versus ΔR1: 0.02; DelBs versus ΔR2: 0.11; DelBs versus ΔF1: 0.02; DelBs versus ΔR3: 0.23; DelBs versus ΔF2: 0.02; DelBs versus ΔR4: 0.73). Cen, Centromeric; Tel, Telomeric.
Fig. 2
Fig. 2. Impact of combined CBS deletions on boundary function.
a, WISH shows Pax3 expression in E11.5 forelimbs from CBS mutants. Arrowheads represent reverse- (light blue) and forward- (orange) oriented CBSs. Crosses indicate deleted CBSs. Note increased Pax3 misexpression towards the posterior regions of the limb. Scale bar, 250 μm. b, Pax3 qPCR analysis in E11.5 limb buds from CBS mutants. Bars represent the mean and white dots represent individual replicates. Values were normalized against DelBs mutant (ΔΔCt) (**t-test **P ≤ 0.01; ΔR1 + F2 versus ΔF-all: 0.008). c, cHi-C maps from E11.5 mutant distal limbs at 10-kb resolution (top). Data were mapped on a custom genome containing the DelBs deletion (n = 1 with an internal control comparing 6 different experiments; Methods). Insets represent a magnification (5-kb resolution) of the centromeric (left) and telomeric (right) loops highlighted by brackets on the map. Gained or lost chromatin loops are represented by full or empty dots, respectively. Subtraction maps (bottom) showing gain (red) or loss (blue) of interactions in mutants compared with DelBs. d, Insulation score values. Lines represent indicated mutants. Dots represent the local minima of the insulation score at the EP boundary for each mutant. e, Virtual 4C profiles for the genomic region displayed in c (viewpoint in Pax3). The light-gray rectangle highlights the Epha4 enhancer region. Note increased interactions between the Pax3 promoter and the Epha4 enhancer in ΔR1 + F2 and ΔF-all (purple and orange) compared with DelBs mutants (gray).
Fig. 3
Fig. 3. Formation of chromatin loops by nonconvergently oriented CBSs.
a, Schematic of a convergent loop that indirectly generates a nonconvergent loop in the opposite direction. b, Percentage of loop anchors establishing bidirectional loops (n = 12,635 loops from mESCs from ref. ). Anchor categories: convergent-only (only CBSs oriented in the same direction as their anchored loops, n = 7,769), nonconvergent (anchor loops in a direction for which they lack a directional CBS, n = 960) and no-CTCF (no CBS, n = 3,906). c, Loop strengths in pairs of convergent/nonconvergent loops classified into Non-conv.-associated (nonconvergent loop sharing the nonconvergent anchor with a convergent loop in the opposite direction, n = 322) and Conv.-associated (convergent loop sharing one anchor with a nonconvergent loop in the opposite direction, n = 496). Boxplots defined as in Fig. 1c. Two-sided Benjamini–Hochberg-corrected Mann–Whitney U-test P = 6.2 × 10−6. d, Aggregated loop signal for categories in c. Arrows represent CBS orientation. e, Pax3 WISH in E11.5 forelimbs from CBS mutants. Arrowheads represent reverse- (blue) and forward- (orange) oriented CBSs. Crosses indicate deleted CBSs. Note the positive correlation between expanded Pax3 misexpression and increased number of deleted CBSs. Scale bar, 250 μm. f, Pax3 qPCR analysis in E11.5 limbs from CBS mutants. Bars represent mean and dots individual replicates. Values were normalized against DelBs mutant (ΔΔCt). Note the positive correlation of Pax3 misexpression with the increase in deleted CBSs (Pearson correlation significantly > 0; ***P ≤ 0,001). g, cHi-C maps from E11.5 mutant distal limbs at 10-kb resolution (top). Data were mapped on a custom genome containing the DelBs deletion (n = 1 with an internal control comparing 6 different experiments; Methods). Insets represent a magnification (5-kb resolution) of the centromeric (left) and telomeric (right) loops highlighted by brackets on the map. Gained or lost chromatin loops are represented by full or empty dots. Subtraction maps (bottom) showing gain (red) or loss (blue) of interactions in mutants compared with DelBs. h, Insulation score values. Dots represent the local minima of the insulation score at the EP boundary for each mutant. i, Virtual 4C profiles for the region in g (viewpoint in Pax3). The gray rectangle highlights Epha4 enhancers. Note increased interactions between the Pax3 promoter and the Epha4 enhancers in ΔR-all compared with DelBs.
Fig. 4
Fig. 4. Nondivergent boundary signatures and effects of surrounding genomic context.
a, Relation between BSs and the number of CBSs for divergent and nondivergent boundaries in mESC Hi-C data. Boxplots defined as in Fig. 1c. b, WISH shows Pax3 expression in E11.5 forelimbs from CBS mutants. Arrowheads represent reverse- (light blue) and forward- (orange) oriented CBSs. Crosses indicate deleted CBSs. Light-gray rectangle marks inverted region. Note similar Pax3 misexpression pattern between ΔF-all-Inv and ΔF-all mutants. Scale bar, 500 μm. c, Pax3 qPCR analysis in E11.5 limb buds from CBS mutants. Bars represent the mean and white dots represent individual replicates. Values were normalized against DelBs mutant (ΔΔCt) (two-sided t-test P value). d, cHi-C maps from E11.5 mutant distal limbs at 10-kb resolution (top). Data mapped on custom genome containing the DelBs deletion and the inverted EP boundary (n = 1 with an internal control comparing 6 different experiments; Methods). Insets represent a magnification (5-kb resolution) of the centromeric (left) and telomeric (right) loops highlighted by brackets on the map. Gained or lost chromatin loops are represented by full or empty dots, respectively. Subtraction maps (bottom) showing gain (red) or loss (blue) of interactions in mutants compared with DelBs. e, Insulation score values. Lines represent mutants. Dots represent the local minima of the insulation score at the EP boundary for each mutant. f, Virtual 4C profiles for the genomic region displayed in d (viewpoint in Pax3). Light-gray rectangle highlights Epha4 enhancer region. Note similar interaction profile between ΔF-all-Inv (yellow) and ΔF-all mutants (orange).
Fig. 5
Fig. 5. Contribution of CTCF binding to the insulation function of the EP boundary.
a, WISH shows Pax3 expression in E11.5 forelimbs from CBS mutants. Arrowheads represent reverse- (light blue) and forward- (orange) oriented CBSs. Crosses indicate deleted CBSs and the gray rectangle represents the deleted region. Note the similarities in expression pattern between mutants. Scale bar, 250 μm. b, Pax3 qPCR analysis in E11.5 limb buds from CBS mutants. Bars represent the mean and white dots represent individual replicates. Values were normalized against DelBs mutants (ΔΔCt) (*two-sided t-test P ≤ 0.05, ΔALL versus DelB: 0.03). c, cHi-C maps from E11.5 mutant distal limbs at 10-kb resolution (top). Data mapped on custom genome containing the DelBs deletion (n = 1 with an internal control comparing 6 different experiments; Methods). Insets represent a magnification (5-kb resolution) of the centromeric (left) and telomeric (right) loops highlighted by brackets on the map. Gained or lost chromatin loops represented by full or empty dots, respectively. Subtraction maps (bottom) showing gain (red) or loss (blue) of interactions in mutants compared with DelBs (left) and DelB (right). d, Insulation score values. Lines represent mutants. Dots represent the local minima of the insulation score at the EP boundary for each mutant. e, Virtual 4C profiles for the genomic region displayed in c (viewpoint in Pax3). Light-gray rectangle highlights Epha4 enhancer region.
Fig. 6
Fig. 6. Boundary strength modulates developmental phenotypes.
a, Skeletal staining of forelimbs from E17.5 mutant and control fetuses. White arrowheads indicate reduced index finger lengths. Black bracket shows the region of the finger measured for the quantification. Finger length correlates negatively with increased Pax3 misexpression. Scale bar, 500 μm. b, Index lengths relative to ring finger lengths in E17.5 mouse forelimbs. Bars represent the mean and white dots represent individual replicates. Values were normalized on control (CTRL) animals (two-sided t-test **P ≤ 0.01; two-sided t-test ***P ≤ 0.001; ΔR1 + F2 versus CTRL: 0.007; ΔF-all versus CTRL: 0.0002). c, Correlation between the number of remaining CBSs at the EP boundary and the levels of Pax3 expression in the different mutants described in this study. Pearson regression lines are shown together with R2 values, both for the whole collection of mutants (black) and discarding combined CBS deletions involving CBSs with forward orientation (turquoise). d, Correlation and R2 between BSs and the brachydactyly phenotype penetrance measured as the index to ring finger length ratio for controls, ΔR1 + F2 and ΔF-all mutants. The color of the dots represents the level of Pax3 limb misexpression as measured by qPCR. e, Model for boundary insulation as a quantitative modulator of gene expression and developmental phenotypes. Left, a strong boundary (B) efficiently insulates gene A from the enhancers located in the adjacent TAD (E). The boundary shows a cluster of CBSs with different orientations represented with arrowheads. The colored arrow represents a CBS with prominent contribution to boundary function. Middle, the absence of specific CBSs results in a weakened boundary, moderate gene misexpression (limb, indicated in yellow) and mild phenotypes (reduced digits, indicated in red and pointed out by white arrowhead). Right, the absence of the boundary causes a fusion of TADs, strong gene misexpression and strong phenotypes.
Extended Data Fig. 1
Extended Data Fig. 1. Structural and molecular comparison between Delbs and DelB mutants.
a. Schematic shows Epha4 enhancers (in dark gray), Epha4 gene (in pink), Pax3 gene (in purple), EP boundary (in black) and genomic rearrangements in the DelBs and Delb mutants (light gray rectangles). b-d. Capture Hi-C (cHi-C) maps in E11.5 limbs in WT (B) DelBs (C) and DelB (D) mutants (data from). Genomic coordinates in C and D correspond to custom DelBs and DelB genomes for the captured region, respectively. Pax3 WISH (right panel). Note how the presence of the EP boundary is sufficient to block the functional interaction between the Epha4 enhancers and the Pax3 gene, thus preventing its misexpression. Cen, centromeric. Tel, telomeric. d-Limbs, distal limbs. Scale bars, 250 μm.
Extended Data Fig. 2
Extended Data Fig. 2. Epha4-Pax3 (EP) boundary is a constitutive boundary with stable binding of divergently oriented CTCF.
a. Hi-C maps at 25 kb resolution and CTCF ChIP-seq tracks around the EP boundary locus from 5 different sources are shown. CTCF motifs inside CTCF peaks in a forward (F) or reverse (R) orientation are depicted below the ChIP-seq track in red and blue respectively. Motifs were calculated using FIMO (see methods). The first two datasets are proximal and distal embryonic forelimbs respectively. The other three datasets correspond to the high-resolution datasets in mESC, neural progenitor cells and cortical neurons from. b–d. Close-ups of the corresponding CTCF ChIP-seq experiments in the centromeric (Cen), Epha4-Pax3 (EP) and telomeric (Tel) boundaries respectively.
Extended Data Fig. 3
Extended Data Fig. 3. Epigenetic landscape at the Epha4-Pax3 locus.
a. Genome browser tracks showing CTCF and RAD21 ChIP-seq from E11.5 wild-type distal limbs (dLs), and H3K4me3, H3K27Ac, H3K4me1 ChIP-seq and RNA-seq of E11.5 wild-type mouse forelimbs (FL) (data from). Note how the EP boundary is occupied by CTCF and RAD21, but shows no presence of the other histone marks nor of active transcription. EP boundary is indicated by the gray box. Light blue and orange arrowheads represent reverse (R) and forward (F) oriented CBS, respectively.
Extended Data Fig. 4
Extended Data Fig. 4. Nonconvergent centromeric loops mediated by the F1 and F2 CBS.
a. Schematic of the 3D configuration of the locus. The Epha4 TAD (left), formed by the centromeric loop (cen), and the Pax3 TAD, formed by the telomeric loop (tel), are both highlighted by the dashed squares. The centromeric and telomeric loops are anchored on one side by the EP boundary, and on the other side by the centromeric and telomeric boundaries, respectively. In the dashed square, on top, is highlighted a meta-TAD loop, anchored by the centromeric and telomeric boundaries. The boundaries are composed of clusters of CBS, depicted by orange and blue arrowheads (forward and reverse oriented, respectively. b. Close-up of the cHi-C interaction matrices showing the centromeric, telomeric and meta-TAD loops established by the remaining CBS of the EP boundary and the centromeric and telomeric counterparts, in the different mutants. Below and beside each close-up, RAD21 ChIP-seq tracks for each boundary involved in the loop. Deleted CBS are indicated in gray. The coordinates shown are 4.55 Mb to 4.75 Mb for the centromeric loops and 5.8 Mb to 6.1 Mb for the telomeric. Genomic coordinates correspond to a custom DelBs genome for the captured region.
Extended Data Fig. 5
Extended Data Fig. 5. RAD21 ChIP-seq in CBS mouse mutants.
a. RAD21 ChIP-seq experiments performed in distal limbs (dLs) of E11.5 mouse mutants. ChIP-seq tracks show absence of RAD21 occupancy at the deleted CBS. The locations of the wild-type CBS are depicted with orange and blue arrowheads (forwards and reverse, respectively).
Extended Data Fig. 6
Extended Data Fig. 6. Paired convergent/nonconvergent loops display longer distances between anchors and more association to TAD-corner loops than unidirectional convergent loops.
a. Schematic (above) and loop aggregate plots (below) for all possible loop categories depending on the anchors: convergent (conv.) and nonconvergent (non-conv.). Convergent loops can belong to the conv. associated if they share an anchor with a nonconvergent loop in the opposite direction (n = 498). If not, they can be either single-sided (if both their anchors establish loops in a single orientation, n = 3656) or double-sided (n = 1061). Nonconvergent loops are further subdivided in non-conv. associated if they share an anchor with a convergent loop in the opposite direction (n = 322) or simply non-conv if they do not (n = 541). Non-conv. associated and conv. associated loops are depicted in red because these categories associate to each other. b. Boxplots show the loop strength for the loop categories described in A. The boxes in the boxplots indicate the median and the first and third quartiles (Q1 and Q3). Whiskers extend to the last observation within 1.5 times the interquartile range below and above Q1 and Q3 respectively. The rest of observations, including maxima and minima, are shown as outliers. Significant two-sided and Benjamini-Hochberg corrected Mann-Whitney U p-values are shown in the appropriate comparisons between conv. associated loops and the rest of categories. c. Barplots show the percentage of loops associated with putative TAD-corner loops for each of the categories shown in A and B. Significant differences between convergent associated loops and the rest of categories are highlighted with Benjamini-Hochberg corrected pairwise χ2 p-values when appropriate. d. Left: cumulative distribution of loop distances in the previous categories of loops. Right: Benjamini-Hochberg corrected two-sided Mann-Whitney U p-values are shown.
Extended Data Fig. 7
Extended Data Fig. 7. Loop anchors with strong single-oriented CTCF binding can constitute the source of weaker loops in the nonconvergent direction.
a-c. Three different examples of developmental gene loci with loop anchors that display unidirectional CBS and are engaged in both convergent and nonconvergent loops. Hi-C interaction matrices and CTCF ChIP-seqs are from the mESC dataset in. CBS orientations are displayed in red and blue for positive and negative strands respectively and were calculated using FIMO (see methods). Dark red and dark blue arrowheads indicate convergent and associated nonconvergent loops respectively. Insulation scores, boundaries and boundary scores were calculated with FAN-C (see methods). Black boundary bars depict boundaries that do not contain divergent CBS pairs in their vicinity.
Extended Data Fig. 8
Extended Data Fig. 8. TAD fusion in R3-only mutants.
a. cHi-C maps from E11.5 mutant distal limbs at 10 kb resolution (top). Data mapped on custom genome containing the DelBs deletion. Insets represent a magnification (5 kb resolution) of the centromeric (left) and telomeric (right) loops. Highlighted by brackets on the map. Lost chromatin loops represented by empty dots. Subtraction maps (bottom) showing gain (red) or loss (blue) of interactions in mutants compared to DelBs. b. Insulation score values. Lines represent mutants. Dots represent the local minima of the insulation score at EP boundary for each mutant, also measured as boundary score (BS). c. Virtual 4C profiles with Pax3 promoter as a viewpoint for the genomic region displayed in panel A. Light gray rectangle highlights Epha4 enhancer region. Note increased interactions between Pax3 promoter and Epha4 enhancer in R3-only (blue) compared to DelBs mutant (gray). d. Pax3 qPCR analysis in E11.5 limb buds from CBS mutants. Bars represent the mean and white dots represent individual replicates. Values normalized against DelBs mutant (ΔΔCt). Note no difference in Pax3 misexpression between R3-only and ΔALL (two-sided T-test p-value ns: non significant).
Extended Data Fig. 9
Extended Data Fig. 9. Boundary elements containing CBS in a single orientation can achieve comparable levels of insulation compared to boundaries containing divergent CBS.
Two different examples of developmental loci, (a) Fgfr2 and (b) Isl1, where boundary elements containing single-oriented CBS achieve boundary scores higher than one. Above, Hi-C and CTCF ChIP-seq experiments from mESC are shown. CBS are depicted in red or blue for forward and reverse orientation respectively. Insulation scores, boundaries and boundary elements are calculated with FAN-C (see Methods). RNAPII ChIP-seq experiments in mESC (GSE112806) do not show a particular enrichment in either of the boundaries. Below, E14.5 WISH from representative genes at either side of the boundary do not suggest co-regulation (obtained from GenePaint.org).
Extended Data Fig. 10
Extended Data Fig. 10. The boundary score (BS) of 40% of boundaries genome-wide could potentially allow regulatory inter-boundary interactions.
a. Histogram representing the distribution of Boundary Scores genome-wide calculated from the mESC (left), neural progenitor cells (center) and cortical neurons (right) Hi-C datasets Many of them fall within the range of boundary scores of the EP boundary in our mutant series (demarcated by the vertical dashed lines). b. Cumulative distribution of the boundary scores from A. The boundary scores of the EP boundaries in each of our mutants is highlighted.

Comment in

References

    1. Long HK, Prescott SL, Wysocka J. Ever-changing landscapes: transcriptional enhancers in development and evolution. Cell. 2016;167:1170–1187. - PMC - PubMed
    1. Lieberman-Aiden E, et al. Comprehensive mapping of long-range interactions reveals folding principles of the human genome. Science. 2009;326:289–293. - PMC - PubMed
    1. de Wit E, de Laat W. A decade of 3C technologies: insights into nuclear organization. Genes Dev. 2012;26:11–24. - PMC - PubMed
    1. Dixon JR, et al. Topological domains in mammalian genomes identified by analysis of chromatin interactions. Nature. 2012;485:376–380. - PMC - PubMed
    1. Nora EP, et al. Spatial partitioning of the regulatory landscape of the X-inactivation centre. Nature. 2012;485:381–385. - PMC - PubMed

Publication types