. 2022 Aug 16;81(9):666-695.
doi: 10.1093/jnen/nlac056.

SARS-CoV-2 Brain Regional Detection, Histopathology, Gene Expression, and Immunomodulatory Changes in Decedents with COVID-19

Affiliations

SARS-CoV-2 Brain Regional Detection, Histopathology, Gene Expression, and Immunomodulatory Changes in Decedents with COVID-19

Geidy E Serrano et al. J Neuropathol Exp Neurol. .

Abstract

Brains of 42 COVID-19 decedents and 107 non-COVID-19 controls were studied. RT-PCR screening of 16 regions from 20 COVID-19 autopsies found SARS-CoV-2 E gene viral sequences in 7 regions (2.5% of 320 samples), concentrated in 4/20 subjects (20%). Additional screening of olfactory bulb (OB), amygdala (AMY) and entorhinal area for E, N1, N2, RNA-dependent RNA polymerase, and S gene sequences detected one or more of these in OB in 8/21 subjects (38%). It is uncertain whether these RNA sequences represent viable virus. Significant histopathology was limited to 2/42 cases (4.8%), one with a large acute cerebral infarct and one with hemorrhagic encephalitis. Case-control RNAseq in OB and AMY found more than 5000 and 700 differentially expressed genes, respectively, unrelated to RT-PCR results; these involved immune response, neuronal constituents, and olfactory/taste receptor genes. Olfactory marker protein-1 reduction indicated COVID-19-related loss of OB olfactory mucosa afferents. Iba-1-immunoreactive microglia had reduced area fractions in cerebellar cortex and AMY, and cytokine arrays showed generalized downregulation in AMY and upregulation in blood serum in COVID-19 cases. Although OB is a major brain portal for SARS-CoV-2, COVID-19 brain changes are more likely due to blood-borne immune mediators and trans-synaptic gene expression changes arising from OB deafferentation.

Keywords: Amygdala; Cytokine; Deafferentation; Encephalitis; Microglia; Olfactory bulb; SARS-Cov-2.


Figures

FIGURE 1.
FIGURE 1.
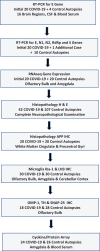
Tissue analysis flowchart. A series of tissue investigations incorporated the most suitable COVID-19 and control subjects as appropriate and was dependent in part on those cases that were available as the pandemic progressed. The highest priority objective and therefore the first to be undertaken was to determine the brain regional presence of SARS-CoV-2 genomic sequences. Subsequent analyses, including case-control comparisons of gene expression, circulating and local cytokine response, microglial reaction and neuronal markers, utilized the most appropriate additional subsets of cases and controls as they became available, and focused on the OB and the closely connected amygdala (AMY). General histopathological and viral-typical brain changes were documented with H&E staining across all 42 cases and 107 controls by standard neuropathological examination with additional immunohistochemical staining for β-amyloid precursor protein (APP) to augment sensitivity for hypoxic-ischemic changes in a subset of subjects and brain regions. IHC, immunohistochemistry; OMP-1, olfactory marker protein-1; TH, tyrosine hydroxylase; SNAP-25, synaptosomal-associated protein, 25 kDa.
FIGURE 2.
FIGURE 2.
Standard curve for obtaining estimated SARS-CoV-2 RNA copy numbers in samples, constructed with serial dilutions of commercially obtained synthetic SARS-CoV-2 RNA. Black circles are from synthetic E gene RNA dilutions; black squares are from synthetic RNAse P gene RNA dilutions. Also plotted are Ct values for subject samples that were positive for threshold amplification (≤Ct 35) for E gene RNA (colored symbols, larger symbols are for brain samples, symbols for lung samples are smaller; some symbols are superimposed on others). The highest copy numbers were obtained from lung samples (downward-pointing arrows show lung samples with higher Ct values), olfactory bulb samples ([OB], arrows pointing to diamond symbols), and a temporal cortex sample ([TC], arrow pointing to triangle symbol). Ent, entorhinal area; Leptos, leptomeninges; AMYG, amygdala; FC, frontal cortex; B2-B7, B9, B10 are consecutive BSHRI cases that included lungs in the autopsy. M10 and M11 are Mayo Clinic cases. See Supplementary Data Table S1 for case details.
FIGURE 3.
FIGURE 3.
Volcano plot showing the differential expression analysis results comparing COVID-19 cases versus controls in amygdala (A) and olfactory bulb (B). Upper points represent genes that had significantly different expression in COVID-19 as compared to controls. Genes on left and right were downregulated and upregulated, respectively, in COVID-19 cases (FDR p < 0.05).
FIGURE 4.
FIGURE 4.
The 9 genes with the greatest expression differences in amygdala (A) and olfactory bulb (B).
FIGURE 5.
FIGURE 5.
Volcano plot showing the differential expression analysis results comparing OB in COVID-19 cases that were RT-PCR-positive (right side) or negative (left side) for SARS-CoV-2 RNA sequences. Uppermost 5 points represent genes that had significantly different expression in COVID-19 as compared to controls. All other genes were not differentially expressed.
FIGURE 6.
FIGURE 6.
The 5 genes that were differentially expressed in the OB on the basis of being RT-PCR-positive or negative for SARS-CoV-2 genomic sequences. C+/P+, COVID-19 PCR-positive; C+/P−, COVID-19 PCR-negative.
FIGURE 7.
FIGURE 7.
The top 10 pathways enriched in amygdala and olfactory bulb. All: all DEGs are shown regardless of up- or downregulation. Up: DEGs upregulated in COVID-19 subjects. Down: DEGs downregulated in COVID-19 subjects.
FIGURE 8.
FIGURE 8.
Cell-specific gene enrichment among DEGs in amygdala and olfactory bulb. Gene classes significantly enriched are indicated with an asterisk (FDR < 0.05). Ast, astrocytes; END, endothelial cells; Ex, excitatory neuron; In, inhibitory neuron; Mic, microglia; Oli, oligodendroglia; Opc, oligodendroglial precursor cells; Per, pericytes.
FIGURE 9.
FIGURE 9.
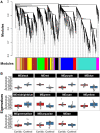
Dendrogram representing the relationship between WGCNA modules from OB.
FIGURE 10.
FIGURE 10.
(A-F) Mayo Clinic COVID-19 case 10, a 38-year-old man. Neuropathological gross examination was consistent with brain swelling causing transtentorial uncal herniation and acute hemorrhages (arrows A and A inset, B and C). Microscopic hemorrhage was present in temporal lobe (D), with fibrinoid vascular necrosis in the pons (E) and neuropil infiltration with CD-68-immunoreactive macrophages (F). (G-I) Banner Sun Health Research Institute (BSHRI) COVID-19 case, a 74-year-old man. Clinical findings indicated a massive acute left middle cerebral artery territory ischemic infarct, as shown in the MRI image (G, white arrows). Gross examination of the brain at autopsy showed hemorrhage within the cerebral cortex (H). Widespread areas within the left middle cerebral artery distribution showed acute ischemic infarction and/or acute hypoxic-ischemic changes, with perikaryal cytoplasmic eosinophilia and nuclear pyknosis of cortical pyramidal neurons (I).
FIGURE 11.
FIGURE 11.
Photomicrographs of cingulate gyrus and precentral white matter APP staining in COVID-19 cases (A-D) and controls (E-H). (A) Low-magnification, cingulate gyrus, COVID-19 case. (B) Low-magnification, precentral gyrus, COVID-19 case. (C) Medium-magnification, precentral gyrus, COVID-19 case. (D) High-magnification, cingulate gyrus, COVID-19 case. (E) Low-magnification, cingulate gyrus, control case, with non-COVID-19 pneumonia. (F) Low-magnification, precentral gyrus, control case, with non-COVID-19 pneumonia. (G) Medium-magnification, precentral gyrus, control case, with non-COVID-19 pneumonia. (H) High-magnification, cingulate gyrus, control case, with non-COVID-19 pneumonia. Bar in E also serves for A = 200 mm. Bar in F also serves for B = 100 mm. Bar in G also serves for C = 50 mm. Bar in H also serves for D = 50 mm.
FIGURE 12.
FIGURE 12.
Photomicrographs of representative OMP-1, TH, and SNAP-25 immunoreactivity in (A-F) non-COVID-19 control cases and (G-L) COVID-19 cases at low (A-C, G-I) and higher (D-F, J-L) magnifications. The higher magnifications were used for image analysis. Columns of images are, from left to right, portraying OMP-1, TH, and SNAP-25 staining of olfactory bulb. Note the loss and/or decreased staining of synaptic glomeruli (arrows) in COVID-19 olfactory bulb.
FIGURE 13.
FIGURE 13.
Quantification results for OMP-1, TH, and SNAP-25 immunoreactivity for each group. Shown are controls grouped together or separated by presence or absence of pneumonia. Means and standard deviations are shown. OMP-1 is significantly depleted in COVID-19 cases relative to all controls and relative to controls without pneumonia. SNAP-25 staining is significantly depleted in control subjects with pneumonia as compared to control subjects without pneumonia. *p < 0.05.
FIGURE 14.
FIGURE 14.
Photomicrographs of immunohistochemical Iba1 staining of microglia in control subjects (A-C) and COVID-19 cases (D-F), in amygdala (A, D), cerebellar cortex (B, E), and olfactory bulb (C, F). Scale bar in B serves for all frames.
FIGURE 15.
FIGURE 15.
Quantification results for Iba1 staining of microglia in COVID-19 and control subjects. The control group did not differ with presence or absence of pneumonia and so these were combined for the graphs. The area occupied by Iba1-immunoreactive microglia is significantly reduced in AMY and CBL of COVID-19 subjects. Means and standard deviations are shown.
FIGURE 16.
FIGURE 16.
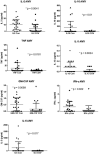
Scatter plots showing results for cytokines that showed significant group differences in amygdala samples. All 7 comparisons demonstrated decreased concentrations in COVID-19 cases relative to controls. The control group did not differ with presence or absence of pneumonia and so these were combined for the graphs. Means and standard deviations are shown.
FIGURE 17.
FIGURE 17.
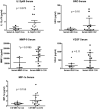
Scatter plots showing results for cytokines that showed group differences in postmortem serum samples. All 5 comparisons demonstrated increased concentrations in COVID-19 cases relative to controls, but only 1 of 5 comparisons reached the significance level. The control group did not differ with presence or absence of pneumonia and so these were combined for the graphs. Means and standard deviations are shown.

References

    1. Yassin A, Nawaiseh M, Shaban A, et al. Neurological manifestations and complications of coronavirus disease 2019 (COVID-19): A systematic review and meta-analysis. BMC Neurol 2021;21:138. - PMC - PubMed
    1. Varatharaj A, Thomas N, Ellul MA, et al. ; CoroNerve Study Group. Neurological and neuropsychiatric complications of COVID-19 in 153 patients: A UK-wide surveillance study. Lancet Psychiatry 2020;7:875–882 - PMC - PubMed
    1. Delamarre L, Gollion C, Grouteau G, et al. ; NeuroICU Research Group. COVID-19-associated acute necrotising encephalopathy successfully treated with steroids and polyvalent immunoglobulin with unusual IgG targeting the cerebral fibre network. J Neurol Neurosurg Psychiatry 2020;91:1004–6 - PMC - PubMed
    1. Ghannam M, Alshaer Q, Al-Chalabi M, et al. Neurological involvement of coronavirus disease 2019: A systematic review. J Neurol 2020;267:3135–53 - PMC - PubMed
    1. Anand PZ, Zhou L, Hamer DH, et al. Neurologic findings among inpatients with COVID-19 at a safety-net U.S. hospital. Neurol Clin Pract 2021;11:e83–91 - PMC - PubMed

Publication types