Designing Infographics: Visual Representations for Enhancing Education, Communication, and Scientific Research
- PMID: 35818705
- PMCID: PMC9274103
- DOI: 10.3346/jkms.2022.37.e214
Designing Infographics: Visual Representations for Enhancing Education, Communication, and Scientific Research
Abstract
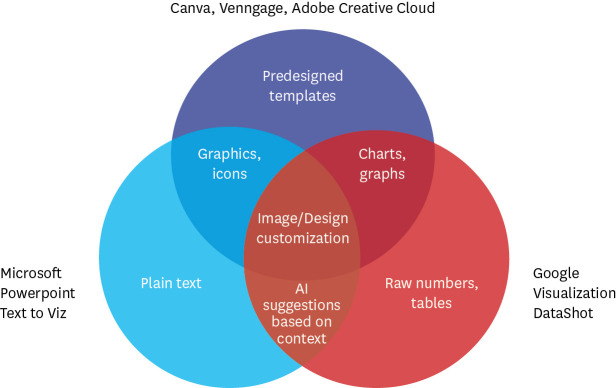
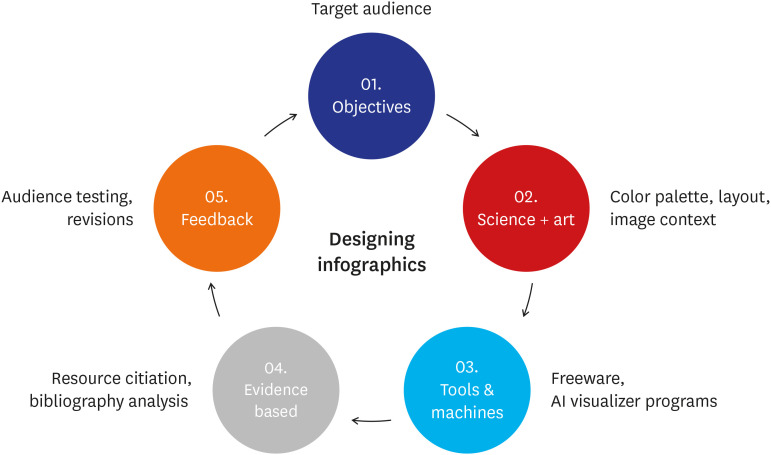
Infographics are graphic visual representations of educational content, used to deliver complex information, disseminate scientific research, and drive behavioral change. Herein, we review some of the factors pertinent to designing infographics and the potential for automation in the future. To guide high-impact design, it is vital to clearly define the objectives of the infographic and its target audience. Designing an effective infographic necessitates careful consideration of the layout, colors, font, and context. More recently, technical support to develop infographics are increasingly available through online software (Canva, Adobe, and Venngage) and emerging artificial intelligence programs. References can also become a visual representation of trends in scientific discovery. It is crucial for clinicians, researchers and scientists to have the knowledge and skills to design compelling infographics. In the era of social media, the uptake and effects of infographics for disseminating scientific research and public health education need to be further studied to understand their full potential.
Keywords: Design; Infographics; Research; Social Media; Technology.
© 2022 The Korean Academy of Medical Sciences.
Conflict of interest statement
The authors have no potential conflicts of interest to disclose.
Figures
References
-
- Huang S, Martin LJ, Yeh CH, Chin A, Murray H, Sanderson WB, et al. The effect of an infographic promotion on research dissemination and readership: a randomized controlled trial. CJEM. 2018;20(6):826–833. - PubMed
-
- Zimba O, Radchenko O, Strilchuk L. Social media for research, education and practice in rheumatology. Rheumatol Int. 2020;40(2):183–190. - PubMed
-
- Applequist J, Burroughs C, Ramirez A, Jr, Merkel PA, Rothenberg ME, Trapnell B, et al. A novel approach to conducting clinical trials in the community setting: utilizing patient-driven platforms and social media to drive web-based patient recruitment. BMC Med Res Methodol. 2020;20(1):58. - PMC - PubMed
Publication types
MeSH terms
LinkOut - more resources
Full Text Sources