Review
. 2022 Aug;309(1):97-122.
doi: 10.1111/imr.13116. Epub 2022 Jul 12.

Transcriptomics for child and adolescent tuberculosis

Affiliations
Review

Transcriptomics for child and adolescent tuberculosis

Myrsini Kaforou et al. Immunol Rev. 2022 Aug.

Abstract

Tuberculosis (TB) in humans is caused by Mycobacterium tuberculosis (Mtb). It is estimated that 70 million children (<15 years) are currently infected with Mtb, with 1.2 million each year progressing to disease. Of these, a quarter die. The risk of progression from Mtb infection to disease and from disease to death is dependent on multiple pathogen and host factors. Age is a central component in all these transitions. The natural history of TB in children and adolescents is different to adults, leading to unique challenges in the development of diagnostics, therapeutics, and vaccines. The quantification of RNA transcripts in specific cells or in the peripheral blood, using high-throughput methods, such as microarray analysis or RNA-Sequencing, can shed light into the host immune response to Mtb during infection and disease, as well as understanding treatment response, disease severity, and vaccination, in a global hypothesis-free manner. Additionally, gene expression profiling can be used for biomarker discovery, to diagnose disease, predict future disease progression and to monitor response to treatment. Here, we review the role of transcriptomics in children and adolescents, focused mainly on work done in blood, to understand disease biology, and to discriminate disease states to assist clinical decision-making. In recent years, studies with a specific pediatric and adolescent focus have identified blood gene expression markers with diagnostic or prognostic potential that meet or exceed the current sensitivity and specificity targets for diagnostic tools. Diagnostic and prognostic gene expression signatures identified through high-throughput methods are currently being translated into diagnostic tests.

Keywords: children; diagnosis; differential expression; transcriptomics; tuberculosis.


Conflict of interest statement

MK, ML, and TS hold patents on several gene expression signatures. CB, OV, and JAS have no conflicts of interest.

Figures

FIGURE 1
FIGURE 1
Overview of the role of transcriptomics in pediatric and adolescent TB, together with steps required for RNA quantification and bioinformatics analysis. Created with BioRender.com
FIGURE 2
FIGURE 2
Risk Scores and Sensitivity and Specificity in the Kenyan Validation Cohort, According to Diagnostic Group. Panel A shows the risk scores for tuberculosis according to study group, calculated with the use of a 51‐transcript signature applied to the independent Kenyan validation cohort, in which culture‐positive tuberculosis was reported in 35 patients, diseases other than tuberculosis were reported in 55 patients, and culture‐negative tuberculosis was reported as highly probable in 5 patients, probable in 19 patients, and possible in 17 patients. The bar within each box indicates the median score, the bottom and top of the box indicate the interquartile range, the bars below and above the box are at a distance of 0.8 times the interquartile range from the upper and lower edges of the box, and the circles indicate outliers; the horizontal line across the graph indicates the mean score. Panel B shows smoothed receiver‐operating‐characteristic (ROC) curves for the sensitivity and specificity of the risk score (solid lines) and the Xpert MTB/RIF assay (dotted lines). Panel C shows ROC curves based on an adjusted analysis in which the actual prevalence of disease was assumed to be 80% among patients in whom the disease was highly probable, 50% among those in whom it was probable, and 40% among those in whom it was possible. From Anderson and colleagues. New Eng J Med 2014; 370: 1712–23
FIGURE 3
FIGURE 3
Strategy for discovery and validation of the tuberculosis risk signature. Synchronization of the adolescent cohort study training set in terms of the clinical outcome. To ensure optimal extraction of a tuberculosis risk signature from the adolescent cohort study training set, the timescale of the RNA‐Sequencing dataset was realigned according to tuberculosis diagnosis instead of study enrolment, allowing gene expression differences to be measured before disease diagnosis. Each progressor within the adolescent cohort study training set is represented by a horizontal bar. The length of the bar represents the number of days between study enrolment and diagnosis with active tuberculosis. During follow‐up, each progressor transitioned from an asymptomatic healthy state (green) to pulmonary disease (red). The left graph shows alignment of PAXgene sample collection (black points) with respect to study enrolment. The right graph shows alignment of PAXgene sample collection with respect to diagnosis with active tuberculosis, for use in analysis. From Zak and colleagues. A blood RNA signature for tuberculosis disease risk: a prospective cohort study. Lancet 2016; 387: 2312–22
FIGURE 4
FIGURE 4
Diagnostic performance and treatment monitoring in South American cohorts. (A) Comparison of RISK6 signature scores in TB cases at baseline, Week 8 after treatment initiation and after treatment completion (Post Rx). Also shown are the RISK6 signature scores in healthy controls from Brazil. Horizontal lines depict medians, the boxes the IQR, and the whiskers the range. Violin plots depict the density of data points. The P‐value, computed by Mann–Whitney U test, compares RISK6 signature scores after treatment completion with those in controls. (B) ROC curves depicting performance of RISK6 for discriminating between baseline samples from TB cases and samples collected 8 weeks after treatment initiation, or upon completion of TB treatment (Post Rx). From Penn‐Nicholson and colleagues. RISK6, a 6‐gene transcriptomic signature of TB disease risk, diagnosis, and treatment response. Sci Rep 2020; 10: 8629
FIGURE 5
FIGURE 5
Heatmaps showing clustering (Unweighted Pair Group Method with Arithmetic Mean or UPGMA method) of the top 50 SDEs in (A) culture confirmed TB vs other diseases, (B) culture confirmed TB vs Mtb infection and (C) other diseases vs Mtb infection of the patients from South Africa, Malawi, and Kenya in Anderson et al datasets. Patients' clinical groups are highlighted at the bar on the top of each heatmap, with culture confirmed TB patients in red, patients with Mtb infection in green and patients with other diseases in blue. Only HIV uninfected patients have been included and shown on these heatmaps. Under‐expression is depicted in blue and over expression in red
FIGURE 6
FIGURE 6
Volcano plot showing the significant genes identified comparing culture confirmed TB cases vs other diseases (OD) from Anderson et al South Africa, Malawi, and Kenya HIV uninfected patient datasets. Genes that passed the thresholds for absolute value of log2FoldChange >0.5 and adj‐p‐value <0.05, were colored in green
FIGURE 7
FIGURE 7
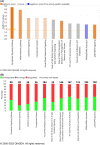
Canonical pathway analysis results comparing confirmed TB to other diseases (OD) using Anderson et al datasets. (A) The orange and blue‐colored bars in the bar chart indicate predicted pathway activation or predicted inhibition, respectively. Gray bars indicate pathways for which no prediction can be made due to insufficient evidence in the Knowledge Base for confident activity predictions across datasets. (B) Displays the number of molecules in the list of SDE genes, showing the up‐regulated (red), down‐regulated (green). The y‐axis represents the percentage of molecules that are present in a specific Canonical Pathway. The total number of molecules in the pathway is shown
FIGURE 8
FIGURE 8
Canonical pathway example: Interferon Signaling Pathway. The molecules that are different shades of red color indicate up‐regulation in the comparison of TB vs other diseases
FIGURE 9
FIGURE 9
Concordance and discordance of the log2FoldChange of statistically differentially expressed genes in TB vs Mtb infection against the log2FoldChange of corresponding genes in OD vs Mtb infection from Anderson et al datasets. Each dot is colored according to the disco score and represents a gene: the stronger the red color the more concordantly regulated is the gene pair; the stronger the blue color, the more discordantly regulated is the gene pair
FIGURE 10
FIGURE 10
Boxplots of the 5 discordant genes between two comparisons TB vs Mtb infection (baseline) and OD vs Mtb infection (baseline) from Anderson et al datasets. The bar within each box indicates the median score, the bottom and top of the box indicate the interquartile range, the bars below and above the box are at a distance of 1.5 times the interquartile range from the upper and lower edges of the box, and the circles indicate outliers; the horizontal line across the graph indicates the median score of the Mtb infected group
FIGURE 11
FIGURE 11
Molecular network, constructed from the discordant genes identified in the disco plot from Anderson et al dataset. The molecules that are different shades of red color indicate up‐regulation in the comparison of TB vs other diseases. The default number of molecules per network has been used, n = 35
FIGURE 12
FIGURE 12
Illustration of an integrated TB treatment decision algorithm including biomarkers

References

    1. Daniel TM. The history of tuberculosis. Respir Med. 2006;100(11):1862‐1870. - PubMed
    1. Jones C, Whittaker E, Bamford A, Kampmann B. Immunology and pathogenesis of childhood TB. Paediatr Respir Rev. 2011;12(1):3‐8. - PubMed
    1. Basu Roy R, Whittaker E, Seddon JA, Kampmann B. Tuberculosis susceptibility and protection in children. Lancet Infect Dis. 2019;19(3):e96‐e108. - PMC - PubMed
    1. Seddon JA, Chiang SS, Esmail H, Coussens AK. The wonder years: what can primary school children teach us about immunity to mycobacterium tuberculosis? Front Immunol. 2018;9:2946. - PMC - PubMed
    1. Marais BJ, Gie RP, Schaaf HS, Hesseling AC, Enarson DA, Beyers N. The spectrum of disease in children treated for tuberculosis in a highly endemic area. Int J Tuberc Lung Dis. 2006;10(7):732‐738. - PubMed

Publication types