. 2022 Aug 12;50(14):7889-7905.
doi: 10.1093/nar/gkac591.

Induction of senescence upon loss of the Ash2l core subunit of H3K4 methyltransferase complexes

Affiliations

Induction of senescence upon loss of the Ash2l core subunit of H3K4 methyltransferase complexes

Agnieszka Bochyńska et al. Nucleic Acids Res. .

Abstract

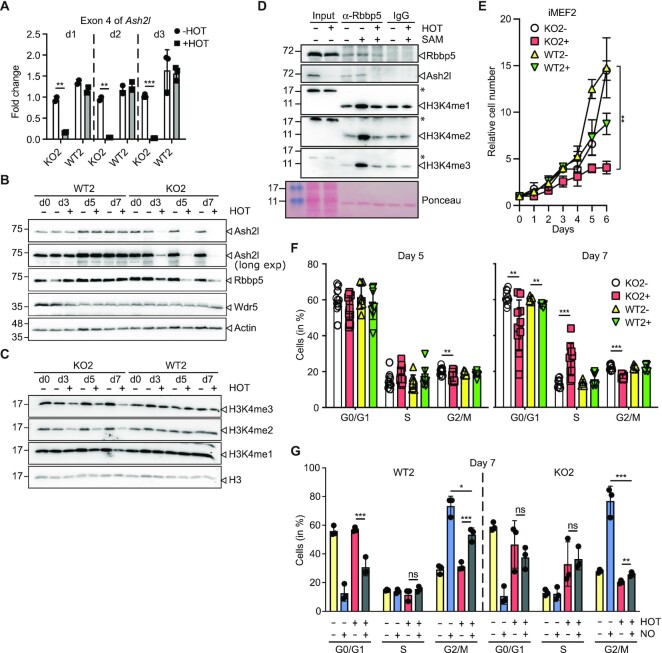
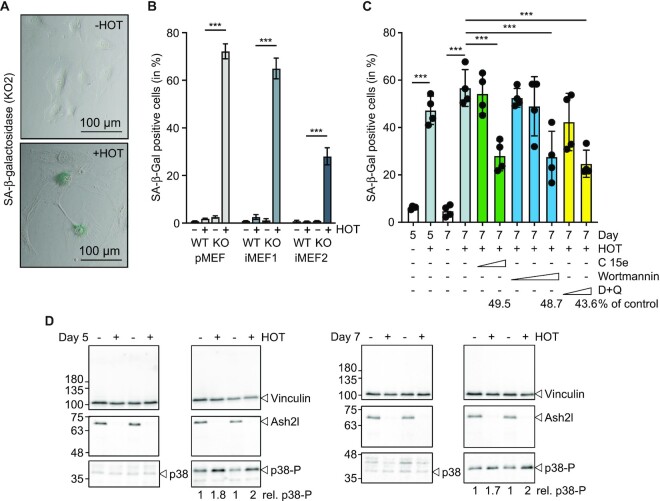
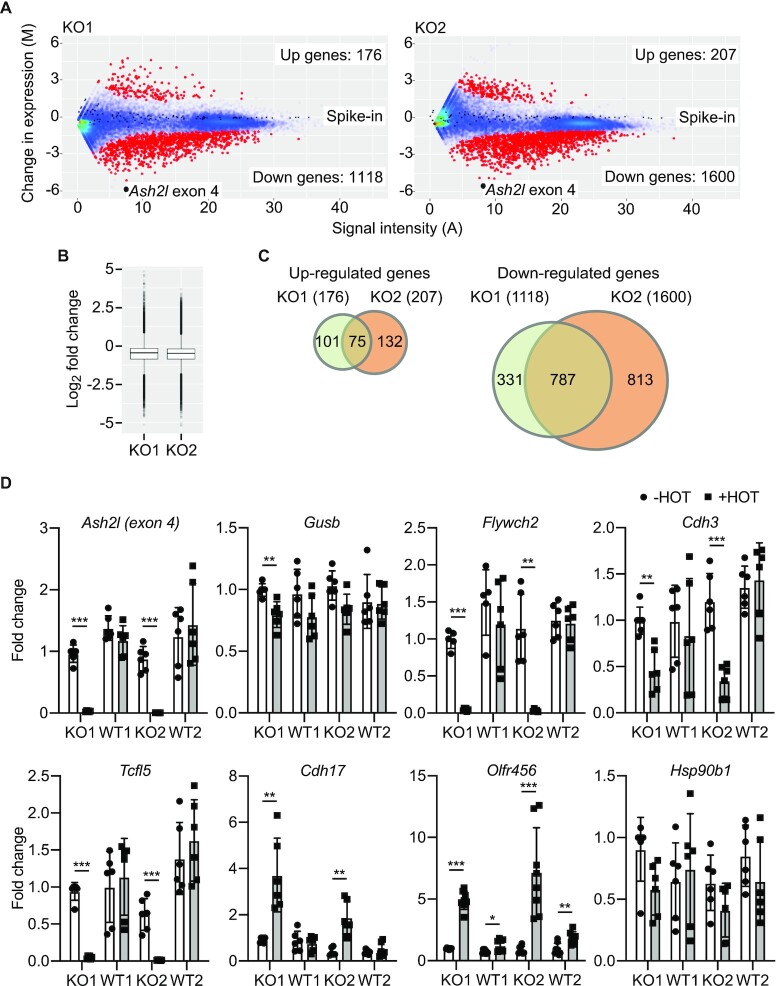
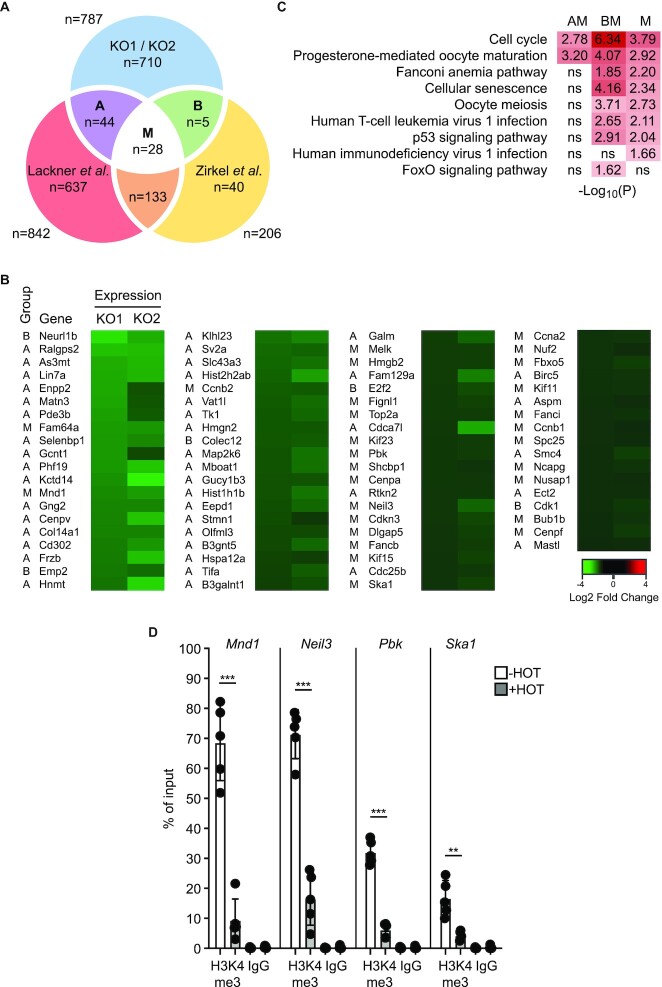
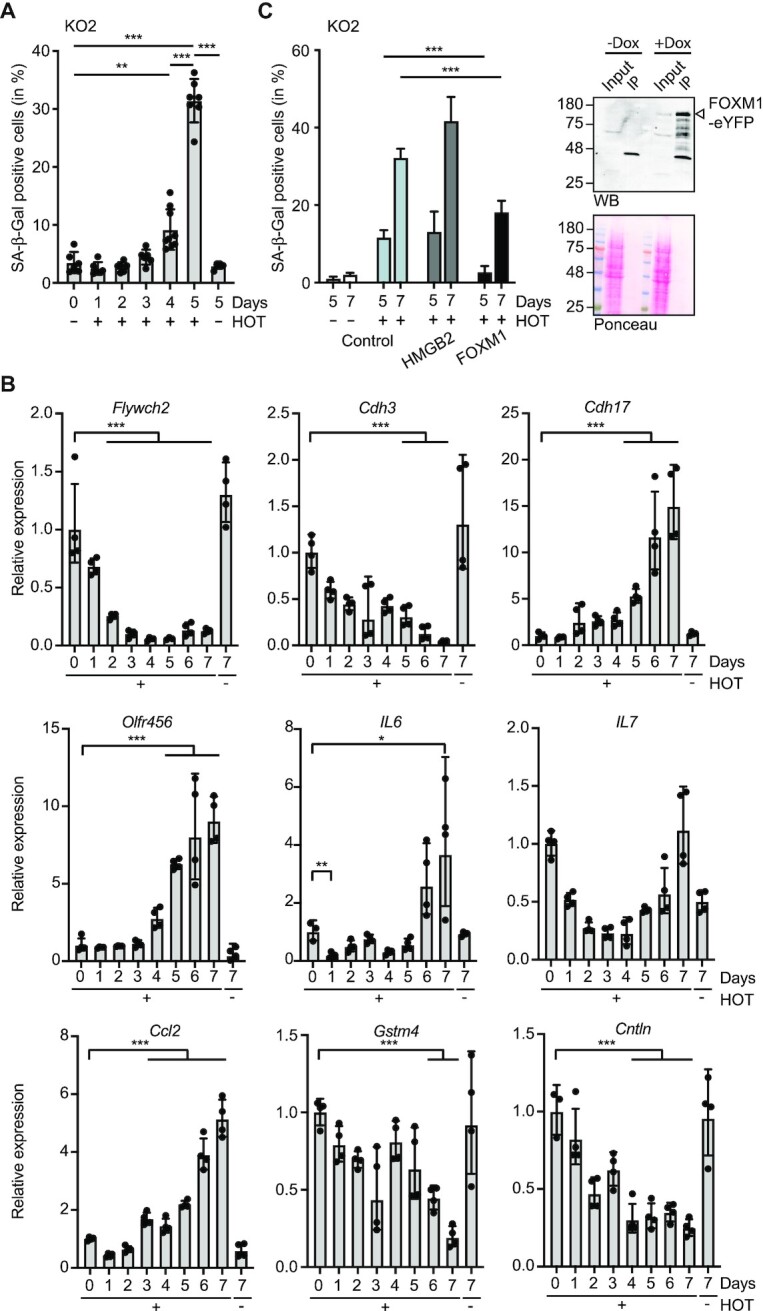
Gene expression is controlled in part by post-translational modifications of core histones. Methylation of lysine 4 of histone H3 (H3K4), associated with open chromatin and gene transcription, is catalyzed by type 2 lysine methyltransferase complexes that require WDR5, RBBP5, ASH2L and DPY30 as core subunits. Ash2l is essential during embryogenesis and for maintaining adult tissues. To expand on the mechanistic understanding of Ash2l, we generated mouse embryo fibroblasts (MEFs) with conditional Ash2l alleles. Upon loss of Ash2l, methylation of H3K4 and gene expression were downregulated, which correlated with inhibition of proliferation and cell cycle progression. Moreover, we observed induction of senescence concomitant with a set of downregulated signature genes but independent of SASP. Many of the signature genes are FoxM1 responsive. Indeed, exogenous FOXM1 was sufficient to delay senescence. Thus, although the loss of Ash2l in MEFs has broad and complex consequences, a distinct set of downregulated genes promotes senescence.


Figures

Figure 1.
Figure 1.
Loss of Ash2l in mouse embryo fibroblasts inhibits proliferation and cell cycle progression. (A) iMEF2 cells (WT2, Ash2lwt/wt:Cre-ERTM2; and KO2, Ash2lfl/fl:Cre-ERTM2) were treated with 4-hydroxytamoxifen (HOT, 5 nM) or vehicle as indicated. RT-qPCR analysis of the floxed exon 4 of Ash2l was performed at days 1, 2 and 3. Indicated are mean values ± SD (*** P < 0.001; ** P < 0.01). (B, C) Wild type (WT1) and Ash2lfl/fl (KO1) immortalized fibroblasts (iMEF1) were treated ± HOT for 0, 3, 5 or 7 days. The cells were lysed and the indicated proteins analyzed by western blotting. (D) KO2 cells were treated ± HOT for 5 days. KMT2 complexes were immunoprecipitated from low stringency lysates using an antibody specific for Rbbp5 or a species matched control antibody (IgG). The immunoprecipitates were incubated in the presence or absence of S-adenosyl-methionine (SAM) and recombinant histone H3. The reactions were analyzed for the proteins indicated using Western blotting. In the input non-specific signals are labeled (*). (E) Wild type (WT) and Ash2lfl/fl (KO) immortalized fibroblasts (iMEF2) were treated ± HOT (5 nM) for the times indicated. The cells were counted daily. Mean values ± SD of 4–6 measurements in duplicates for each time point (statistical analyses refer to day 6: ** < 0.01). (F) Cell cycle analysis using flow cytometry of fixed and Hoechst stained WT2 and KO2 cells treated ± HOT for 5 or 7 days. Mean values ± SD (n = 6–10; ** < 0.01, *** < 0.001). (G) WT2 and KO2 cells were treated ± HOT for 7 days. During the last 18 h the cells were incubated with nocodazole (100 ng/ml) or vehicle control as indicated. The cells were fixed, the DNA stained using Hoechst and analyzed by flow cytometry. Mean values ± SD of 3 experiments are shown. Statistical analyses are indicated for selected data sets, * <0.05, ** < 0.01, *** < 0.001, ns, not significant.
Figure 2.
Figure 2.
Ash2l loss promotes senescence in MEF cells. (A) KO2 cells were incubated ± HOT for 7 days. The cells were fixed and stained for SA-β-galactosidase activity (blue). (B) Primary MEF (pMEF) and iMEF cells were treated ± HOT for 5 days as indicated, analyzed as in panel A and the number of SA-β-gal positive cells determined. Mean values ± SD of 3–4 experiments are shown. In each experiment 200–300 cells were counted (*** < 0.001). (C) KO2 cells were incubated ± HOT for 7 days. During the last 2 days senolytic drugs were added: Compound 15e (1 and 5 μM), Wortmannin (0.1, 1 and 10 μM), and a combination of Dasatinib/Quercetin (25 nM/1.5 μM and 250 nM/15 μM). The percentage of SA-β-Gal positive cells is displayed. Four sections each with 50–150 cells of two biological replicates were counted. Mean values ± SD (n = 4; *** < 0.001). (D) KO2 cells were treated ± HOT for 5 or 7 days as indicated. Whole cell lysates of two biological replicates were analyzed by western blotting using the indicated antibodies. Quantified were p38-P versus p38 signals.
Figure 3.
Figure 3.
Deregulated gene expression upon loss of Ash2l. (A) KO1 and KO2 cells were treated ± HOT for 5 days. RNA was isolated and ERCC RNA spike-in control mix added. The RNA was analyzed using next generation sequencing, adjusted to the spike-in RNA. Displayed are MA plots (A = 0.5(log2(KO + HOT) + log2(KO-HOT)); M = log2(KO + HOT) – log2(KO-HOT)). The number of up- and downregulated genes are indicated (P-value < 0.05). Red dots, significantly regulated genes; blue dots, not regulated genes; black dots, spike-in RNA. The signals obtained for exon 4 of Ash2l are indicated. (B) Box plot analysis of gene expression in KO1 and KO2 cells from the data shown in panel A. A one sample t-test indicates that FC values deviate from 0 (P-value < 2.2e–16). (C) Comparison of up- and downregulated genes between KO1 and KO2 cells. (D) WT and KO iMEF1 and 2 cells were incubated ± HOT for 5 days, the RNA isolated and the expression of the indicated genes measured by RT-qPCR. The expression of Gusb was used as reference. Mean values ± SD (n = 5–8) (* <0.05, ** < 0.01, *** < 0.001).
Figure 4.
Figure 4.
Downregulated genes are associated with the senescence phenotype. (A) Commonly downregulated genes in murine KO1 and KO2 cells upon loss of Ash2l were compared to commonly downregulated genes in three primary human cell populations (45) and to downregulated genes in human diploid fibroblasts (44) in response to replicative senescence. The number of genes is indicated that are in common between the different groups: A, KO1/KO2 and the genes in Lackner et al.; B, KO1/KO2 and the genes in Zirkel et al.; M, common genes of all three studies. Comparison KO1/KO2 with Lackner et al. and Zirkel et al.: P-value < 2.2e–16 (Fischer Exact test). (B) The genes in groups A, B and M are listed and the repression of these genes in both KO1 and KO2 cells upon treatment ± HOT for 5 days is indicated. (C) GO pathway analysis of the genes that are in common between the data sets of panel A. Adjusted P-values are indicated; ns, not significant. (D) KO2 cells were treated ± HOT for 5 days. H3K4me3 ChIP-qPCR experiments were performed with primers specific for the promoters of the indicated genes, which belong to the M group (panels A and B). For control, ChIP was carried out using IgG control antibodies. Displayed are mean values ± SD (n = 5) (** < 0.01, *** < 0.001).
Figure 5.
Figure 5.
FOXM1 delays Ash2l loss induced senescence. (A) KO2 cells were treated with ± HOT for the indicated days. Then cells were fixed and stained for SA-β-galactosidase activity and counted. Mean values ± SD (n = 6–7) (*P < 0.05, **P < 0.01, ***P < 0.001). (B) KO2 cells were incubated ± HOT for 1–7 days, the RNA isolated and the expression of the indicated genes measured by RT-qPCR. The expression of Gusb was used as control. Mean values ± SD (n = 4) (*P <0.05, **P < 0.01, ***P < 0.001). (C) KO2 cells were infected with lentiviruses expressing HMGB2 and FOXM1 (as eYFP fusion proteins). Pools of cells were treated with HOT as indicated and with doxycycline (Dox). The number of SA-β-galactosidase positive cells was determined at days 5 and 7. Slides of two biological replicates analyzed in duplicates were blinded and counted by three persons. The resulting mean values ± SD (***P < 0.001) are depicted. The panel on the right documents FOXM1-eYFP expression in KO2 cells upon induction with Dox using Western blotting (WB). Input refers to 2.5% of total cell lysate, the remainder was used for immunoprecipitating the fusion protein (IP). Prior to specific protein detection, the membranes were stained with Ponceau S to verify equal loading of input lysates.

Similar articles

Cited by

References

    1. Kornberg R.D., Lorch Y. Perspective primary role of the nucleosome. Mol. Cell. 2020; 79:371–375. - PubMed
    1. Zhou K.D., Gaullier G., Luger K. Nucleosome structure and dynamics are coming of age. Nat. Struct. Mol. Biol. 2019; 26:3–13. - PMC - PubMed
    1. Zentner G.E., Henikoff S. Regulation of nucleosome dynamics by histone modifications. Nat. Struct. Mol. Biol. 2013; 20:259–266. - PubMed
    1. Morgan M.A.J., Shilatifard A. Reevaluating the roles of histone-modifying enzymes and their associated chromatin modifications in transcriptional regulation. Nat. Genet. 2020; 52:1271–1281. - PubMed
    1. Bochynska A., Luscher-Firzlaff J., Luscher B. Modes of interaction of KMT2 histone H3 Lysine 4 Methyltransferase/COMPASS complexes with chromatin. Cells. 2018; 7:17. - PMC - PubMed

Publication types

MeSH terms