. 2022 Aug 15;28(16):3557-3572.
doi: 10.1158/1078-0432.CCR-21-4543.

Spatial and Transcriptomic Analysis of Perineural Invasion in Oral Cancer

Affiliations

Spatial and Transcriptomic Analysis of Perineural Invasion in Oral Cancer

Ligia B Schmitd et al. Clin Cancer Res. .

Abstract

Purpose: Perineural invasion (PNI), a common occurrence in oral squamous cell carcinomas, is associated with poor survival. Consequently, these tumors are treated aggressively. However, diagnostic criteria of PNI vary and its role as an independent predictor of prognosis has not been established. To address these knowledge gaps, we investigated spatial and transcriptomic profiles of PNI-positive and PNI-negative nerves.

Experimental design: Tissue sections from 142 patients were stained with S100 and cytokeratin antibodies. Nerves were identified in two distinct areas: tumor bulk and margin. Nerve diameter and nerve-to-tumor distance were assessed; survival analyses were performed. Spatial transcriptomic analysis of nerves at varying distances from tumor was performed with NanoString GeoMx Digital Spatial Profiler Transcriptomic Atlas.

Results: PNI is an independent predictor of poor prognosis among patients with metastasis-free lymph nodes. Patients with close nerve-tumor distance have poor outcomes even if diagnosed as PNI negative using current criteria. Patients with large nerve(s) in the tumor bulk survive poorly, suggesting that even PNI-negative nerves facilitate tumor progression. Diagnostic criteria were supported by spatial transcriptomic analyses of >18,000 genes; nerves in proximity to cancer exhibit stress and growth response changes that diminish with increasing nerve-tumor distance. These findings were validated in vitro and in human tissue.

Conclusions: This is the first study in human cancer with high-throughput gene expression analysis in nerves with striking correlations between transcriptomic profile and clinical outcomes. Our work illuminates nerve-cancer interactions suggesting that cancer-induced injury modulates neuritogenesis, and supports reclassification of PNI based on nerve-tumor distance rather than current subjective criteria.


Figures

Figure 1. Schematic summary of study design. A, Cohort of 142 patients with OSCC. B, Tumor biopsy samples were serially sectioned. All nerves in the tumor bulk and in a 2 mm margin around the tumor bulk were assessed. C, H&E, cytokeratin, and S100 stains were used to locate tumor cells and nerves. Green dashed lines show the nerve outline and red arrows indicate tumor cells. Scale bar, 50 μm. Analysis of serial sections generated patient-level and nerve-level data, used for outcome analysis. D, A subset of samples (n = 8) was selected for spatial transcriptomic analysis. Morphology markers for cytokeratin and S100 were used to guide identification of nerve areas in relation to tumor. AOIs for a nerve close to tumor (green circle) and a nerve far from tumor (purple circle) are overlaid in the immunofluorescence image and enlarged below. Tissues were probed for over 18,000 genes; differential gene expression analysis was performed comparing nerves in different areas of the tumor specimen. E, In vitro validation was performed in neuronal and Schwann cells, and rat DRG; IHC validation was performed in patient tissue specimens.
Figure 1.
Schematic summary of study design. A, Cohort of 142 patients with OSCC. B, Tumor biopsy samples were serially sectioned. All nerves in the tumor bulk and in a 2 mm margin around the tumor bulk were assessed. C, H&E, cytokeratin, and S100 stains were used to locate tumor cells and nerves. Green dashed lines show the nerve outline and red arrows indicate tumor cells. Scale bar, 50 μm. Analysis of serial sections generated patient-level and nerve-level data, used for outcome analysis. D, A subset of samples (n = 8) was selected for spatial transcriptomic analysis. Morphology markers for cytokeratin and S100 were used to guide identification of nerve areas in relation to tumor. AOIs for a nerve close to tumor (green circle) and a nerve far from tumor (purple circle) are overlaid in the immunofluorescence image and enlarged below. Tissues were probed for over 18,000 genes; differential gene expression analysis was performed comparing nerves in different areas of the tumor specimen. E,In vitro validation was performed in neuronal and Schwann cells, and rat DRG; IHC validation was performed in patient tissue specimens.
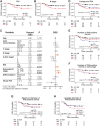
Figure 2. PNI is associated with poor DSS among node-negative patients. Number and diameter of PNI-positive nerves has no correlation with survival. PNI-positive (A) and node-positive (B) patients survive poorly. C, Univariate Cox modeling of patient-level data. Significant HRs are shown in bold and depicted in orange in the plot. D, Among node-negative patients, detection of PNI is significantly associated with poor DSS. The number of PNI-positive nerves is not associated with DSS (E), even among patients with early-stage OSCC (F). Maximum (G) or average (H) diameter of PNI-positive nerves do not associate with DSS. Tertiles were used for nerve diameter: small (< 29.2 μm), medium (29.2–47.5 μm), and large (> 47.5 μm). Kaplan–Meier survival curves using patient-level data are shown in A, B, and D through H. Log-rank P values are displayed in each plot and the number of patients at risk for each timepoint are shown below each survival plot. PNI was assessed using H&E + IHC.
Figure 2.
PNI is associated with poor DSS among node-negative patients. Number and diameter of PNI-positive nerves has no correlation with survival. PNI-positive (A) and node-positive (B) patients survive poorly. C, Univariate Cox modeling of patient-level data. Significant HRs are shown in bold and depicted in orange in the plot. D, Among node-negative patients, detection of PNI is significantly associated with poor DSS. The number of PNI-positive nerves is not associated with DSS (E), even among patients with early-stage OSCC (F). Maximum (G) or average (H) diameter of PNI-positive nerves do not associate with DSS. Tertiles were used for nerve diameter: small (< 29.2 μm), medium (29.2–47.5 μm), and large (> 47.5 μm). Kaplan–Meier survival curves using patient-level data are shown in A, B, and D through H. Log-rank P values are displayed in each plot and the number of patients at risk for each timepoint is shown below each survival plot. PNI was assessed using H&E + IHC.
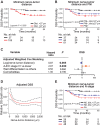
Figure 3. Close nerve-tumor distances associate with poor survival. A, Patients with a nerve-tumor distance ≤ 27 μm survive poorly. B, Among PNI-negative patients, those with nerve tumor distance ≤ 27 μm survive poorly and similarly to PNI-positive patients. C, Adjusted Cox modeling of nerve-level data. Data are weighted by the number of nerves per patient and adjusted for variables shown. Significant HRs are shown in bold and depicted in blue for low and orange for high. D, Adjusted Cox additive modeling for relative DSS as a function of nerve-tumor distance using nerve-level data; a decrease in relative DSS death rate is observed as nerve-tumor distance increases. The model is adjusted for AJCC 7th edition stage and tumor differentiation. E, Among node-negative patients, nerve-tumor distance ≤ 27 μm associates with poor DSS. Kaplan–Meier survival curves using patient-level data are shown in A, B, and E. Log-rank P values are displayed in each plot and the number of patients at risk for each timepoint are shown below each survival plot. PNI was assessed using H&E + IHC.
Figure 3.
Close nerve-tumor distances associate with poor survival. A, Patients with a nerve-tumor distance ≤27 μm survive poorly. B, Among PNI-negative patients, those with nerve tumor distance ≤27 μm survive poorly and similarly to PNI-positive patients. C, Adjusted Cox modeling of nerve-level data. Data are weighted by the number of nerves per patient and adjusted for variables shown. Significant HRs are shown in bold and depicted in blue for low and orange for high. D, Adjusted Cox additive modeling for relative DSS as a function of nerve-tumor distance using nerve-level data; a decrease in relative DSS death rate is observed as nerve-tumor distance increases. The model is adjusted for AJCC 7th edition stage and tumor differentiation. E, Among node-negative patients, nerve-tumor distance ≤27 μm associates with poor DSS. Kaplan–Meier survival curves using patient-level data are shown in A, B, and E. Log-rank P values are displayed in each plot and the number of patients at risk for each timepoint is shown below each survival plot. PNI was assessed using H&E + IHC.
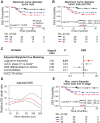
Figure 4. Large nerve diameter in tumor bulk associates with poor DSS. A, Patients are divided in tertiles for maximum nerve diameter in tumor bulk into low (≤ 32.28 μm), medium (33.73–88.13 μm), and large (≥ 89.61 μm). Patients with large nerves in the tumor bulk survive poorly. B, Among PNI-negative patients, nerve diameter ≥ 32 μm in the tumor bulk significantly associates with poor DSS. C, Adjusted Cox modeling of nerve-level data. Data are weighted by the number of nerves per patient and adjusted for variables shown in the table. Significant HRs are shown in bold and depicted in orange for high. D, Adjusted Cox additive modeling for relative DSS as a function of nerve diameter in the tumor bulk using nerve-level data; an increase in relative DSS death rate is observed as nerve diameter increases. The model is adjusted for AJCC 7th edition stage and tumor differentiation. E, Among node-negative patients, a nerve diameter ≥ 32 μm associates with poor DSS. Kaplan–Meier survival curves using patient-level data are shown in A, B, D, and E. Log-rank P values are displayed in each plot and the number of patients at risk for each time-point are shown below each survival plot. PNI was assessed using H&E + IHC.
Figure 4.
Large nerve diameter in tumor bulk associates with poor DSS. A, Patients are divided in tertiles for maximum nerve diameter in tumor bulk into low (≤32.28 μm), medium (33.73–88.13 μm), and large (≥ 89.61 μm). Patients with large nerves in the tumor bulk survive poorly. B, Among PNI-negative patients, nerve diameter ≥32 μm in the tumor bulk significantly associates with poor DSS. C, Adjusted Cox modeling of nerve-level data. Data are weighted by the number of nerves per patient and adjusted for variables shown in the table. Significant HRs are shown in bold and depicted in orange for high. D, Adjusted Cox additive modeling for relative DSS as a function of nerve diameter in the tumor bulk using nerve-level data; an increase in relative DSS death rate is observed as nerve diameter increases. The model is adjusted for AJCC 7th edition stage and tumor differentiation. E, Among node-negative patients, a nerve diameter ≥32 μm associates with poor DSS. Kaplan–Meier survival curves using patient-level data are shown in A, B, and E. Log-rank P values are displayed in each plot and the number of patients at risk for each timepoint is shown below each survival plot. PNI was assessed using H&E + IHC.
Figure 5. Transcriptomic profile of nerves varies with nerve-tumor distance. A, Biopsy sections were stained with morphology markers (cytokeratin in purple and S100 in green) for identification of AOIs. AOIs are overlaid in the fluorescence image and enlarged in panels at right: NC (within 100 μm from tumor with at least 50% surrounded by tumor cells) is identified in green, N100 (within 100 μm from tumor cells but excluded from NC) in orange, N1000 (nerve between 100 and 1,000 μm from tumor) in light blue and NF (beyond 1,000 μm from tumor) in purple. Circular bar graphs around each enlarged AOI represent log2-transformed normalized gene counts (GeoMeans) of 159 genes that were differentially expressed between NC and NF. Blue bars are upregulated and red bars are downregulated in NC. Enlarged GeoMean bar graphs of NF (B) and NC (C) show differences in gene expression. D, GeoMeans for 159 genes as a function of the type of AOI. Upregulated genes go gradually up whereas downregulated genes go gradually down from NF to NC. Gradual differences are observed for the log2(FC; E) and adjusted P values (FDR; F) for 159 genes as a function of nerve-tumor distance. NC versus NF has the largest log2(FC) and the smallest FDR values, while N1000 versus NF are most similar in terms of gene expression. Scale bar (A), 500 μm.
Figure 5.
Transcriptomic profile of nerves varies with nerve-tumor distance. A, Biopsy sections were stained with morphology markers (cytokeratin in purple and S100 in green) for identification of AOIs. AOIs are overlaid in the fluorescence image and enlarged in panels at right: NC (within 100 μm from tumor with at least 50% surrounded by tumor cells) is identified in green, N100 (within 100 μm from tumor cells but excluded from NC) in orange, N1000 (between 100 and 1,000 μm from tumor) in light blue, and NF (beyond 1,000 μm from tumor) in purple. Circular bar graphs around each enlarged AOI represent log2-transformed normalized gene counts (GeoMeans) of 159 genes that were differentially expressed between NC and NF. Blue bars are upregulated and red bars are downregulated in NC. Enlarged GeoMean bar graphs of NF (B) and NC (C) show differences in gene expression. D, GeoMeans for 159 genes as a function of the type of AOI. Upregulated genes go gradually up whereas downregulated genes go gradually down from NF to NC. Gradual differences are observed for the log2(FC; E) and adjusted P values (FDR; F) for 159 genes as a function of nerve-tumor distance. NC versus NF has the largest log2(FC) and the smallest FDR values, while N1000 versus NF are most similar in terms of gene expression. Scale bar (A), 500 μm.
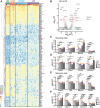
Figure 6. DEGs in nerves close to and far from tumor. A, Heatmap of 46 AOIs across 8 patients, showing 159 significant (FDR ≤ 0.1) differentially expressed genes in NC versus NF. Each row of the heatmap represents the z-score transformed log2 values of one DEG across all samples (blue, low expression; red, high expression). AOI types are identified on top. Genes selected for in vitro validation (C–F) are highlighted with red arrows. B, Volcano plot of differentially expressed genes, identified in red. FDR ≤ 0.05 and ≤ 0.10 are identified by dashed lines. C and D, 50B11 neuronal cells were treated with conditioned medium from cancer cells (UM-SCC-29) for up to 48 hours and mRNA expression of selected genes was assessed. E and F, S16 Schwann cells were treated as described in C and D. Each color represents an independent experiment in C, D, E, and F. Timepoints are depicted in shades of gray. (One-way ANOVA P values: * < 0.05; ** < 0.01; *** < 0.001; **** < 0.0001).
Figure 6.
DEGs in nerves close to and far from tumor. A, Heatmap of 46 AOIs across 8 patients, showing 159 significant (FDR ≤ 0.1) differentially expressed genes in NC versus NF. Each row of the heatmap represents the transformed log2 values of one DEG across all samples (blue, low expression; red, high expression). AOI types are identified on top. Genes selected for in vitro validation (C–F) are highlighted with red arrows. B, Volcano plot of differentially expressed genes, identified in red. FDR ≤ 0.05 and ≤ 0.10 are identified by dashed lines. C and D, 50B11 neuronal cells were treated with conditioned medium from cancer cells (UM-SCC-29) for up to 48 hours and mRNA expression of selected genes was assessed. E and F, S16 Schwann cells were treated as described in C and D. Each color represents an independent experiment in C, D, E, and F. Timepoints are depicted in shades of gray. (One-way ANOVA P values: * < 0.05; ** < 0.01; *** < 0.001; **** < 0.0001).
Figure 7. Validation of DEGs in nerves close to cancer. A, DRG from rat were cocultured for the designated timepoints in the presence or absence of UM-SCC-29 cells; mRNA expression of selected genes was measured. Timepoints are depicted in shades of gray. (One-way ANOVA P values: * < 0.05; ** < 0.01; *** < 0.001; **** < 0.0001). B and C, IHC for MBP; nerves close to (NC, n = 35) and far from tumor (NF, n = 40) were scored for intensity and proportion of stain, and a combined score (intensity × proportion) was generated. Scale bars = 50 μm; n = 8 patients. Quantification is shown in C (Mann–Whitney test P values: *** < 0.001; **** < 0.0001).
Figure 7.
Validation of DEGs in nerves close to cancer. A, DRG from rat were co-cultured for the designated timepoints in the presence or absence of UM-SCC-29 cells; mRNA expression of selected genes was measured. Timepoints are depicted in shades of gray. (One-way ANOVA P values: * < 0.05; ** < 0.01; *** < 0.001; **** < 0.0001). B and C, IHC for MBP; nerves close to (NC, n = 35) and far from tumor (NF, n = 40) were scored for intensity and proportion of stain, and a combined score (intensity × proportion) was generated. Scale bars = 50 μm; n = 8 patients. Quantification is shown in C (Mann–Whitney test P values: *** < 0.001; **** < 0.0001).

Comment in

  • 1078-0432. doi: 10.1158/1078-0432.CCR-28-16-HI

Similar articles

Cited by

References

    1. Monje M, Borniger JC, D'Silva NJ, Deneen B, Dirks PB, Fattahi F, et al. . Roadmap for the emerging field of cancer neuroscience. Cell 2020;181:219–22. - PMC - PubMed
    1. Zhao B, Lv W, Mei D, Luo R, Bao S, Huang B, et al. . Perineural invasion as a predictive factor for survival outcome in gastric cancer patients: a systematic review and meta-analysis. J Clin Pathol 2020;73:544–51. - PubMed
    1. Zareba P, Flavin R, Isikbay M, Rider JR, Gerke TA, Finn S, et al. . Perineural invasion and risk of lethal prostate cancer. Cancer Epidemiol Biomarkers Prev 2017;26:719–26. - PMC - PubMed
    1. Schmitd LB, Beesley LJ, Russo N, Bellile EL, Inglehart RC, Liu M, et al. . Redefining perineural invasion: integration of biology with clinical outcome. Neoplasia 2018;20:657–67. - PMC - PubMed
    1. Liebig C, Ayala G, Wilks JA, Berger DH, Albo D. Perineural invasion in cancer: a review of the literature. Cancer 2009;115:3379–91. - PubMed

Publication types