. 2022 Sep 2;12(9):2158-2179.
doi: 10.1158/2159-8290.CD-21-0205.

SMYD3 Impedes Small Cell Lung Cancer Sensitivity to Alkylation Damage through RNF113A Methylation-Phosphorylation Cross-talk

Affiliations

SMYD3 Impedes Small Cell Lung Cancer Sensitivity to Alkylation Damage through RNF113A Methylation-Phosphorylation Cross-talk

Valentina Lukinović et al. Cancer Discov. .

Abstract

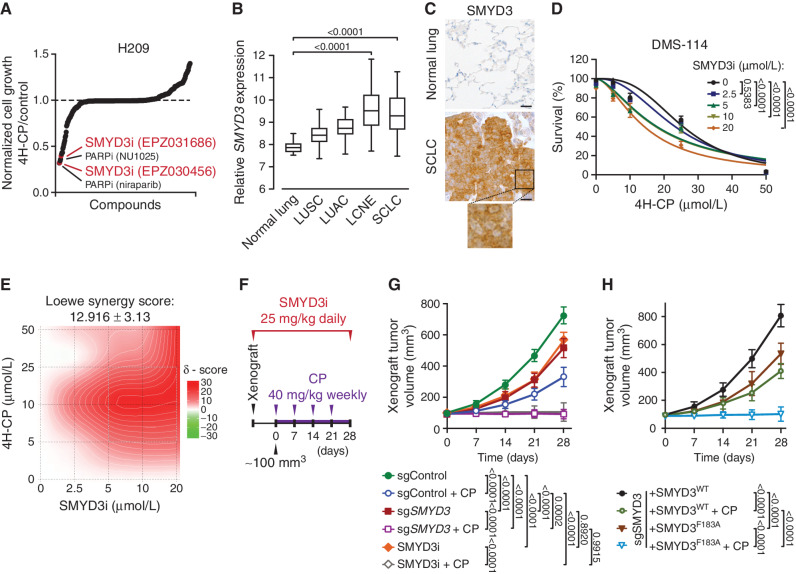
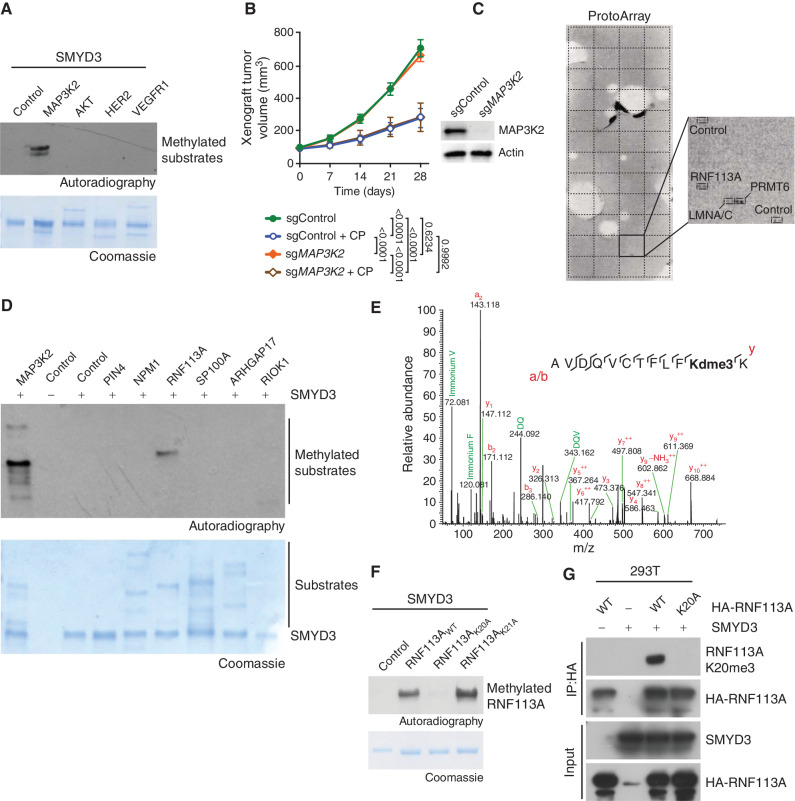
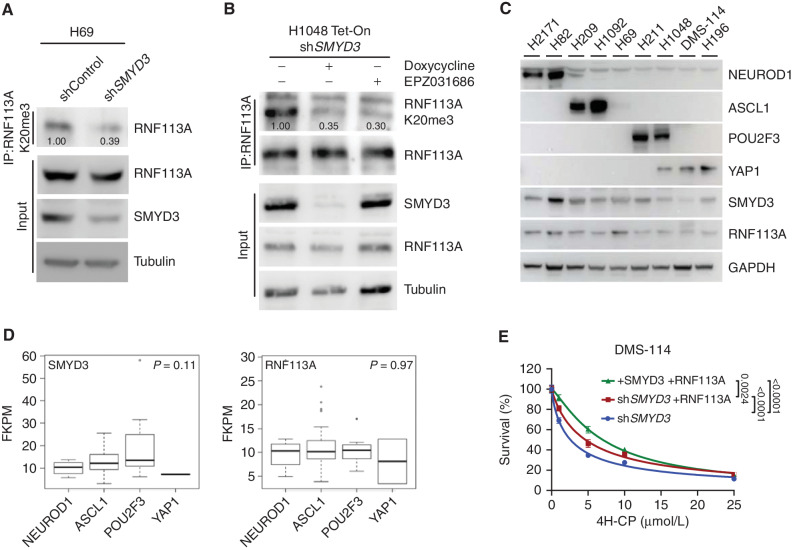
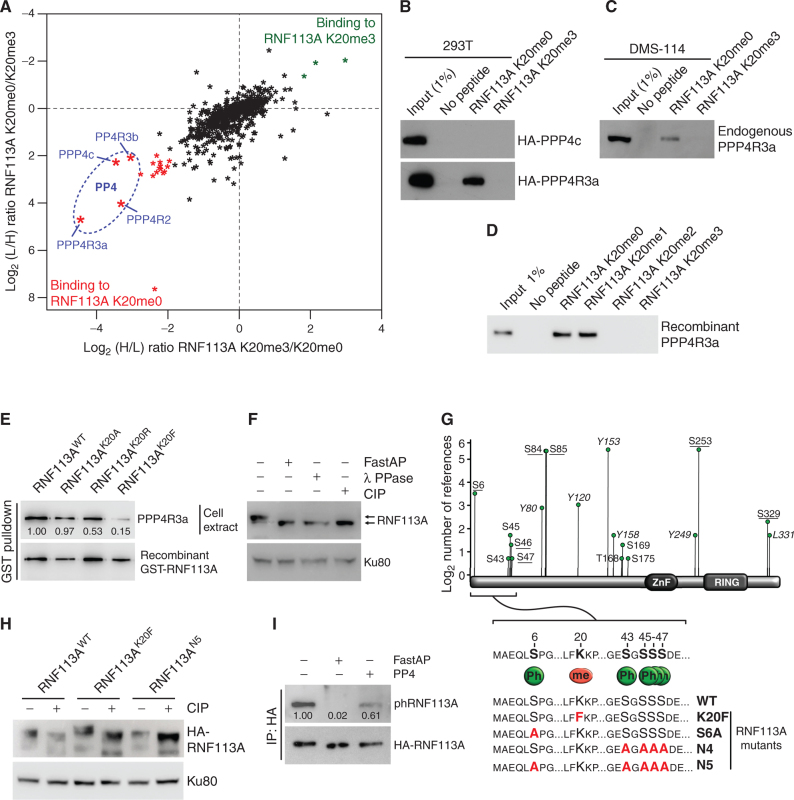
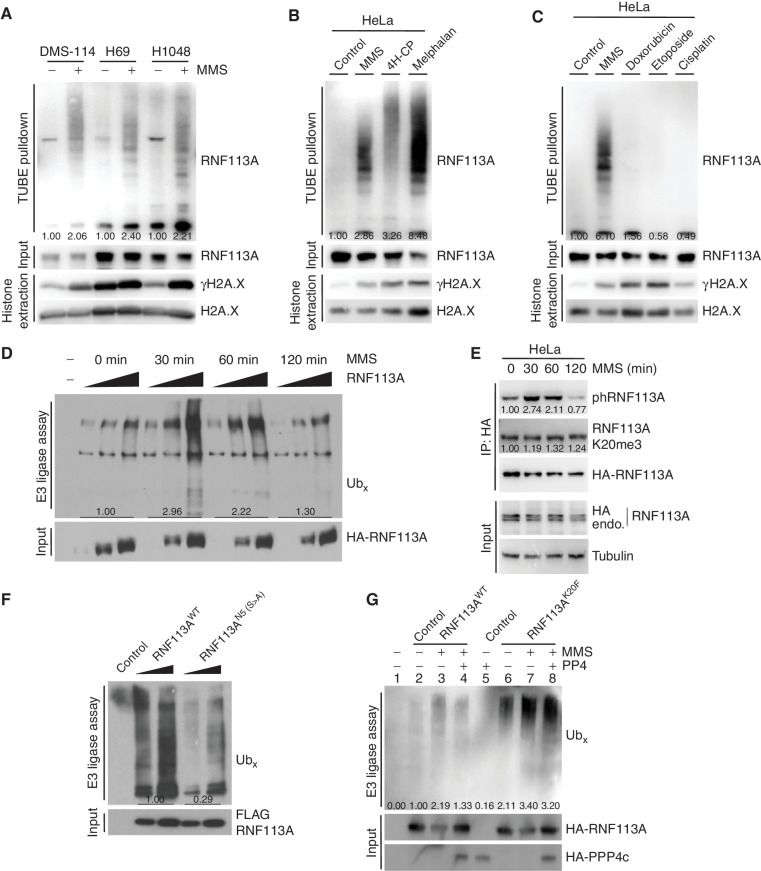
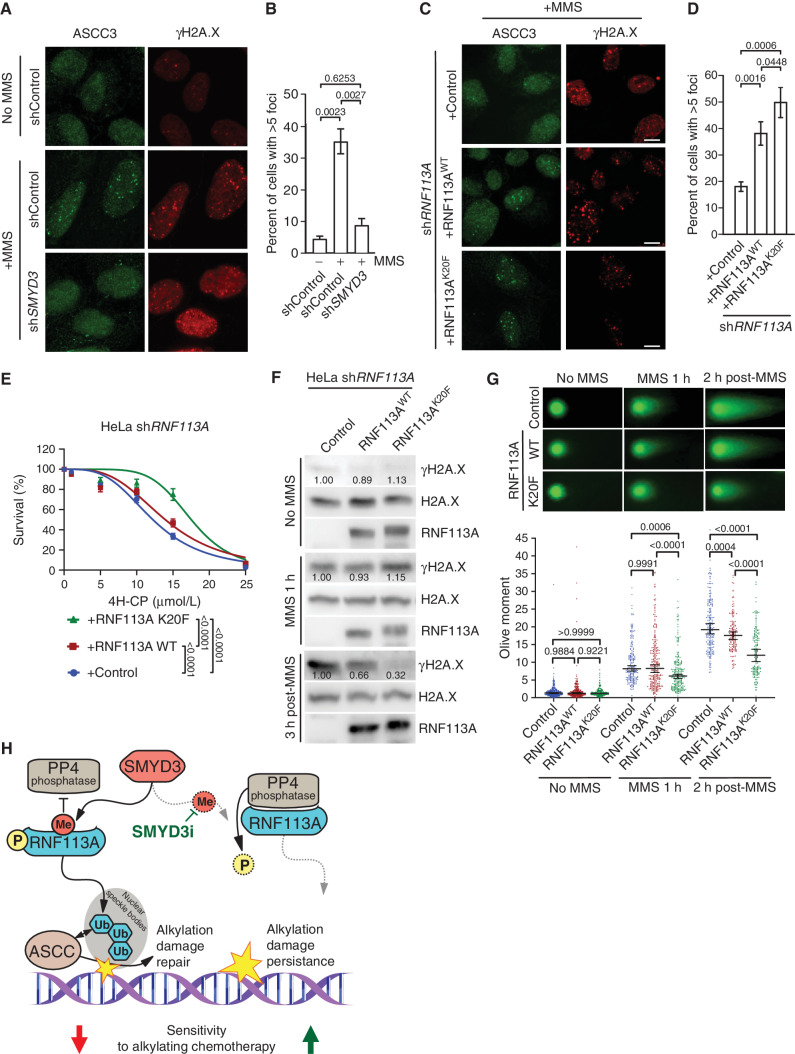
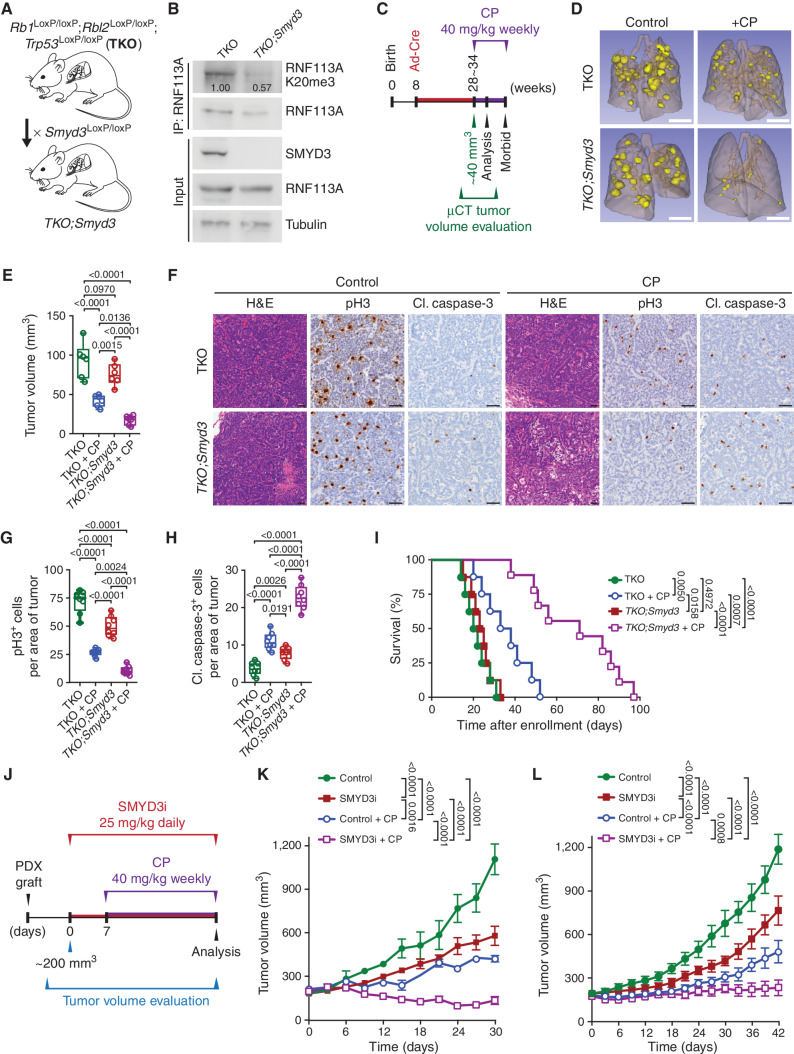
Small cell lung cancer (SCLC) is the most fatal form of lung cancer, with dismal survival, limited therapeutic options, and rapid development of chemoresistance. We identified the lysine methyltransferase SMYD3 as a major regulator of SCLC sensitivity to alkylation-based chemotherapy. RNF113A methylation by SMYD3 impairs its interaction with the phosphatase PP4, controlling its phosphorylation levels. This cross-talk between posttranslational modifications acts as a key switch in promoting and maintaining RNF113A E3 ligase activity, essential for its role in alkylation damage response. In turn, SMYD3 inhibition restores SCLC vulnerability to alkylating chemotherapy. Our study sheds light on a novel role of SMYD3 in cancer, uncovering this enzyme as a mediator of alkylation damage sensitivity and providing a rationale for small-molecule SMYD3 inhibition to improve responses to established chemotherapy.

Significance: SCLC rapidly becomes resistant to conventional chemotherapy, leaving patients with no alternative treatment options. Our data demonstrate that SMYD3 upregulation and RNF113A methylation in SCLC are key mechanisms that control the alkylation damage response. Notably, SMYD3 inhibition sensitizes cells to alkylating agents and promotes sustained SCLC response to chemotherapy. This article is highlighted in the In This Issue feature, p. 2007.


Figures

Figure 1.
Figure 1.
SMYD3 is a candidate regulator of SCLC susceptibility to alkylating chemotherapy. A, Synthetic lethality screening using a library composed of 285 characterized inhibitors, testing H209 SCLC cell sensitivity to alkylation damage by preactivated form of CP (4H-CP). Data represent the relative growth of H209 cells treated with a combination of 4H-CP (2.5 μmol/L) and different inhibitors (1 μmol/L each) compared with 4H-CP only (see Supplementary Table S1 and detailed description in the Methods). B,SMYD3 expression in different histologic subtypes of human lung cancer (GSE30219). The box plots show the distribution of SMYD3 expression in indicated lung cancer subtypes: lung squamous cell carcinomas (LUSC; n = 61), lung adenocarcinomas (LUAC; n = 85), large cell neuroendocrine tumors (LCNE; n = 56), SCLC (n = 20), and in adjacent normal lung tissue (n = 14). P values were calculated using the Kruskal−Wallis test. C, Representative IHC staining of SMYD3 in normal human lung (n = 8) and tumor biopsies obtained from patients with confirmed SCLC (n = 24). A magnification is provided. All 24 analyzed SCLC biopsies showed positive nuclear and cytoplasmic SMYD3 staining with H-score >180 in 20 samples and H-score >100 in 4 samples. Scale bars, 50 μm. D, Analysis of DMS-114 SCLC cell line growth response to increasing concentrations of 4H-CP with or without SMYD3i (EPZ031686) at the indicated concentrations. The percentage of viable cells was normalized to control vehicle-treated cells. P values were calculated by two-way ANOVA with the Tukey test for multiple comparisons. Data are represented as nonlinear regression with mean ± SEM. E, Quantification of 4H-CP and SMYD3i combination treatment synergy using the Loewe model. Loewe synergy score was calculated from DMS-114 cell survival assays (as in D, SynergyFinder 2.0). F, Schematic of xenografts and CP treatment schedule using SCLC H1092 cells modified to express a control nontargeting sgRNA (sgControl) or a Cas9/sgRNA targeting SMYD3 (sgSMYD3) complemented or not using either WT or F183 inactive mutant SMYD3, or treated with SMYD3i (EPZ031686). The cells were grafted subcutaneously to immunocompromised NOD. SCID-IL2Rg−/− (NSG) mice. G, Quantification of H1092 xenograft tumor volume (n = 5 mice, for each treatment group) is shown. Animals in control groups received placebo (vehicle) treatment. values were calculated by two-way ANOVA with Tukey testing for multiple comparisons. Data are represented as mean ± SEM. H, Quantification of H1092 xenograft tumor volume (n = 5 mice, for each treatment group) is shown. P values were calculated by two-way ANOVA with Tukey testing for multiple comparisons. Data are represented as mean ± SEM. In all panels, representative of at least three independent experiments is shown unless stated otherwise.
Figure 2.
Figure 2.
Identification of RNF113A as a novel methylated substrate of SMYD3. A, Recombinant SMYD3 was used for in vitro methylation reactions using radiolabeled S-adenosylmethionine and potential substrates. Top, autoradiogram of the methylation assay. Bottom, Coomassie stain of proteins in the reaction. B, H1092 SCLC cells were modified to express Cas9/sgRNA targeting MAP3K2 (sgMAP3K2) or control nontargeting sgRNA (sgControl). The cells were grafted subcutaneously to immunocompromised NSG mice. Once tumor volume reached 100 mm3, indicated animal groups were treated with CP and control groups received placebo (vehicle) treatment. Quantification of xenograft tumor volume growth is shown (n = 5 mice for each treatment group). P values were calculated by two-way ANOVA with the Tukey test for multiple comparisons. Data are represented as mean ± SEM. Representative immunoblot analysis of indicated cell lysates is shown. Tubulin is used as a loading control. C, Representative image showing recombinant SMYD3 in vitro methylation reaction on protein arrays (ProtoArray—containing more than 9,500 potential substrates) using radiolabeled S-adenosylmethionine as a methyl donor. Magnification shows the signals identified in square 43 of the Protoarray, corresponding to the indicated spotted proteins and controls. D,In vitro methylation assay as in A using potential substrates identified by ProtoArray. Top, autoradiogram of the methylation assay. Bottom, Coomassie stain of proteins in the reaction. E, Identification of RNF113A K20 trimethylation by bottom-up MS-based proteomic analysis of RNF113A methylated in vitro by SMYD3. Note that deuterated SAM was used as a methyl donor. F,In vitro methylation assay as in A with recombinant SMYD3 and WT RNF113A as well as K20A or K21A mutant proteins. Top, autoradiogram of the methylation assay. Bottom, Coomassie stain of proteins in the reaction. G, Detection of RNF113A methylation in 293T cells using the RNF113A K20me3 antibody after ectopic expression of SMYD3 and WT or K20A mutant RNF113A. In all panels, a representative of at least three independent experiments is shown unless stated otherwise.
Figure 3.
Figure 3.
SMYD3–RNF113A methylation signaling in SCLC cell lines. A, Immunodetection of endogenous RNF113A K20me3 following immunoprecipitation of total RNF113A in SCLC H69 cells transduced with shRNA targeting SMYD3 (shSMYD3) and a control nontargeting shRNA (shControl). Tubulin was used as a loading control. B, Immunoblot analysis with indicated antibodies as in A of H1048 SCLC cells expressing doxycycline-inducible shSMYD3 or treated with SMYD3i (EPZ031686). Tubulin was used as a loading control. C, Immunoblot analysis with indicated antibodies using lysates obtained from human SCLC cell lines representing all four molecular subtypes (NAPY) classified by expression of specific markers (NEUROD1+; ASCL1+; POU2F3+; YAP1+). GAPDH was used as a loading control. D,SMYD3 and RNF113A expression in human samples representing different molecular SCLC subtypes. Boxes represent 25th to 75th percentiles; whiskers: 10% to 90%; center line: median. P values were calculated by the Kruskal–Wallis test. Analyses were performed using FPKM data for each specified gene obtained from ref. . NAPY SCLC subclassification was based on the original classification from ref. . E, Analysis of DMS-114 SCLC cell line growth response to increasing concentrations of 4H-CP. Cells were transduced with doxycycline-inducible shSMYD3 and complemented with the expression of RNF113A or both SMYD3 and RNF113A. The percentage of viable cells under each condition was normalized to vehicle-treated (control) cells. Each condition represents the mean of three technical replicates from two independent experiments. P values were calculated by two-way ANOVA with the Tukey test for multiple comparisons. Data are represented as nonlinear regression with mean ± SEM. In all panels, representative of at least three independent experiments is shown unless stated otherwise. The numbers below the immunoblot lines represent the relative signal quantification (see also Supplementary Table S5).
Figure 4.
Figure 4.
RNF113A is a phosphoprotein and its methylation repels the phosphatase PP4. A, SILAC quantitative proteomics analysis of proteins that interact with RNF113A K20me0 and RNF113A K20me3 peptides. Data represent two independent experiments (forward and reverse directions). Proteins are plotted by their SILAC ratios in the forward (x-axis) and reverse (y-axis) experiments. Specific interactors of RNF113A K20me0 reside in the lower left quadrant. The four PP4 complex subunits are circled in blue. L/H, light over heavy fraction ratio. B, 293T cell extracts ectopically expressing HA-tagged PPP4R3a and PPP4c subunits were used for pulldowns with the indicated RNF113A peptides, followed by immunoblot analysis using the indicated antibodies. C, Immunoblot analysis of endogenous PPP4R3A following pulldowns with indicated RNF113A peptides using SCLC DMS-114 cell extract. D, Immunoblot analysis of recombinant PPP4R3A following pulldowns with the indicated RNF113A peptides. E, Immunoblot analysis of endogenous PPP4R3A pulldown using GST labeled recombinant RNF113A WT, K20A, K20R, and K20F mutants. F, Phosphorylation-dependent mobility shift of RNF113A on SDS-PAGE immunoblotting (indicated by arrows). HeLa cell extracts were treated with λ phosphatase (λ PPase), FastAP thermosensitive alkaline phosphatase (Fast AP), or calf intestinal alkaline phosphatase (CIP). Ku80 was used as a loading control. G, Identification of potential RNF113A phosphorylation sites based on the Phosphosite Plus references (y-axis) and confirmed by two independent mass spectrometry analyses (underlined residues; see also Supplementary Table S4). The schematic shows the sequence surrounding the methylated K20 and PPP4R3a binding motif (FxxP). Summary of phosphorylation and methylation site mutants of RNF113A generated in this study (bottom). H, Immunoblot confirmation of phosphorylation-dependent mobility shift of the indicated RNF113A mutants expressed in HeLa cells with or without CIP treatment. Ku80 was used as a loading control. I, Immunoblot analysis of RNF113A dephosphorylation assays using HA-RNF113A purified from HeLa cells, with either FastAP or PP4 phosphatases treatment followed by immunoblot analysis using a phospho-CDK-consensus motif antibody. In all panels, representative of at least three independent experiments is shown unless stated otherwise. The numbers below the immunoblot lines represent the relative signal quantification (see also Supplementary Table S5).
Figure 5.
Figure 5.
Methylation–phosphorylation cross-talk regulation of RNF113A affects its E3 ligase activity. A, Immunodetection of autoubiquitinated RNF113A after TUBE pulldowns using DMS-114, H69, and H1048 SCLC cell extracts following treatment with MMS. γH2A.X is shown as a marker of DNA damage induction. B, Immunodetection of autoubiquitinated RNF113A after TUBE pulldowns as in A, using HeLa cells extracts after treatment with different alkylating agents. γH2A.X is shown as a marker of DNA damage induction. C, Immunodetection of autoubiquitinated RNF113A after TUBE pulldowns as in A, using HeLa cells extracts after treatment with MMS versus different nonalkylating DNA-damaging agents. γH2A.X is shown as a marker of DNA damage induction. D,In vitro E3 ubiquitin ligase assays were performed with FLAG-HA-RNF113A purified from HeLa S3 cells with or without prior MMS treatment for the indicated duration. This was followed by immunoblot analysis with the indicated antibodies. E, Immunoblot analysis of total, phosphorylated, and methylated RNF113A immunoprecipitated from HeLa cells stably expressing HA-RNF113A, with or without prior MMS treatment for the indicated duration. F,In vitro E3 ubiquitin ligase assays were performed with WT or N5-mutant forms of RNF113A purified from HeLa S3 cells. This was followed by immunoblot analysis with the indicated antibodies. G,In vitro E3 ubiquitin ligase assays were performed as in F using WT or K20F-mutant forms of RNF113A purified from HeLa S3 cells treated with or without prior MMS treatment. Where indicated the E3 enzyme was preincubated with PP4 phosphatase. In all panels, representative of at least three independent experiments is shown unless stated otherwise. The numbers below the immunoblot lines represent the relative signal quantification (see also Supplementary Table S5).
Figure 6.
Figure 6.
RNF113A regulation affects its function in DNA dealkylation repair. A, Representative images of MMS-induced ASCC3 foci in shSMYD3 or shControl U2OS cells with or without prior MMS. Foci were monitored by immunofluorescent staining of ASCC3 (left) and the DNA damage marker γH2A.X (right). B, Quantification of ASCC3 foci formation from A. A minimum of 100 cells were quantified for each experimental condition. P values were calculated by a two-tailed unpaired Student t test, and error bars represent mean ± SD. C, Representative images of MMS-induced ASCC3 foci as in A in U2OS cells reconstituted with either RNF113A WT or K20F mutant after endogenous RNF113A knockdown by shRNA (shRNF113A). D, Quantification of ASCC3 foci formation from C. A minimum of 100 cells were counted for each experimental condition. P values were calculated by two-tailed unpaired Student t test, and error bars represent mean ± SD. E, Engineered HeLa cell viability assays using different concentrations of 4H-CP. Cells were stably transduced with inducible shRNA RNF113A (shRNF113A) and reconstituted with either WT RNF113A or the K20F mutant. The percentage of viable cells under each condition was normalized to untreated cells. Each condition represents the mean of three technical replicates from two independent experiments. P values were calculated by two-way ANOVA with Tukey testing for multiple comparisons. Data are represented as nonlinear regression with mean ± SEM. F, Immunoblots with indicated antibodies of cell lysates as in E with or without MMS treatment for the indicated duration and with or without the indicated recovery duration. G, Neutral comet assays depicting DNA double-stranded break repair in engineered HeLa cells as in F with representative examples of comet tails (top) and Olive moment quantification (bottom). A minimum of 150 comets were analyzed for each condition. P values were calculated by two-way ANOVA with the Tukey test for multiple comparisons. Data are represented as median with 95% CI. H, Model of SMYD3 participation in coordinating SCLC response to alkylating therapy through RNF113A methylation. In SCLC overexpressing SMYD3 (left), RNF113A activation leads to efficient dealkylation repair by ASCC and loss of cancer sensitivity to alkylation-based chemotherapy. Specific SMYD3 inhibition allows for RNF113A inactivation by PP4 and prevents RNF113A-mediated alkylation damage response, leading to sustained tumor growth inhibition by alkylating chemotherapy (right). In all panels, representative of at least three independent experiments is shown unless stated otherwise. The numbers below the immunoblot lines represent the relative signal quantification (see also Supplementary Table S5).
Figure 7.
Figure 7.
SMYD3 inhibition sensitizes SCLC to alkylating agents in vivo. A, Schematic of an SCLC mouse model with conditional deletion of Rb1, Rbl2, and Trp53 (TKO) and generation of conditional Smyd3 mutant in the TKO background (TKO;Smyd3). B, Immunoblot analysis of endogenous RNF113A K20me3 methylation following immunoprecipitation of total RNF113A in cell lines originating from TKO and TKO;Smyd3-mutant mice. SMYD3 is provided as a validation of successful Smyd3 deletion in TKO;Smyd3 mice. Tubulin was used as a loading control. C, Schematic of treatment procedures to induce SCLC in TKO and TKO;Smyd3-mutant mice followed by the evaluation of therapeutic response to CP. Tumor volume was evaluated by μCT. Animals were enrolled in the study once tumor volume reached approximately 40 mm3 for TKO control animals on average at 28 and TKO;Smyd3 at 35 weeks after tumor induction. Mice cohorts were analyzed at 15 days after enrollment after receiving two rounds of CP or were continuously treated with CP or vehicle (control) until signs of morbidity to establish overall survival. D, Representative μCT scans at 15 days after enrollment in TKO and TKO;Smyd3-mutant mice treated with vehicle (control) or CP (representative of n = 6 mice for each experimental group). Scale bars, 1 cm. E, Quantification of tumor volume in TKO and TKO;Smyd3-mutant mice treated with vehicle (control) or CP. Boxes represent 25th to 75th percentiles; whiskers: min. to max.; center line: median. P values were calculated by two-way ANOVA with the Tukey test for multiple comparisons. F, Representative hematoxylin and eosin (H&E) and IHC staining for cell proliferation marker phospho-Histone 3 (pH3) and apoptosis maker cleaved caspase-3 (cl. caspase-3) of lung tissue from vehicle (control) and CP-treated TKO and TKO;Smyd3-mutant mice (representative of n = 6 mice for each experimental group). Scale bars, 50 μm. G and H, Quantification of proliferation (pH3-positive cells; G) and apoptosis (cl. caspase-3–positive cells; H) in samples as in F. Boxes represent 25th to 75th percentiles; whiskers: min. to max.; center line: median. P values were calculated by two-way ANOVA with the Tukey test for multiple comparisons. I, Kaplan–Meier survival curves of control TKO (med. survival post enrollment: 21 days, n = 8), control TKO;Smyd3 (med. survival post enrollment: 24 days, n = 8), TKO + CP treatment (med. survival post enrollment: 35.5 days, n = 8) and TKO;Smyd3 + CP treatment (med. survival post enrollment: 71 days, n = 9). P values were calculated by the log-rank test. J, Schedule protocol for SCLC PDX treatment with CP and SMYD3 inhibitor EPZ031686 (SMYD3i). Mice undergoing monotherapy also received vehicle treatment. K and L, Tumor volume quantification for patient-derived SCLC xenografts obtained from therapy-naïve (K) and treated with standard chemotherapy (carboplatin and etoposide) patient (L) grafted subcutaneously to immunocompromised NSG mice (n = 6 mice, for each treatment group). P values were calculated by two-way ANOVA with the Tukey test for multiple comparisons. Data are represented as mean ± SEM. In all panels, representative of at least three independent experiments is shown unless stated otherwise. The numbers below the immunoblot lines represent the relative signal quantification (see also Supplementary Table S5).

Comment in

  • doi: 10.1158/2159-8290.CD-12-9-ITI

References

    1. Sabari JK, Lok BH, Laird JH, Poirier JT, Rudin CM. Unravelling the biology of SCLC: implications for therapy. Nat Rev Clin Oncol 2017;14:549–61. - PMC - PubMed
    1. Chan BA, Coward JIG. Chemotherapy advances in small-cell lung cancer. J Thorac Dis 2013;5:S565–578. - PMC - PubMed
    1. Grunberg SM. Cyclophosphamide and etoposide for non-small cell and small cell lung cancer. Drugs 1999;58:11–5. - PubMed
    1. Pujol JL, Daurès JP, Rivière A, Quoix E, Westeel V, Quantin X, et al. . Etoposide plus cisplatin with or without the combination of 4′-epidoxorubicin plus cyclophosphamide in treatment of extensive small-cell lung cancer: a French Federation of Cancer Institutes multicenter phase III randomized study. J Natl Cancer Inst 2001;93:300–8. - PubMed
    1. Jiang L, Yang KH, Guan QL, Mi DH, Wang J. Cisplatin plus etoposide versus other platin-based regimens for patients with extensive small-cell lung cancer: a systematic review and meta-analysis of randomised, controlled trials. Intern Med J 2012;42:1297–309. - PubMed

Publication types

MeSH terms

Substances