. 2022 Aug 1;154(8):e202213164.
doi: 10.1085/jgp.202213164. Epub 2022 Jul 12.

TMEM120A/TACAN inhibits mechanically activated PIEZO2 channels

Affiliations

TMEM120A/TACAN inhibits mechanically activated PIEZO2 channels

John Smith Del Rosario et al. J Gen Physiol. .

Abstract

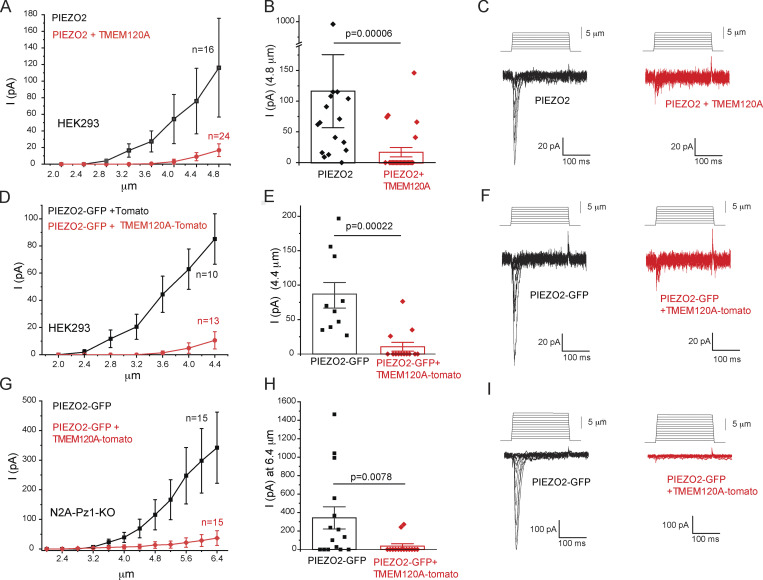
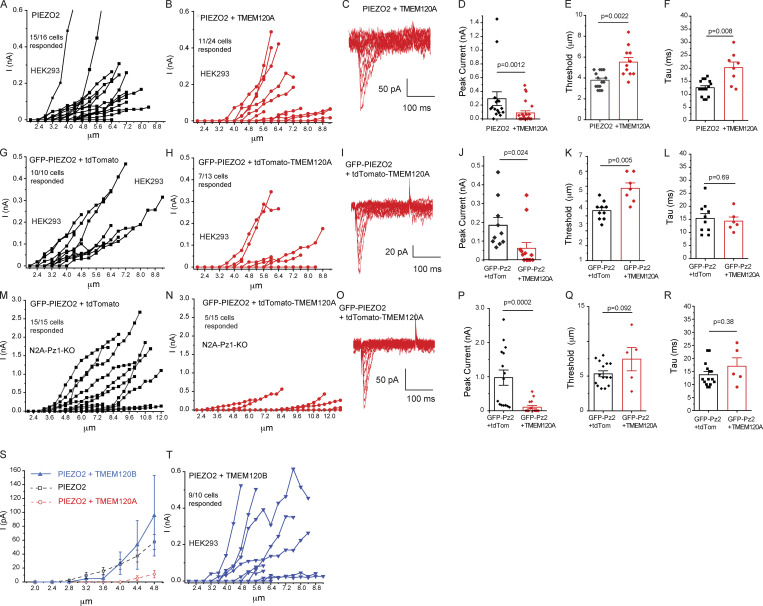
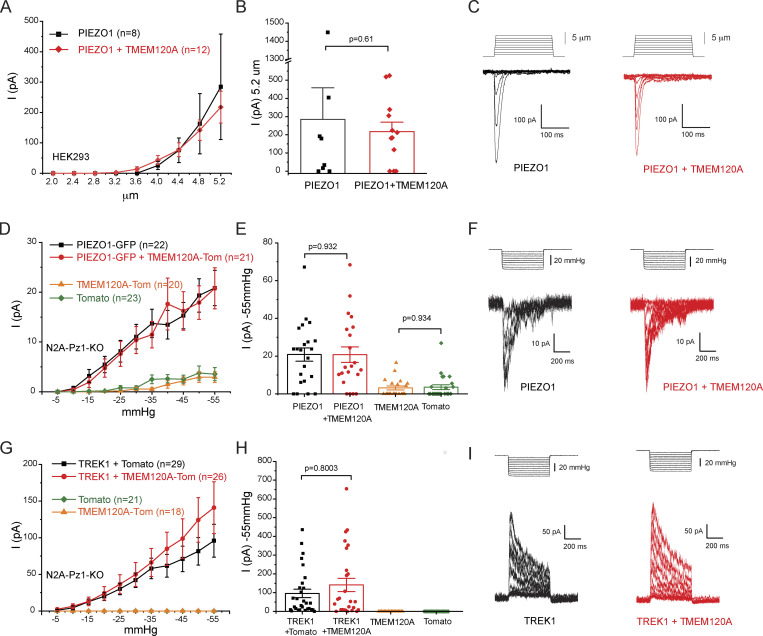
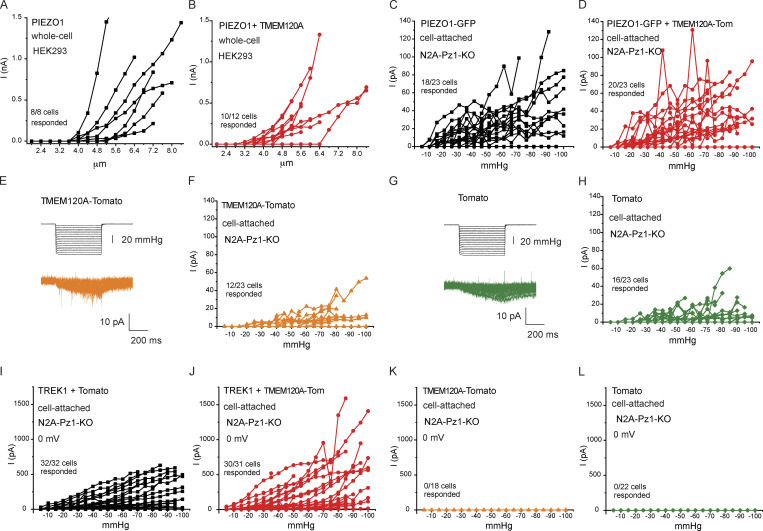
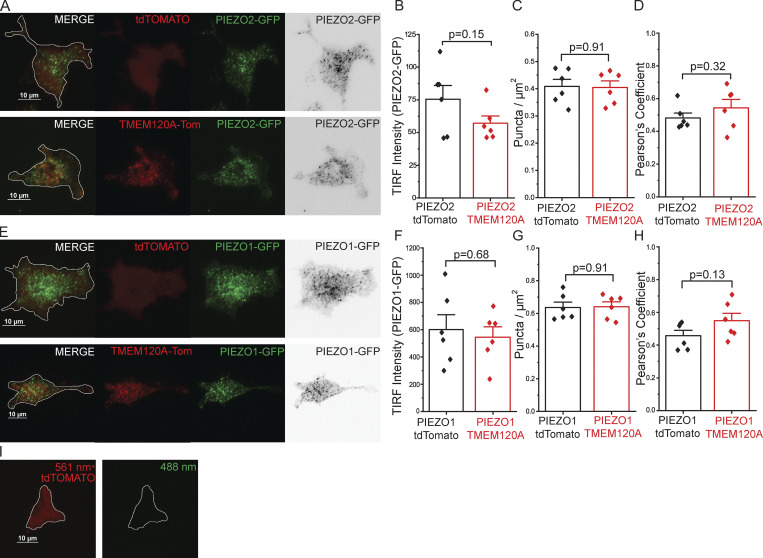
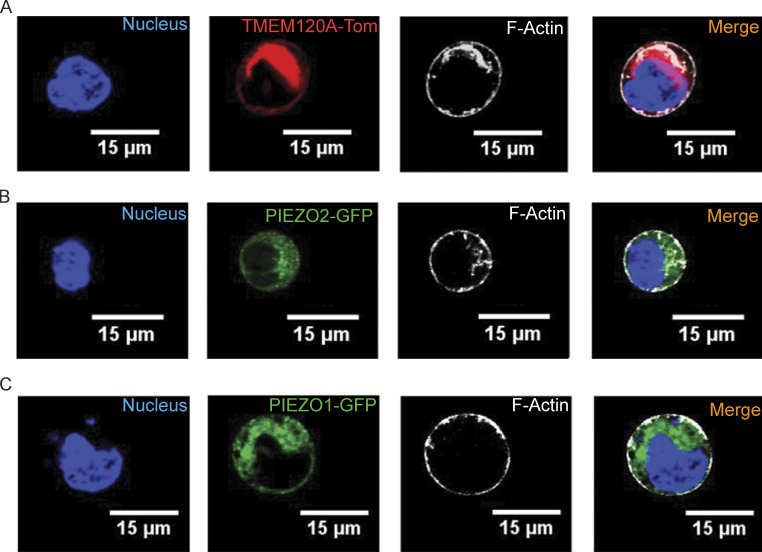
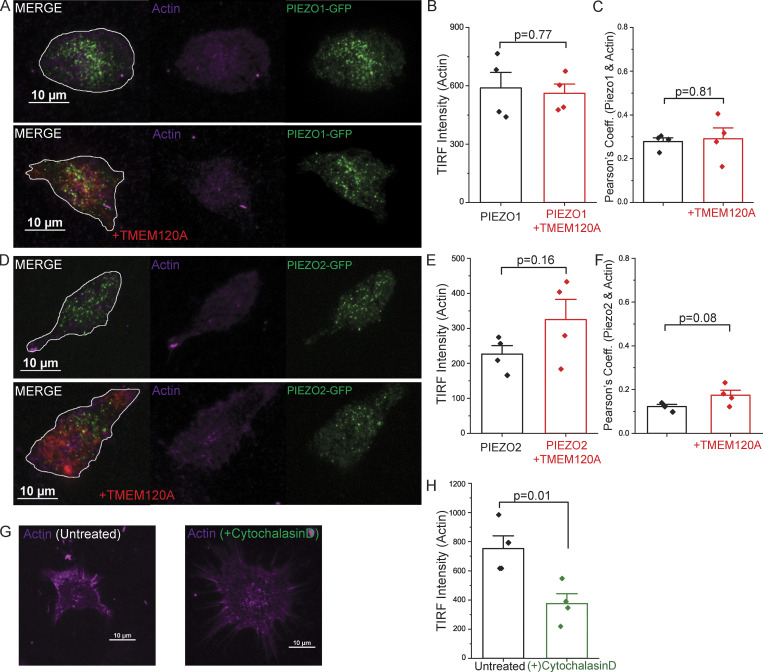
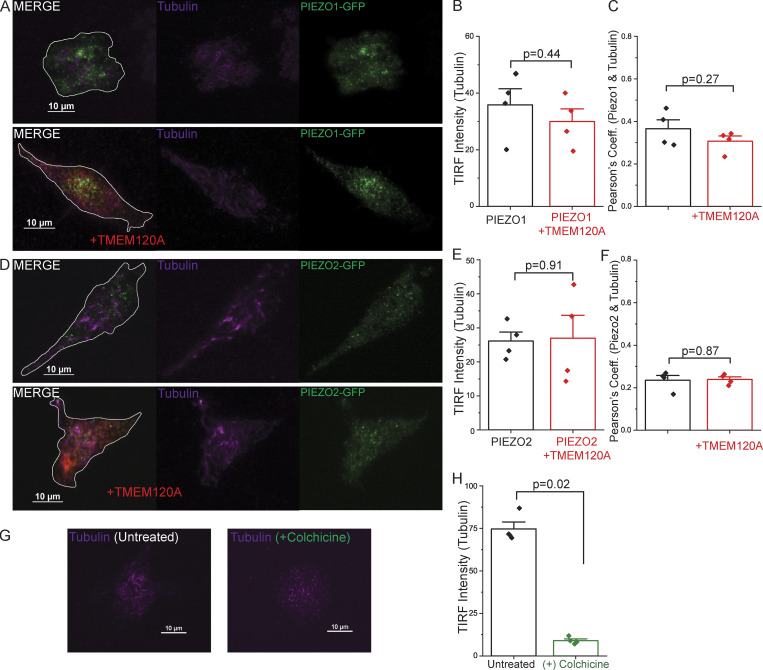
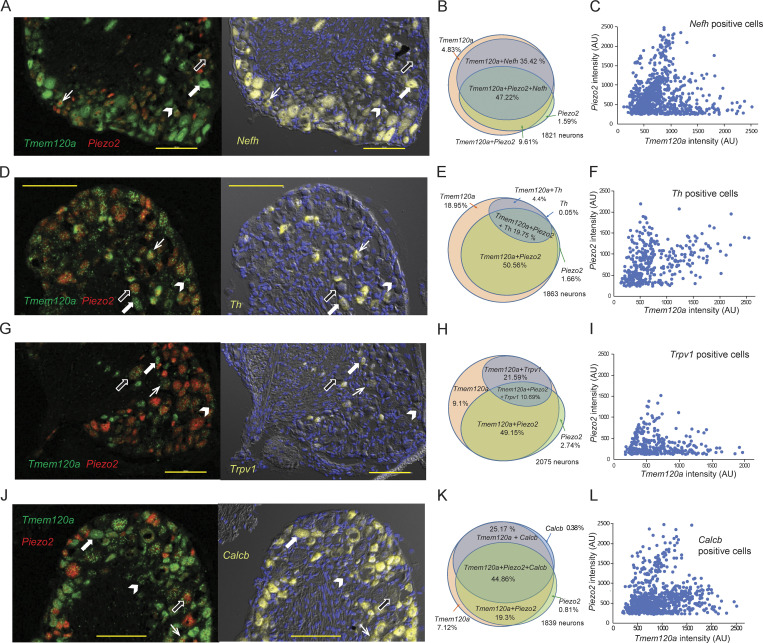
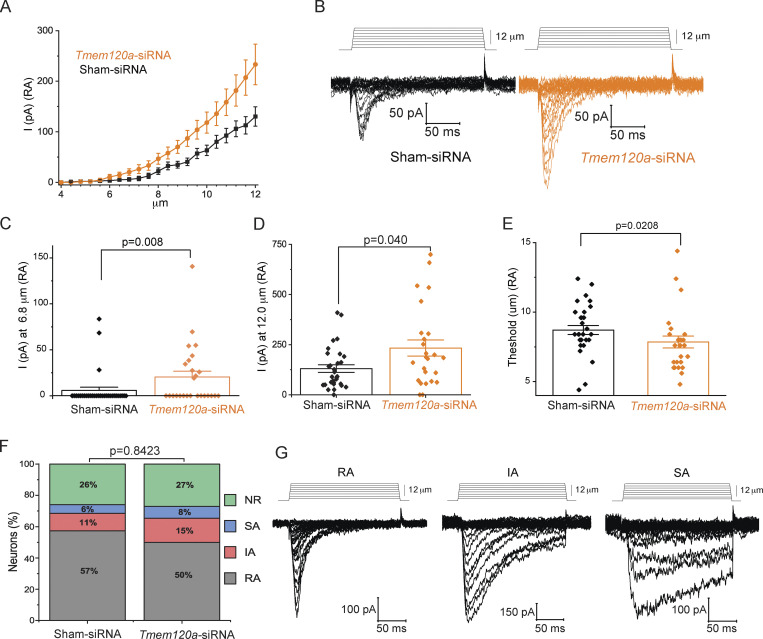
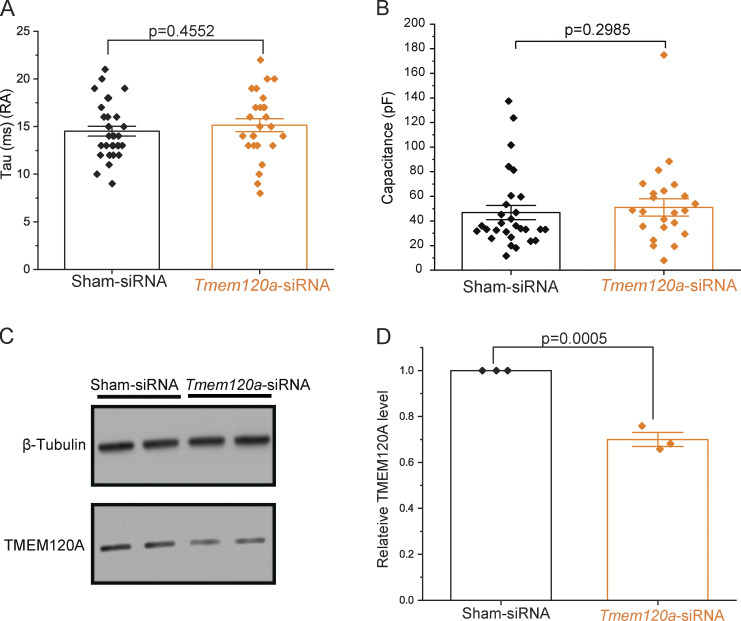
PIEZO2 channels mediate rapidly adapting mechanically activated currents in peripheral sensory neurons of the dorsal root ganglia (DRG), and they are indispensable for light touch and proprioception. Relatively little is known about what other proteins regulate PIEZO2 activity in a cellular context. TMEM120A (TACAN) was proposed to act as a high threshold mechanically activated ion channel in nociceptive DRG neurons. Here, we find that Tmem120a coexpression decreased the amplitudes of mechanically activated PIEZO2 currents and increased their threshold of activation. TMEM120A did not inhibit mechanically activated PIEZO1 and TREK1 channels and TMEM120A alone did not result in the appearance of mechanically activated currents above background. Tmem120a and Piezo2 expression in mouse DRG neurons overlapped, and siRNA-mediated knockdown of Tmem120a increased the amplitudes of rapidly adapting mechanically activated currents and decreased their thresholds to mechanical activation. Our data identify TMEM120A as a negative modulator of PIEZO2 channel activity, and do not support TMEM120A being a mechanically activated ion channel.


Figures

Figure 1.
Figure 1.
TMEM120A inhibits PIEZO2 currents. Whole-cell patch-clamp experiments at −60 mV in cells transiently transfected with Piezo2 with or without Tmem120a were performed as described in the Materials and methods section. (A) HEK293 cells were transfected with Piezo2 and GFP with or without Tmem120a. In some cells, GFP-tagged Piezo2 was used instead of Piezo2 plus GFP. Current amplitudes are plotted (mean ± SEM) for Piezo2 expressing cells (black) and for cells expressing Piezo2 and Tmem120a (red). (B) Scatter plots and mean ± SEM for current amplitudes at 4.8 μm indentation. Statistical significance was calculated with the Mann-Whitney test. (C) Representative current traces. (D) HEK293 cells were transfected with GFP-tagged Piezo2 and with tdTomato-tagged Tmem120a or tdTomato. Current amplitudes are plotted (mean ± SEM) for Piezo2 expressing cells (black) and for cells expressing Piezo2 and Tmem120a (red). (E) Scatter plots and mean ± SEM for current amplitudes at 4.4 μm indentation. Statistical significance was calculated with the Mann-Whitney test. (F) Representative current traces. (G) Piezo1 deficient N2A cells were transfected with GFP-tagged Piezo2 and with tdTomato-tagged Tmem120a or tdTomato. Current amplitudes (mean ± SEM) are plotted for Piezo2 expressing cells (black) and for cells expressing Piezo2 and Tmem120a (red). (H) Scatter plots and mean ± SEM for current amplitudes at 6.4 μm indentation. Statistical significance was calculated with the Mann-Whitney test. (I) Representative current traces.
Figure S1.
Figure S1.
TMEM120A but not TMEM120B inhibits PIEZO2 currents. Data from Fig. 1 showing the full range of measurements with indentation depth increased until seals were lost. (A and B) Data from HEK293 cells transfected with Piezo2 and Tmem120A. (C) Representative traces for increasing indentation depth till 7.2 μm. (D) Peak current amplitudes regardless of indentation depth. (E) Mechanical threshold of responding cells. (F) Inactivation time constant (tau). (G and H) Data from HEK293 cells transfected with GFP-Piezo2 and tdTomato-Tmem120A. (I) Representative traces for indentation depths till 8.4 μm. (J) Peak current amplitudes regardless of indentation depth. (K) Mechanical threshold of responding cells. (L) Inactivation time constant (tau). (M and N) Data from Piezo1 deficient N2A cells transfected with GFP-Piezo2 and tdTomato-Tmem120A. (O) Representative traces for indentation depths till 11.6 μm. (P) Peak current amplitudes regardless of indentation depth. (Q) Mechanical threshold of responding cells. (R) Inactivation time constant (tau). (S) Whole-cell patch-clamp data from HEK293 cells transfected with Piezo2 and Tmem120B, mean ± SEM of current amplitudes as a function of indentation depth. For PIEZO2 alone and PIEZO2 + TMEM120A data were replotted from Fig. 1 (dashed lines). (T) Data for full the range of indentations. Statistical significance was calculated with two-sample t test (F, K, L, and Q) or Mann-Whitney test (D, E, J, P, and R). Data are shown as mean ± SEM and scatter plots.
Figure 2.
Figure 2.
TMEM120A does not inhibit PIEZO1 and TREK1 currents. (A) HEK293 cells were transfected with Piezo1 in IRES-GFP vector, with or without Tmem120a. Mechanically activated currents were evoked by increasing indentations with a blunt glass probe in whole-cell patch-clamp experiments. Current amplitudes are plotted (mean ± SEM) for Piezo1 expressing cells (black) and for cells expressing Piezo1 and Tmem120a (red). (B) Scatter plots and mean ± SEM for current amplitudes at 5.2 μm indentation. Statistical significance was calculated with the Mann-Whitney test. (C) Representative current traces. (D) Piezo1 deficient N2A cells were transfected with GFP-Piezo1 with or without Tmem120a-tdTomato, and with tdTomato-Tmem120a alone or tdTomato alone. Mechanically activated currents were evoked by applying increasing negative pressures through the patch pipette in cell-attached patch-clamp experiments. Measurements were performed at −80 mV holding potential. Current amplitudes are plotted (mean ± SEM) for cells expressing Piezo1 (black), Piezo1 and Tmem120a (red), Tmem120a alone (orange), and tdTomato alone (green). (E) Scatter plots and mean ± SEM for current amplitudes at −55 mmHg. Statistical significance was calculated with the Mann-Whitney test. (F) Representative current traces. (G) Piezo1 deficient Neuro2A cells were transfected with TREK1 with, or without Tmem120a-tdTomato, and with Tmem120a-tdTomato alone or tdTomato alone. Mechanically activated currents were evoked by applying increasing negative pressures through the patch pipette in cell-attached patch-clamp experiments. Measurements were performed at 0 mV holding potential. Current amplitudes are plotted (mean ± SEM) for cells expressing TREK1 (black), TREK1 and Tmem120a (red), Tmem120a alone (orange), and tdTomato alone (green). (H) Scatter plots and mean ± SEM for current amplitudes at −55 mmHg. Statistical significance was calculated with the Mann-Whitney test. (I) Representative current traces.
Figure S2.
Figure S2.
TMEM120A does not inhibit PIEZO1 and TREK1 currents. Data from Fig. 2 showing the full range of measurements with indentation depth or negative pressure increased until the seal was lost. (A and B) Data from whole-cell patch-clamp experiments in HEK293 cells transfected with Piezo1 alone or Tmem120a + Piezo1. (C and D) Data from cell-attached patch clamp experiments in Piezo1 deficient N2A cells transfected with Piezo1 alone or Tmem120a + Piezo1. (E) Representative traces for cell-attached patch clamp experiments in N2A cell transfected with tdTomato-Tmem120a. (F) Full range of data from cell-attached patch-clamp experiments in N2A cell transfected with tdTomato-Tmem120a. (G) Representative traces for cell-attached patch-clamp experiments in N2A cell transfected with tdTomato. (H) Full range of data from cell-attached patch-clamp experiments in N2A cells transfected with tdTomato. (I–L) Full range of data from cell-attached patch-clamp experiments at 0 mV in N2A cells transfected with TREK1 + tdTomato (I), TREK1 + tdTomato-Tmem120a (J), tdTomato-Tmem120a alone (K), and tdTomato alone (L). The slight discrepancy in the number of cells compared to Fig. 2 in C, D, F, and I–L is because these panels include cells where the seal was lost before the negative pressure reached 55 mmHg, and those cells were excluded from Fig. 2.
Figure S3.
Figure S3.
TMEM120A shows only weak colocalization with PIEZO1 or PIEZO2, and does not change their cell-surface expression. TIRF microscopy was performed as described in the Materials and methods section. (A) Representative TIRF images for HEK293 cell transfected with tdTomato-Tmem120a and GFP-Piezo2 (bottom) and tdTomato and GFP-Piezo2 (top). (B) Summary data for the fluorescence intensity for GFP-PIEZO2 in the TIRF mode for cells cotransfected with tdTomato or tdTomato-Tmem120a. (C) Number of GFP-PIEZO2 puncta per μm. (D) Pearson’s coefficient for colocalization of tdTomato-TMEM120A with GFP-PIEZO2 and tdTomato with GFP-PIEZO2. (E) Representative TIRF images for HEK293 cell transfected with tdTomato-Tmem120a and GFP-Piezo1 (bottom) and tdTomato and GFP-Piezo1 (top). (F) Summary data for the fluorescence intensity for GFP-PIEZO1 in the TIRF mode for cell cotransfected with tdTomato or tdTomato-Tmem120a. (G) Number of GFP-PIEZO1 puncta per μm. (H) Pearson’s coefficient for colocalization of tdTomato-TMEM120A with GFP-PIEZO1 and tdTomato with GFP-PIEZO1. (I) Representative image of cell expressing only tdTomato with 561-nm laser (left) and 488-nm laser (right). Bar graphs show mean ± SEM and scatter plots. Individual symbols show the average value of cells for one coverslip (5–22 cells/coverslip) from two independent transfection. Statistical significance was calculated with two-sample t test.
Figure S4.
Figure S4.
TMEM120A is broadly distributed throughout cells. HEK293 cells were transfected with tdTomato-Tmem120a, GFP-Piezo1 or GFP-Piezo2, labeled with Sir-Actin, and confocal images were obtained as described in the Materials and methods section. (A) Representative confocal images of tdTomato-TMEM120A and Sir-Actin. (B) Representative confocal images of GFP-PIEZO2 and Sir-Actin, which labels F-Actin. (C) Representative confocal images of GFP-PIEZO1 and Sir-Actin. Two independent transfections were performed and 26–30 cells per group were imaged.
Figure S5.
Figure S5.
TMEM120A does not affect the actin cytoskeleton. HEK293 cells were transfected with tdTomato-Tmem120A and GFP-Piezo1 or GFP-Piezo2, labeled with Sir-Actin, and TIRF images were obtained as described in the Materials and methods section. (A) Representative TIRF images for GFP-PIEZO1 and Sir-Actin. Cell outlines displayed in white on merged images. (B) TIRF intensity of Sir-Actin with and without TMEM120A. (C) Pearson’s coefficient for colocalization of GFP-PIEZO1 and Sir-Actin with and without TMEM120A. (D) Representative TIRF images for GFP-PIEZO2 and Sir-Actin. Cell outlines displayed in white on merged images. (E) TIRF intensity of Sir-Actin with and without TMEM120A. (F) Pearson’s coefficient for colocalization of GFP-PIEZO2 and Sir-Actin with and without TMEM120A. (G) Representative TIRF images for Sir-Actin in untreated and cytochalasin D treated cells. (H) TIRF intensity of Sir-Actin with and without cytochalasin D treatment. Bar graphs show mean ± SEM and scatter plots. Individual symbols show the average value of cells for one coverslip (5–22 cells/coverslip) from two independent transfections. Statistical significance was calculated with the two-sample t test.
Figure S6.
Figure S6.
TMEM120A does not affect the tubulin cytoskeleton. HEK293 cells were transfected with tdTomato-Tmem120A and GFP-Piezo1 or GFP-Piezo2, labeled with Spy650-tubulin, and TIRF images were obtained as described in the Materials and methods section. (A) Representative TIRF images for GFP-PIEZO1 and Spy650-tubulin. Cell outlines displayed in white on merged images. (B) TIRF intensity of Spy650-tubulin with and without TMEM120A. Statistical significance was calculated using the two-sample t test. (C) Pearson’s coefficient for colocalization of GFP-PIEZO1 and Spy650-tubulin with and without TMEM120A. Statistical significance was calculated using the two-sample t test. (D) Representative TIRF images for GFP-PIEZO2 and Spy650-tubulin. Cell outlines displayed in white on merged images. (E) TIRF intensity of Spy650-tubulin. Statistical significance was calculated using the Welch’s t test. (F) Pearson’s coefficient for colocalization of GFP-PIEZO2 and Spy650-tubulin with and without TMEM120A. Statistical significance was calculated using the two-sample t test. (G) Representative TIRF images for Spy650-tubulin in untreated and colchicine treated cells. (H) TIRF intensity of Spy650-tubulin with and without colchicine treatment. Statistical significance was calculated with the Mann-Whitney test. Bar graphs show mean ± SEM and scatter plots. Individual symbols show the average value of cells for one coverslip (5–22 cells/coverslip) from two independent transfections.
Figure 3.
Figure 3.
Tmem120a and Piezo2 are coexpressed in various DRG populations. RNAScope fluorescence in situ hybridization on mouse DRGs was performed as described in the methods section, with probes for Tmem120a, Piezo2, and four different neuronal markers. The data represent three independent DRG preparations, and two to three slices per condition for each preparation. Arrows in representative images show cells that express: Tmem120a and neuronal marker (white wide arrow), Tmem120a and Piezo2 and neuronal marker (white arrow), Tmem120a (arrowhead), and Tmem120a + Piezo2 (black wide arrow). Horizontal yellow lines indicate 100 μm on each image. (A) Left panel: Representative image for DRGs labeled with Tmem120a (green) and Piezo2 (red). Right panel: The same section labeled with Nefh (yellow). The section was also stained with DAPI to label nuclei. (B) Venn diagram showing coexpression of Tmem120a, Piezo2, and Nefh. (C) Intensity of Piezo2 labeling as a function of Tmem120a signal for individual cells that was positive for Nefh. For both Tmem120a and Piezo2, cells that were below the threshold for counting as positive for Tmem120a or Piezo2 are not shown. (D) Representative images for DRGs labeled with Tmem120a (green) and Piezo2 (red) and Th (yellow). (E) Venn diagram showing coexpression of Tmem120a, Piezo2, and Th. (F) Intensity of Piezo2 labeling as a function of Tmem120a signal for individual cells that were positive for Th. (G) Representative images for DRGs labeled with Tmem120a (green) and Piezo2 (red) and Trpv1 (yellow). (H) Venn diagram showing coexpression of Tmem120a, Piezo2, and Trpv1. (I) Intensity of Piezo2 labeling as a function of Tmem120a signal for individual cells that were positive for Trpv1. (J) Representative images for DRGs labeled with Tmem120a (green) and Piezo2 (red) and Calcb (CGRP2; yellow). (K) Venn diagram showing coexpression of Tmem120a, Piezo2, and Calcb. (L) Intensity of Piezo2 labeling as a function of Tmem120a signal for individual cells that was positive for Calcb. AU, arbitrary units.
Figure 4.
Figure 4.
TMEM120A negatively regulates rapidly adapting mechanically activated currents in mouse DRG neurons. Mouse DRG neurons were transfected with Tmem120a-siRNA or nontargeting negative control siRNA (Sham-siRNA) as described in the Materials and methods section. Whole-cell patch-clamp experiments were performed at −60 mV with mechanically activated currents evoked by increasing indentation with a blunt glass probe. (A) DRG neurons with rapidly adapting (RA) inactivation kinetics indicative of native Piezo2 were measured. Current amplitudes are plotted (mean ± SEM) for Sham-siRNA neurons with RA kinetics (black) and for Tmem120a -siRNA neurons with RA kinetics (orange). (B) Representative RA-type current traces. (C and D) Scatter plots and mean ± SEM for current amplitudes at 6.8 and 12.0 μm indentations. (E) Scatter plots and mean ± SEM for mechanical threshold (blunt glass probe indentation depth required to elicit RA type currents). (F) Percentage of cells displaying RA, intermediate adapting (IA), and slow adapting (SA) currents and nonresponding neurons (NR) for those transfected with Sham-siRNA and Tmem120a -siRNA. The electrophysiology data are from four independent DRG neuron preparations and transfections, n = 54 for Sham-siRNA, and n = 52 for Tmem120a -siRNA. Statistical significance was assessed using the chi-squared test. (G) Representative RA, IA, and SA current traces. Statistical significance for C–E was calculated with the Mann-Whitney test.
Figure S7.
Figure S7.
TMEM120A negatively regulates rapidly adapting mechanically activated currents in mouse DRG neurons. Data from Fig. 4 showing further analysis of Tmem120a-siRNA in mouse DRG neurons and knockdown confirmation in N2A cells. (A) Scatter plots and mean ± SEM for the inactivation time constant (tau) for rapidly adapting (RA) currents. Statistical significance was calculated with two-sample t test. (B) Scatter plots and mean ± SEM of capacitance for neurons displaying RA currents. Statistical significance calculated with the Mann-Whitney test. (C) Piezo1 deficient Neuro2A cells were transfected with Sham-siRNA or Tmem120a-siRNA for Western blot analysis as described in the methods section. Representative Western blot image with β-tubulin antibody application (top panel) and TMEM120A antibody application (bottom panel). (D) The ratio of TMEM120A band intensity to β-tubulin for each Western blot (three independent transfections) was normalized to Sham-siRNA, scatter plots, and mean ± SEM. Statistical significance calculated with two-sample t test. Source data are available for this figure: SourceData FS7.

Similar articles

Cited by

References

    1. Anderson, E.O., Schneider E.R., Matson J.D., Gracheva E.O., and Bagriantsev S.N.. 2018. TMEM150C/Tentonin3 is a regulator of mechano-gated ion channels. Cell Rep. 23:701–708. 10.1016/j.celrep.2018.03.094 - DOI - PMC - PubMed
    1. Assaraf, E., Blecher R., Heinemann-Yerushalmi L., Krief S., Carmel Vinestock R., Biton I.E., Brumfeld V., Rotkopf R., Avisar E., Agar G., and Zelzer E.. 2020. Piezo2 expressed in proprioceptive neurons is essential for skeletal integrity. Nat. Commun. 11:3168. 10.1038/s41467-020-16971-6 - DOI - PMC - PubMed
    1. Batrakou, D.G., de Las Heras J.I., Czapiewski R., Mouras R., and Schirmer E.C.. 2015. TMEM120A and B: Nuclear envelope transmembrane proteins important for adipocyte differentiation. PLoS One. 10:e0127712. 10.1371/journal.pone.0127712 - DOI - PMC - PubMed
    1. Beaulieu-Laroche, L., Christin M., Donoghue A., Agosti F., Yousefpour N., Petitjean H., Davidova A., Stanton C., Khan U., Dietz C., et al. . 2020. TACAN is an ion channel involved in sensing mechanical pain. Cell. 180:956–967.e17. 10.1016/j.cell.2020.01.033 - DOI - PubMed
    1. Besch, S.R., Suchyna T., and Sachs F.. 2002. High-speed pressure clamp. Pflugers Arch. 445:161–166. 10.1007/s00424-002-0903-0 - DOI - PubMed

Publication types