

Trends in Adverse Event Rates in Hospitalized Patients, 2010-2019
- PMID: 35819424
- PMCID: PMC9277501
- DOI: 10.1001/jama.2022.9600
Trends in Adverse Event Rates in Hospitalized Patients, 2010-2019
Abstract
Importance: Patient safety is a US national priority, yet lacks a comprehensive assessment of progress over the past decade.
Objective: To determine the change in the rate of adverse events in hospitalized patients.
Design, setting, and participants: This serial cross-sectional study used data from the Medicare Patient Safety Monitoring System from 2010 to 2019 to assess in-hospital adverse events in patients. The study included 244 542 adult patients hospitalized in 3156 US acute care hospitals across 4 condition groups from 2010 through 2019: acute myocardial infarction (17%), heart failure (17%), pneumonia (21%), and major surgical procedures (22%); and patients hospitalized from 2012 through 2019 for all other conditions (22%).
Exposures: Adults aged 18 years or older hospitalized during each included calendar year.
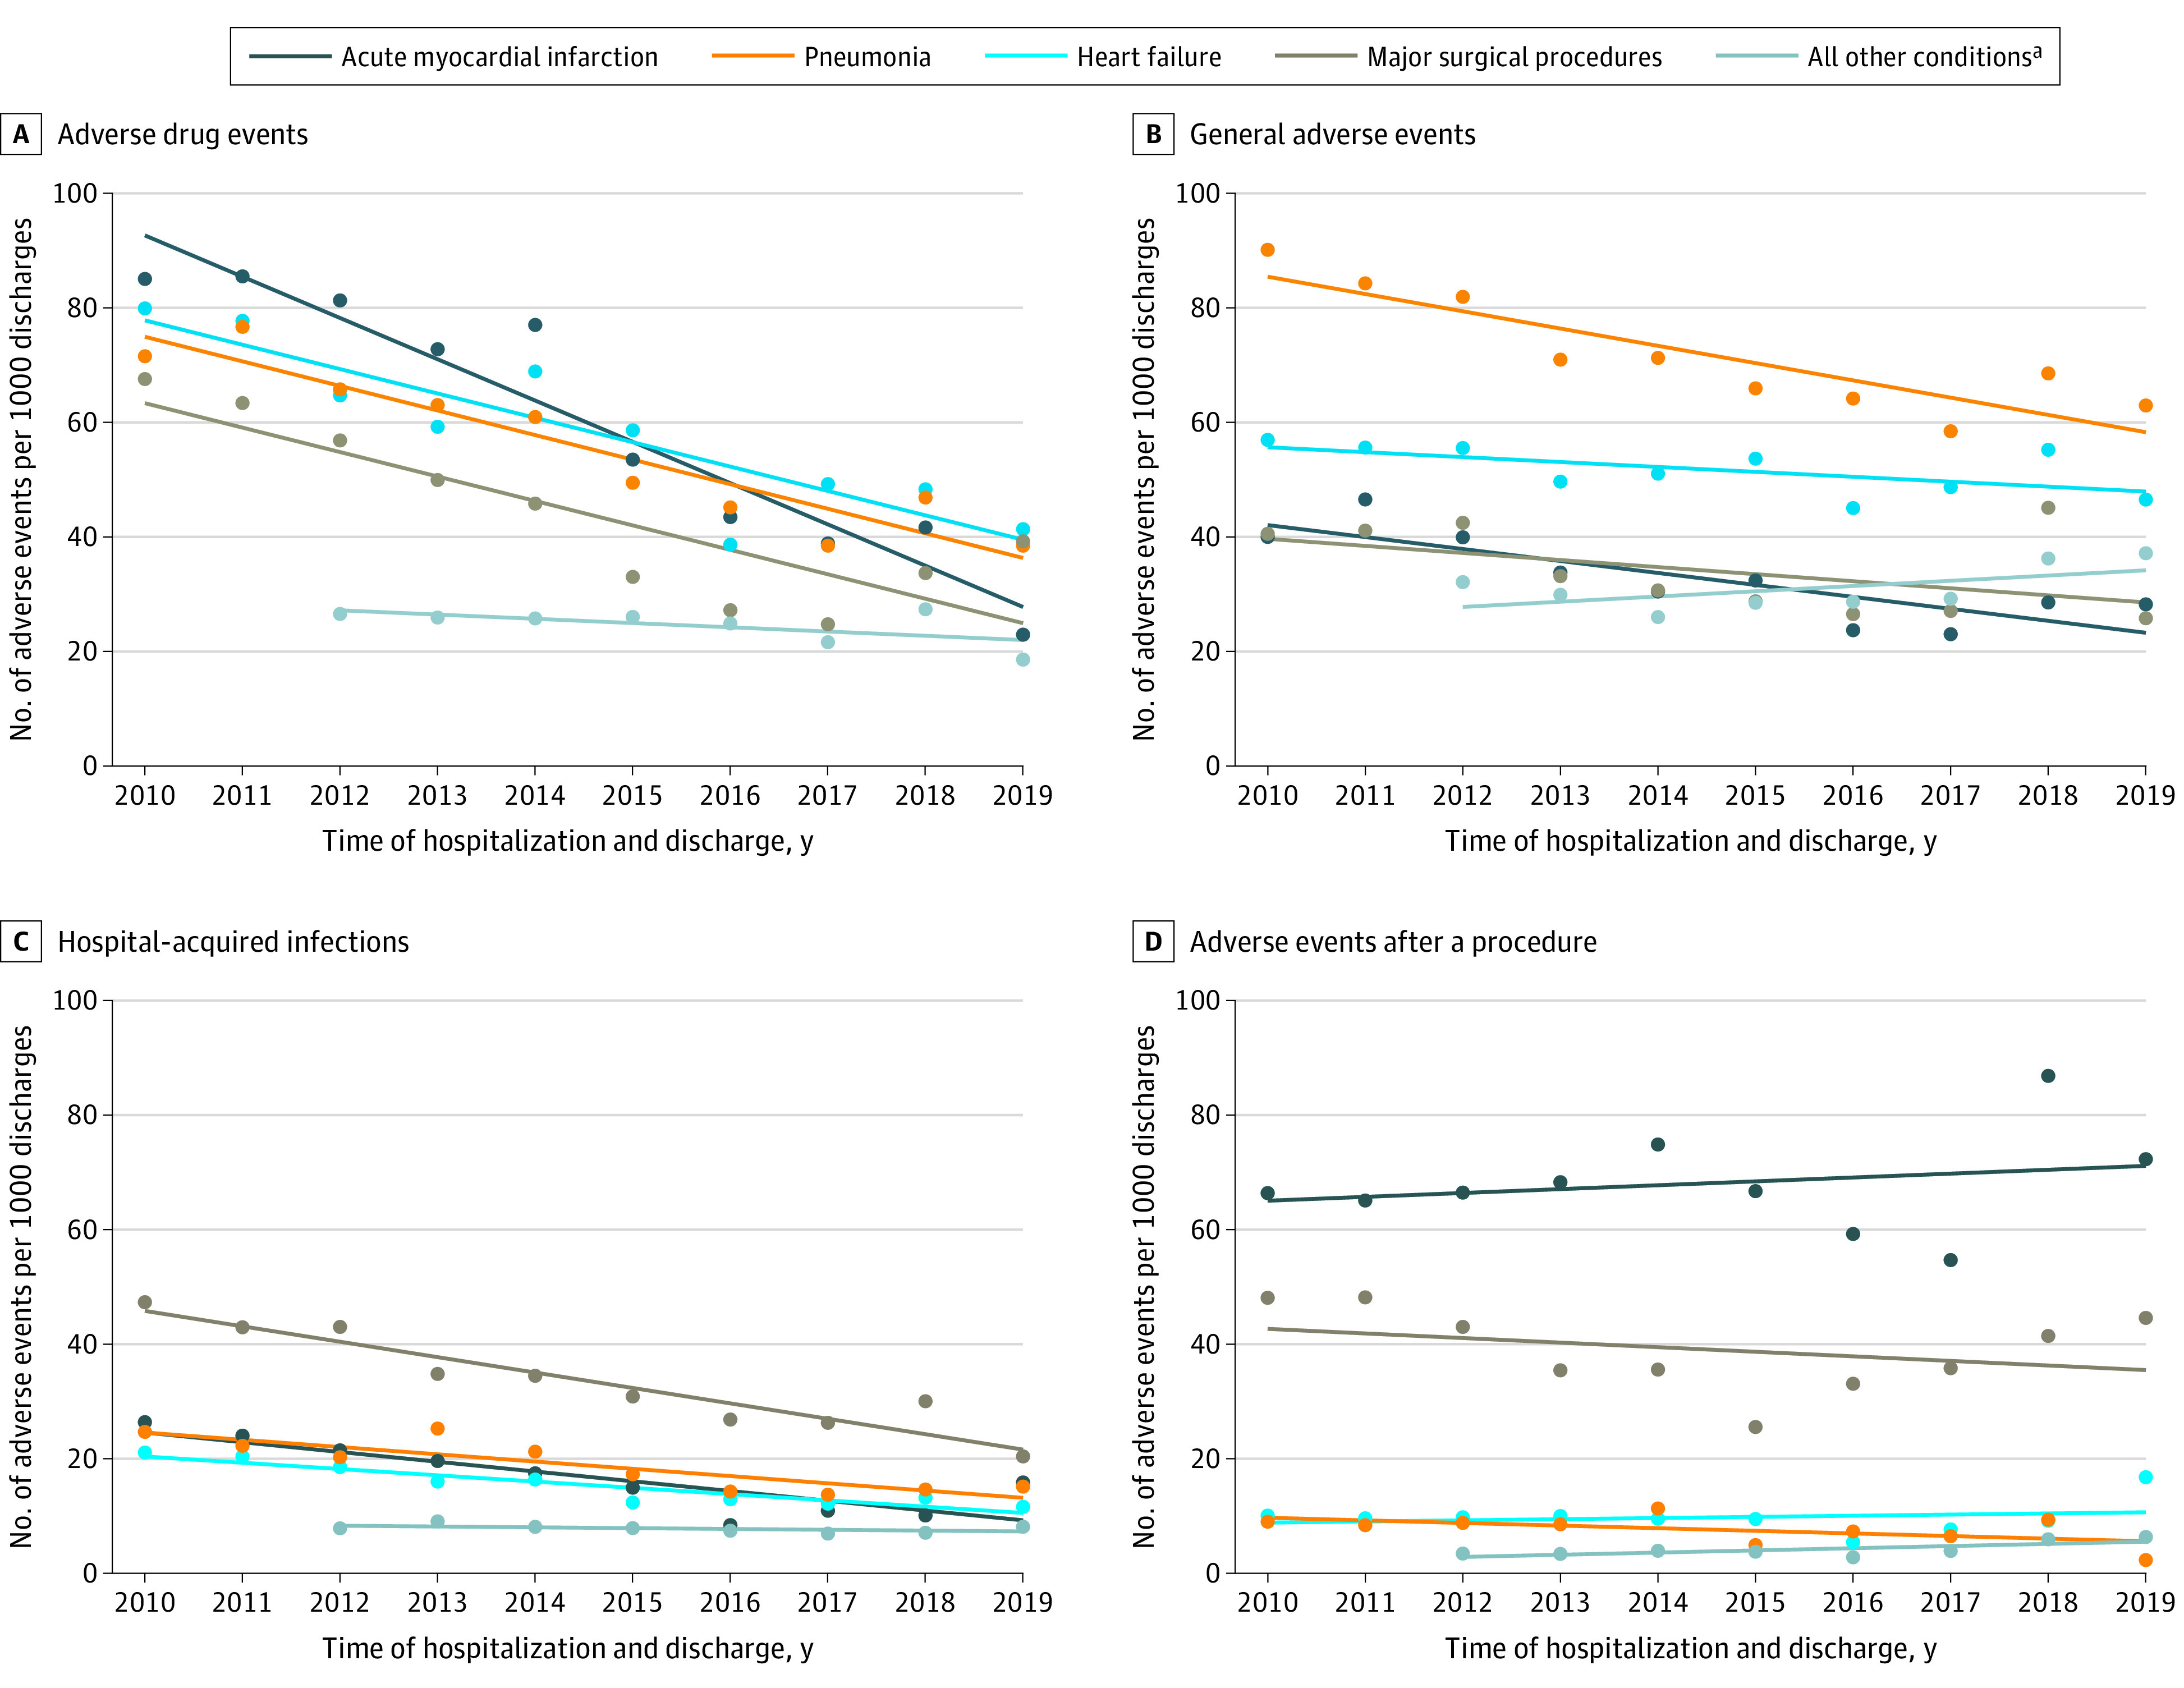
Main outcomes and measures: Information on adverse events (abstracted from medical records) included 21 measures across 4 adverse event domains: adverse drug events, hospital-acquired infections, adverse events after a procedure, and general adverse events (hospital-acquired pressure ulcers and falls). The outcomes were the total change over time for the observed and risk-adjusted adverse event rates in the subpopulations.
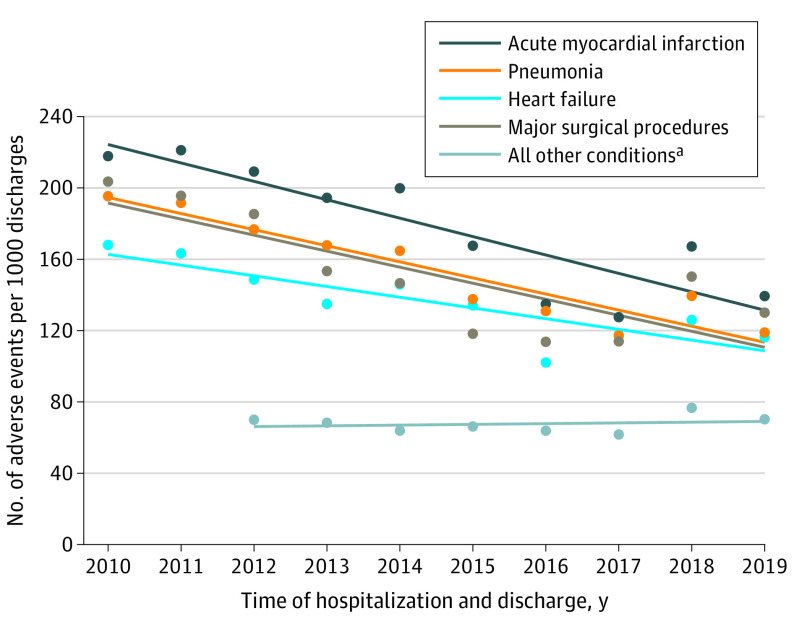
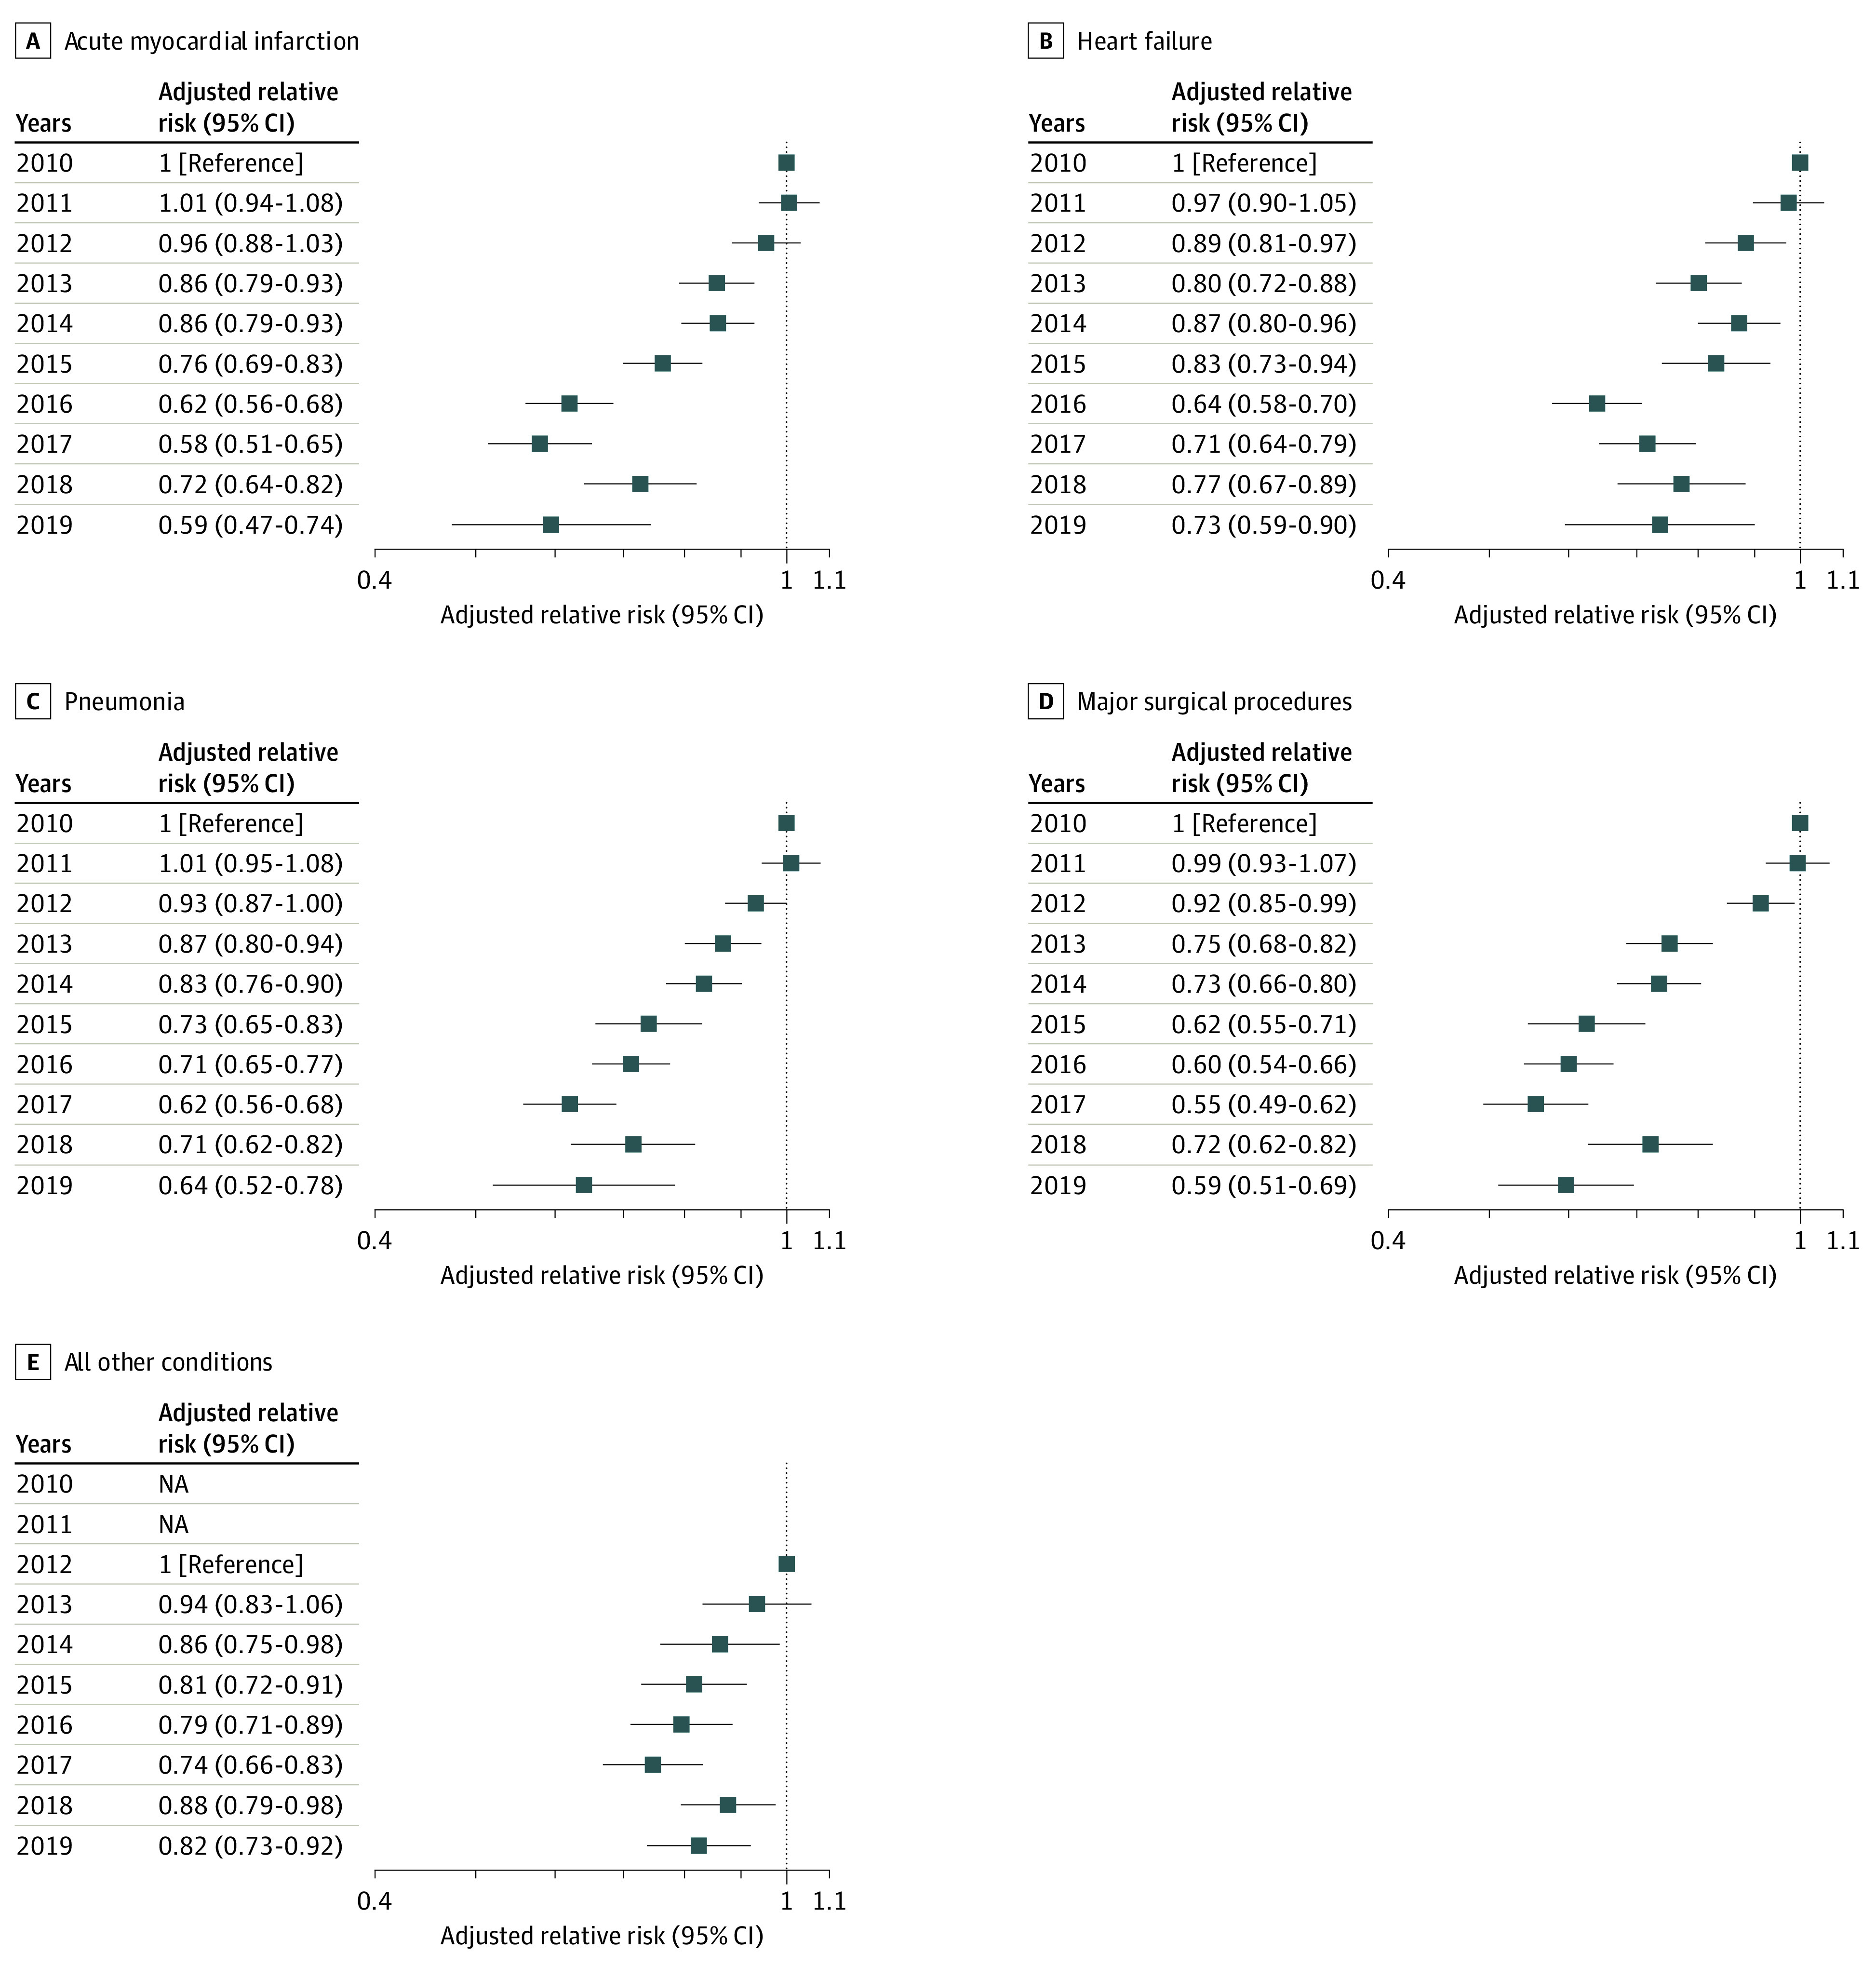
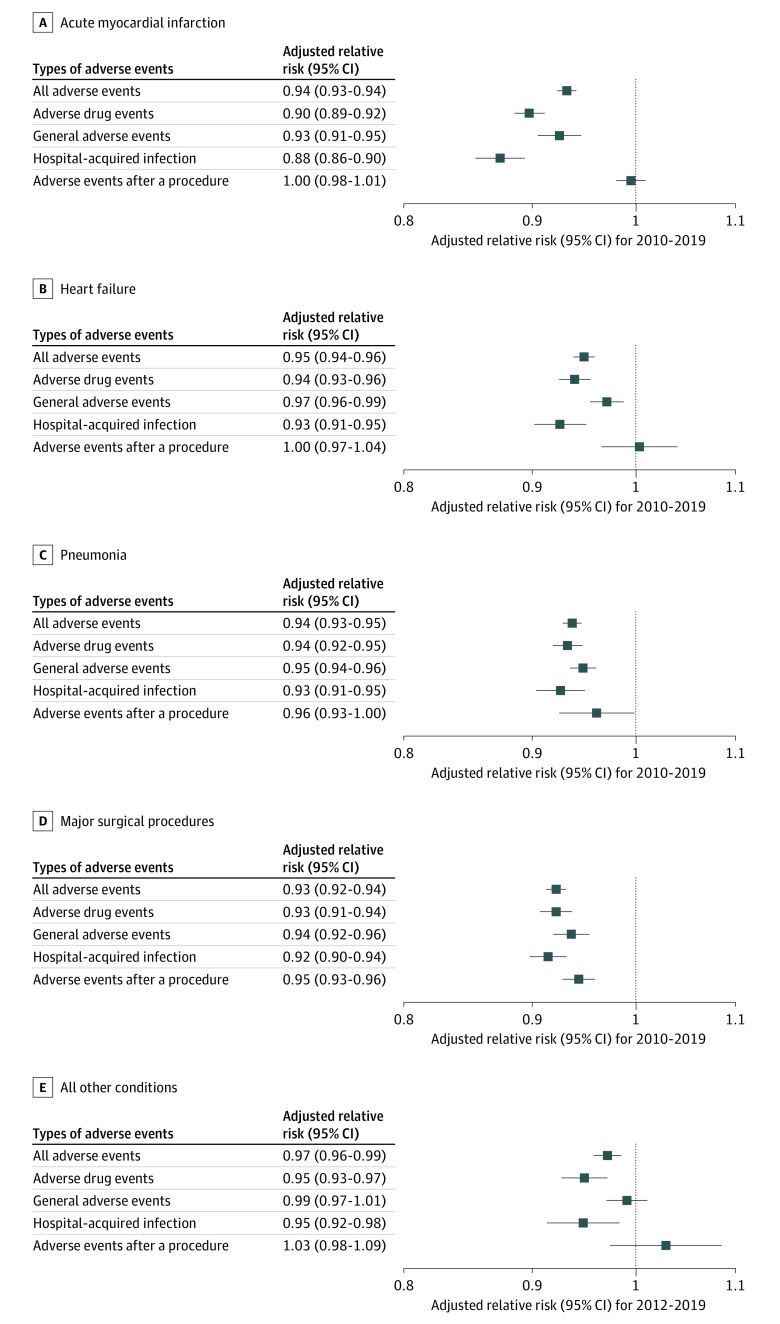
Results: The study sample included 190 286 hospital discharges combined in the 4 condition-based groups of acute myocardial infarction, heart failure, pneumonia, and major surgical procedures (mean age, 68.0 [SD, 15.9] years; 52.6% were female) and 54 256 hospital discharges for the group including all other conditions (mean age, 57.7 [SD, 20.7] years; 59.8% were female) from 3156 acute care hospitals across the US. From 2010 to 2019, the total change was from 218 to 139 adverse events per 1000 discharges for acute myocardial infarction, from 168 to 116 adverse events per 1000 discharges for heart failure, from 195 to 119 adverse events per 1000 discharges for pneumonia, and from 204 to 130 adverse events per 1000 discharges for major surgical procedures. From 2012 to 2019, the rate of adverse events for all other conditions remained unchanged at 70 adverse events per 1000 discharges. After adjustment for patient and hospital characteristics, the annual change represented by relative risk in all adverse events per 1000 discharges was 0.94 (95% CI, 0.93-0.94) for acute myocardial infarction, 0.95 (95% CI, 0.94-0.96) for heart failure, 0.94 (95% CI, 0.93-0.95) for pneumonia, 0.93 (95% CI, 0.92-0.94) for major surgical procedures, and 0.97 (95% CI, 0.96-0.99) for all other conditions. The risk-adjusted adverse event rates declined significantly in all patient groups for adverse drug events, hospital-acquired infections, and general adverse events. For patients in the major surgical procedures group, the risk-adjusted rates of events after a procedure declined significantly.
Conclusions and relevance: In the US between 2010 and 2019, there was a significant decrease in the rates of adverse events abstracted from medical records for patients admitted for acute myocardial infarction, heart failure, pneumonia, and major surgical procedures and there was a significant decrease in the adjusted rates of adverse events between 2012 and 2019 for all other conditions. Further research is needed to understand the extent to which these trends represent a change in patient safety.
Conflict of interest statement
Figures
Comment in
-
Improvements in Hospital Adverse Event Rates: Achieving Statistically Significant and Clinically Meaningful Results.JAMA. 2022 Jul 12;328(2):148-150. doi: 10.1001/jama.2022.10281. JAMA. 2022. PMID: 35819434 No abstract available.
-
Trends in Adverse Event Rates Among Hospitalized Patients From 2010 to 2019.JAMA. 2022 Dec 13;328(22):2271-2272. doi: 10.1001/jama.2022.18169. JAMA. 2022. PMID: 36511931 No abstract available.
References
-
- Institute of Medicine . To Err Is Human: Building a Safer Health System. Published November 1999. Accessed June 17, 2022. https://nap.nationalacademies.org/resource/9728/To-Err-is-Human-1999--re...
-
- Agency for Healthcare Research and Quality . Making Healthcare Safer III. Published April 2020. Accessed March 1, 2021. https://www.ahrq.gov/research/findings/making-healthcare-safer/mhs3/inde...
MeSH terms
Grants and funding
LinkOut - more resources
Full Text Sources
Medical
Miscellaneous
