. 2022 Oct;38(10):1199-1214.
doi: 10.1007/s12264-022-00902-0. Epub 2022 Jul 11.

Histones of Neutrophil Extracellular Traps Induce CD11b Expression in Brain Pericytes Via Dectin-1 after Traumatic Brain Injury

Affiliations

Histones of Neutrophil Extracellular Traps Induce CD11b Expression in Brain Pericytes Via Dectin-1 after Traumatic Brain Injury

Yang-Wuyue Liu et al. Neurosci Bull. 2022 Oct.

Abstract

The brain pericyte is a unique and indispensable part of the blood-brain barrier (BBB), and contributes to several pathological processes in traumatic brain injury (TBI). However, the cellular and molecular mechanisms by which pericytes are regulated in the damaged brain are largely unknown. Here, we show that the formation of neutrophil extracellular traps (NETs) induces the appearance of CD11b+ pericytes after TBI. These CD11b+ pericyte subsets are characterized by increased permeability and pro-inflammatory profiles compared to CD11b- pericytes. Moreover, histones from NETs by Dectin-1 facilitate CD11b induction in brain pericytes in PKC-c-Jun dependent manner, resulting in neuroinflammation and BBB dysfunction after TBI. These data indicate that neutrophil-NET-pericyte and histone-Dectin-1-CD11b are possible mechanisms for the activation and dysfunction of pericytes. Targeting NETs formation and Dectin-1 are promising means of treating TBI.

Keywords: Dectin-1; NET; Neutrophil; Pericyte; TBI.


Conflict of interest statement

The authors all declare that they have no competing interests.

Figures

Fig. 1
Fig. 1
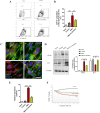
Immunofluorescence of PDGFRβ and CD11b in damaged brain tissue. A, B Immunostaining of the pericyte marker PDGFRβ/α-SMA (green) and CD11b (red) in brain tissue from a TBI patient. C, D Immunostaining of the pericyte marker PDGFRβ/α-SMA (red) and CD11b (green) in brain tissue from a TBI mouse. Damaged tissue is marked by dotted lines. Human and mouse brain tissues were collected within 24–48 h after TBI. Scale bars, 100 μm. Cell nucleus are stained with DAPI (blue).
Fig. 2
Fig. 2
Functional and molecular features of CD11b-positive pericytes. A Flow cytometric diagram of CD11b+ pericytes in brain tissue. B Plots of CD11b+ pericytes from Sham and TBI mice. C Quantification of CD11b+ pericytes in brain tissue from Sham and TBI mice (n = 5 per group). D Neutrophil migration mediated by CD11b+ and CD11b pericytes (scale bar, 100 μm). E RNA-sequencing data of sorted cells (CD11b+CD13+ and CD11bCD13+) from damaged brain tissue (red, high expression; green, low expression; black, unchanged expression). F Expression levels (FPKM value) of cytokine (IL-1β), chemokine (CCL5), macrophage marker (CD163), and microglial marker (TMEM119) in sorted cells. G Relative mRNA levels of target genes in the CD11b+ population compared to CD11b pericytes. Data are shown as the mean ± SEM of 3–5 individual experiments; **P < 0.01, two-tailed unpaired Student’s t test.
Fig. 3
Fig. 3
NET formation after TBI. A Immunofluorescence of NET formation in peripheral blood. The neutrophils were isolated from peripheral blood of Sham and TBI mice at 24 h post-injury. Then they were treated with gradient concentrations of PMA (10, 100, and 500 ng/mL) for 6 h and stained with Cit H3 (red) and DAPI (blue) (scale bar 100 μm). B Flow cytometric diagram of NET formation (CitH3+LY6G+MPO+) in brain tissue. C Cit H3 levels in MPO+ neutrophils from different brain tissues post-TBI. Negative for LY6G+MPO+ neutrophils without Cit H3 antibody staining. Brain tissues were collected from the injury core, the para-injury area, and the contralateral side of TBI mice. D Quantification of Cit H3-positive neutrophils in C. Each bar represents 3 individual experiments. Data are shown as the mean ± SEM. E Correlation analysis between percentage of neutrophils and CD11b+ pericyte frequency in damaged brain (n = 10).
Fig. 4
Fig. 4
Effects of NET-formed medium on pericytes. MBVPs were incubated with specific media for 48 h [none, normal medium; control, medium from non-stimulated neutrophils; PMA, NET-formed medium stimulated by PMA (100 ng/mL); PMA+Cl-Amidine, medium from PMA stimulation (100 ng/mL) combined with NET inhibitor Cl-Amidine (10 μmol/L)]. Supernatant was collected by centrifugation for removing neutrophils. A Cytometric analysis of CD11b+ MBVPs after different treatments. B Percentage of CD11b+ MBVPs in A (n = 3). C Immunostaining of tight junction protein (ZO-1, green) and pericyte marker (PDGFRβ, red) on MBVPs (scale bar, 20 μm). D WB of CD11b and ZO-1 expression in MBVPs after different treatments (protein levels relative to GAPDH loading control). E RT-PCR analysis of relative mRNA levels of CD11b in different treatment groups compared to the none group (5 individual experiments per group). F Representative graph of continuous TEER values of MBVPs incubated with different culture media. TEER values of each group were compared to blank (MBVPs with normal culture medium). Data are shown as the mean ± SEM; *P < 0.05, **P < 0.01, ***P < 0.001, ANOVA.
Fig. 5
Fig. 5
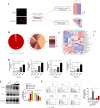
Analysis of functional components from NET-formed medium affecting the pericyte phenotype. A Workflow for proteomics and metabolomics comparisons between NET-formed medium (PMA) and control medium (neutrophils without PMA stimulation) (proteomics, n = 3 per group; metabolomics, n = 7 per group). B Pie chart of differentially-expressed proteins and top 20 up-regulated proteins in NET-formed medium. Changes > 1.5-fold and P < 0.05 were considered significantly different. C Hierarchical clustering of differential metabolites in NET-formed medium. Differentially-expressed molecules repeatedly consistent in the same group with P < 0.05 were screened out and are highlighted in red (up-regulated) and blue (down-regulated). D RT-PCR analysis of relative CD11b mRNA expression in histone-treated MBVPs compared to controls. Cells were treated with recombinant histone peptides for 24 h. Histones are a mixture of histones 1, 2, and 3 at the a ratio of 1:1:1. E WB analysis of CD11b and ZO-1 in MBVPs incubated with histones for 48 h. Protein levels were quantified relative to GAPDH. F FACS analysis of the percentage of CD11b+ MBVPs incubated under specific conditions for 48 h. Data are shown as the mean ± SEM of 3 individual experiments; *P < 0.05, **P < 0.01, ***P < 0.001, ANOVA.
Fig. 6
Fig. 6
Expression and function of Dectin-1 in brain pericytes. [Specific media: Control, medium from non-stimulated neutrophils; PMA, NET formation medium from neutrophils stimulated by PMA (100 ng/mL); Histones, mixed purified histone peptides (H1:H2:H3, 1:1:1) were dissolved at 2 μg/mL]. A WB analysis of Dectin-1expression on MBVPs incubated with specific media for 48 h (the specific medium was mixed with normal culture medium at a 1:3 ratio as described above). B WB analysis of Detin-1 expression on MBVPs stimulated with specific medium after transfecting blank vector or Dectin-1 siRNAs (si-1 and si-2). Dectin-1 protein levels were quantified relative to GAPDH. C Relative CD11b mRNA expression on MBVPs (compared to the none group) after NET-formed medium treatment combined with the indicated concentration of Dectin-1 antagonist LAM for 24 h. D Relative CD11b mRNA expression on MBVPs after NET-formed medium treatment combined with Dectin-1 siRNA transfection for 24 h (Vector, transfection solution without siRNAs). E Relative CD11b mRNA expression on MBVPs (compared to the none group) after Histones (2 μg/mL) treatment combined with indicated concentration of Dectin-1 for 24 h. F Relative CD11b mRNA expression on MBVPs after Histones (2 μg/mL) treatment combined with Dectin-1 siRNA transfection for 24 h (Vector, transfection solution without siRNAs). G Representative graph of continuous TEER values on MBVPs treated by NET-formed medium with/without the Dectin-1 antagonist Laminarin. H Representative graph of continuous TEER values on MBVPs treated with NET-formed medium with/without Dectin-1 siRNA transfection. TEER values for each group were compared to blank (MBVP under normal culture medium). Data are shown as the mean ± SEM of 5 individual experiments; *P < 0.05, **P < 0.01, one-way ANOVA.
Fig. 7
Fig. 7
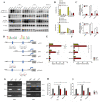
PKC/c-Jun/CD11b pathways in histone/Dectin-1 recognition. A Representative WBs of total PKC (t-PKC), phosphorylated-PKCζ/λ (p-PKCζ/λ), total c-Jun (t-c-Jun), and phosphorylated-c-Jun in MBVPs treated with NET-formed medium (PMA) or Histones (2 μg/mL) with or without the PKC inhibitor GFX (5 μmol/L), Dectin-1 antagonist LAM (100 μg/mL), and siRNAs for 24 h. B Ratios of p-PKC/t-PKC and p-c-Jun/t-c-Jun in specific groups. Comparisons were made between PMA/Histones and combined treatment groups. C Relative expression of CD11b mRNA (compared to control blank group) on MBVPs treated with NET-formed medium (PMA) and Histones (2 μg/mL) for 24 h in the presence of GFX (5 μmol/L) or T-5224 (c-Jun inhibitor, 10 μmol/L). D Putative c-Jun binding sequence of the mouse CD11b promoter gene. E Luciferase activity of MBVPs co-transfected with indicated reporters under specific conditions. F Luciferase activity of MBVPs co-transfected with mutated reporters under specific conditions. All transfected cells were treated under the indicated conditions for 24 h and lysed for dual-luciferase measurements. G CHIP assays of the c-Jun binding sequence from the murine CD11b promoter gene. After treating MBVPs with the indicated conditions for 24 h, the total chromatin was collected and amplified as input (positive control). Antibody against c-Jun was used to pull down the binding segments, of which IgG was introduced as a negative control. Two pairs of specific primers that covered each binding site were used to amplify the SF1-containing segment (−1250 to −1244) and the SF2-containing segment (−410 to −403) within 30 cycles. H, I RT-PCR of CHIP products. qRT-PCR was performed with GAPDH as the internal reference gene and IgG in each group was the control. Data are shown as the mean ± SEM of 3 individual experiments; **P < 0.01, *P < 0.05, two-tailed unpaired Student’s t test or ANOVA.
Fig. 8
Fig. 8
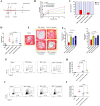
Evaluation of BBB integrity, pericyte activation, neutrophil infiltration, and neurological recovery by targeting the NET–Dectin-1 axis post-TBI. A Schematic workflow of animal experiments. After constructing the moderate brain impact model, mice were immediately treated with the NET inhibitor Cl-Amidine (50 mg/kg) and the Dectin-1 antagonist Laminarin (25 and 50 mg/kg) by intraperitoneal injection every three days (5 injections). Two weeks later (red points), the treatments were terminated and mice were fed without any interference. B Quantification of Evans Blue in the left hemisphere (4 mice per group at the indicated time point). C Survival rate of each group in the first week after TBI impact with different treatments (n = 6 for Sham, n = 10 for TBI). D Footfault evaluation of TBI mice with administration of indicated drugs at 2 weeks post-injury (n ≥ 5 per group). E Recordings of movement in OFT assessment at 4 weeks after moderate TBI impact with different treatments. F Frequency of crossing the central zone and time spent in the center zone of the OFT (as in E) (n ≥ 5 per group). G FACS analysis of infiltrated neutrophils (CD45+CD11b+LY6G+) from injured brain tissue at 24 h in TBI mice treated with the indicated drugs (n = 4 per group). H Quantification of neutrophils in brain tissue from each group (n = 4). I FACS analysis of CD11b+ brain pericytes (CD45CD11b+CD13+) from brain tissue of TBI mice treated with the indicated drugs (n = 4 per group). J Quantification of CD11b+ brain pericytes in brain tissue from each group (n = 4). Data are presented as the mean ± SEM, and analyzed by ANOVA. The animal numbers and P values of each group are shown in the figures and legends.

Similar articles

Cited by

References

    1. Luo JN, Wu X, Liu HX, Cui WX, Guo W, Guo K, et al. Antagonism of protease-activated receptor 4 protects against traumatic brain injury by suppressing neuroinflammation via inhibition of Tab2/NF-κB signaling. Neurosci Bull. 2021;37:242–254. doi: 10.1007/s12264-020-00601-8. - DOI - PMC - PubMed
    1. Jing Y, Yang DX, Wang W, Yuan F, Chen H, Ding J, et al. Aloin protects against blood-brain barrier damage after traumatic brain injury in mice. Neurosci Bull. 2020;36:625–638. doi: 10.1007/s12264-020-00471-0. - DOI - PMC - PubMed
    1. Williams OH, Tallantyre EC, Robertson NP. Traumatic brain injury: Pathophysiology, clinical outcome and treatment. J Neurol. 2015;262:1394–1396. doi: 10.1007/s00415-015-7741-4. - DOI - PubMed
    1. Kolaczkowska E, Kubes P. Neutrophil recruitment and function in health and inflammation. Nat Rev Immunol. 2013;13:159–175. doi: 10.1038/nri3399. - DOI - PubMed
    1. Shi YJ, Zhang LL, Pu HJ, Mao LL, Hu XM, Jiang XY, et al. Rapid endothelial cytoskeletal reorganization enables early blood-brain barrier disruption and long-term ischaemic reperfusion brain injury. Nat Commun. 2016;7:10523. doi: 10.1038/ncomms10523. - DOI - PMC - PubMed