. 2022 Jul 12;79(8):417.
doi: 10.1007/s00018-022-04426-8.

Surface cholesterol-enriched domains specifically promote invasion of breast cancer cell lines by controlling invadopodia and extracellular matrix degradation

Affiliations

Surface cholesterol-enriched domains specifically promote invasion of breast cancer cell lines by controlling invadopodia and extracellular matrix degradation

Mauriane Maja et al. Cell Mol Life Sci. .

Abstract

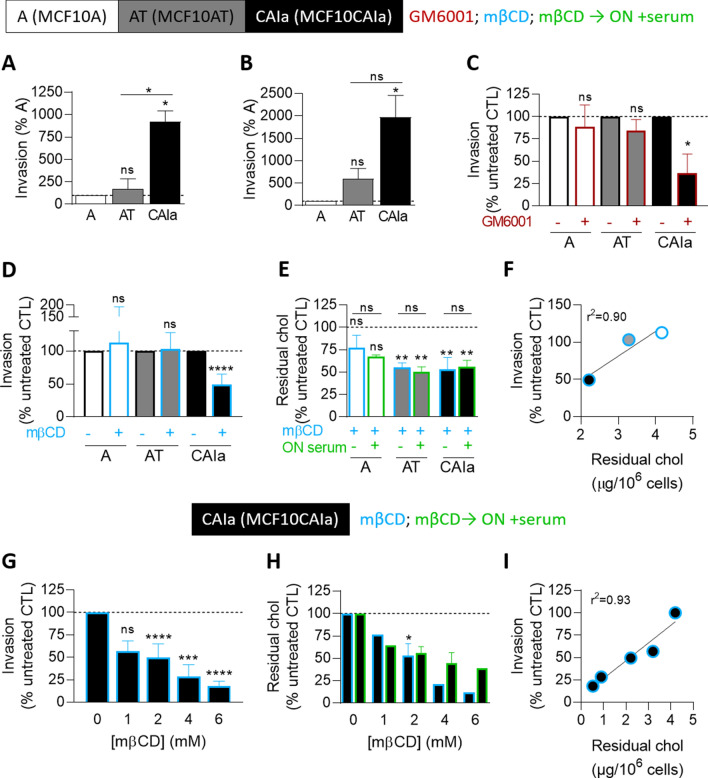
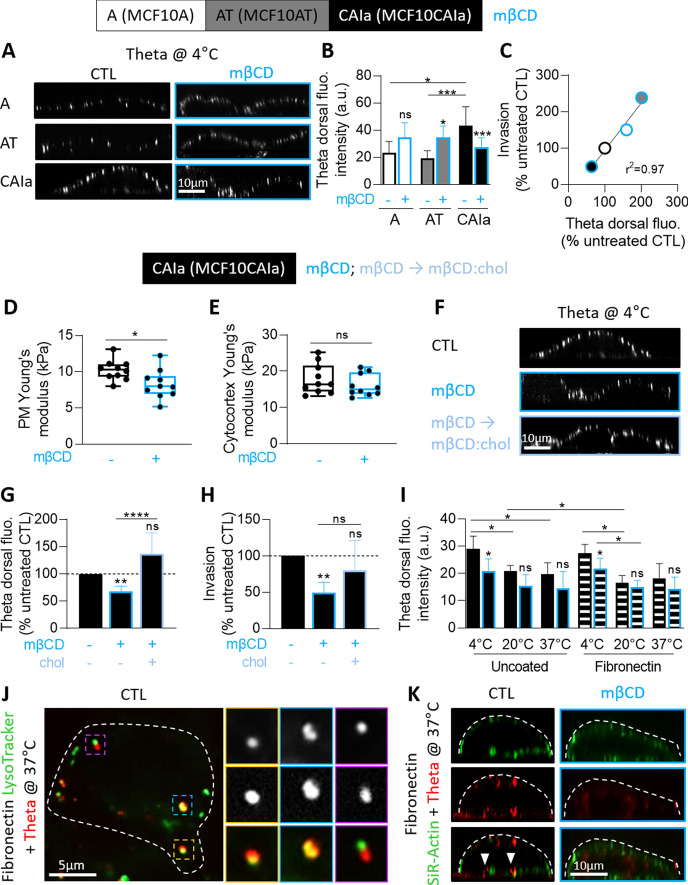
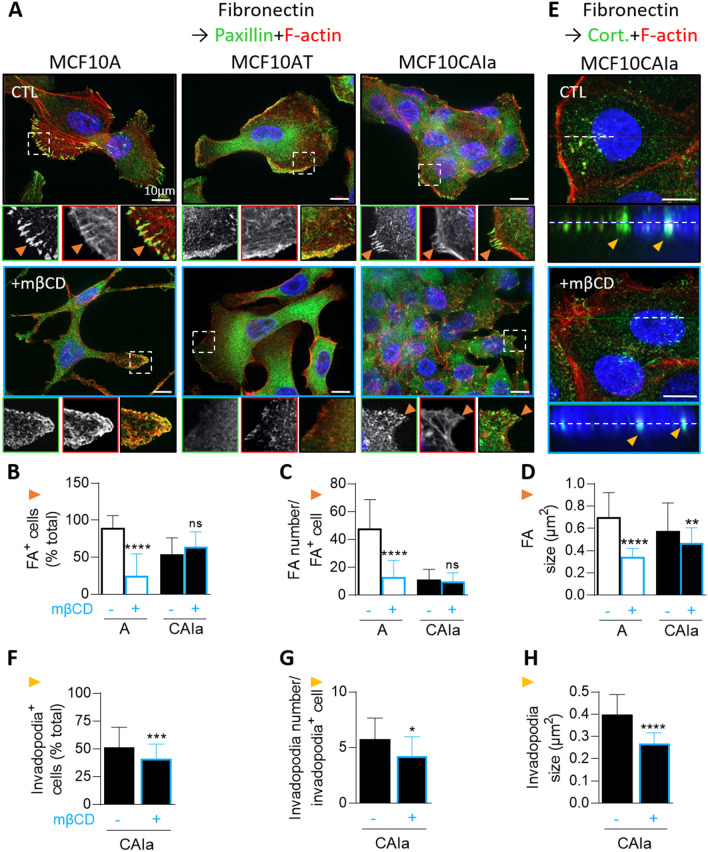
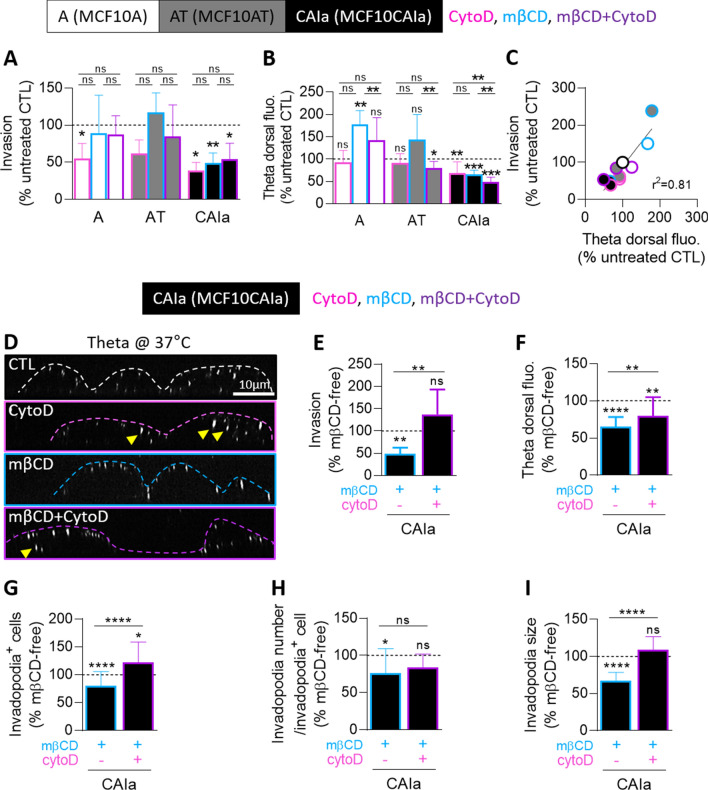
Tumor cells exhibit altered cholesterol content. However, cholesterol structural subcellular distribution and implication in cancer cell invasion are poorly understood mainly due to difficulties to investigate cholesterol both quantitatively and qualitatively and to compare isogenic cell models. Here, using the MCF10A cell line series (non-tumorigenic MCF10A, pre-malignant MCF10AT and malignant MCF10CAIa cells) as a model of breast cancer progression and the highly invasive MDA-MB-231 cell line which exhibits the common TP53 mutation, we investigated if cholesterol contributes to cancer cell invasion, whether the effects are specific to cancer cells and the underlying mechanism. We found that partial membrane cholesterol depletion specifically and reversibly decreased invasion of the malignant cell lines. Those cells exhibited dorsal surface cholesterol-enriched submicrometric domains and narrow ER-plasma membrane and ER-intracellular organelles contact sites. Dorsal cholesterol-enriched domains can be endocytosed and reach the cell ventral face where they were involved in invadopodia formation and extracellular matrix degradation. In contrast, non-malignant cells showed low cell invasion, low surface cholesterol exposure and cholesterol-dependent focal adhesions. The differential cholesterol distribution and role in breast cancer cell invasion provide new clues for the understanding of the molecular events underlying cellular mechanisms in breast cancer.

Keywords: Cholesterol transversal asymmetry; Endocytosis; MCF10A series; MDA-MB-231; Matrigel invasion; Membrane contact sites.


Conflict of interest statement

The authors declare no competing financial interests.

Figures

Fig. 1
Fig. 1
The invasion of the malignant CAIa cells specifically depends on MMP activity and cholesterol content. A–C Quantification of invasion of the 3 cell lines in Transwell with a dense Matrigel layer toward 10% serum for 6–12 h (A n = 5–6 Transwell from 4 independent experiments), 24 h (B n = 3–4 Transwell from 3 independent experiments) or 6–12 h upon 10 µM GM6001 to impair extracellular matrix degradation (C n = 4–7 Transwell from 2 to 3 independent experiments). Kruskal–Wallis test followed by Dunn’s comparison test (A, B) or Mann–Whitney test (C). D–I Cell lines were treated with 2 mM (D–F) or the indicated concentrations of methyl-β-cyclodextrin (mβCD) for 2 h and then tested for invasion (D, G) and residual chol content (E, H). Quantification of invasion of the 3 cell lines (D) or CAIa (G) in Transwell with a dense Matrigel layer toward 10% serum for 6–12 h (n = 4–19 Transwell from 2 to 9 independent experiments). Unpaired t test (D) and Kruskal–Wallis test followed by Dunn’s comparison test (G). Residual chol content of the 3 cell lines (E) or CAIa (H) assessed by Amplex Red directly (blue border columns) or 12 h after mβCD treatment (ON, overnight; green border columns; n = 1–5 independent experiments). Kruskal–Wallis test followed by Dunn’s comparison test (E, H). Linear correlation between the invasion of the 3 cell lines and their residual chol content (F); or between the invasion of CAIa and their residual chol (I)
Fig. 2
Fig. 2
In malignant CAIa cells, the dorsal cholesterol distributes in submicrometric domains that are specifically and reversibly decreased by methyl-β-cyclodextrin and can be endocytosed and reach the ventral face. Cell lines were treated or not (CTL, black) with 2 mM mβCD for 2 h (blue) or repleted with chol after depletion (light blue) and then tested for surface chol content (A–C, F, G, I, K), cell stiffness (D, E), cell invasion (H) and intracellular trafficking (J). (A, F) X–Z reconstructions of confocal images of the 3 cell lines (A) or CAIa (F) plated on glass coverslips, treated or not with mβCD followed or not by chol repletion and labeled at 4 °C with the mCherry-Theta toxin fragment specific to endogenous chol. (B, G) Quantification of the Theta dorsal fluorescence intensity of the 3 cell lines or CAIa treated or not with mβCD followed by chol repletion (average value of 10–15 cells from n = 2–28 images from 2 to 8 independent experiments and 15–20 cells from n = 8–14 images from 2 independent experiments). Mann–Whitney test (B) and Kruskal–Wallis test followed by Dunn’s comparison test (B, G). C Linear correlation between mβCD-treated invasion and Theta dorsal fluorescence intensity. (D, E) CAIa PM and cytocortex Young’s modulus determined by atomic force microscopy. Data points correspond to the mean values measured on a single cell (10 different cells) during n ≥ 3 independent experiments. Mann–Whitney test. H Quantification of invasion of CAIa in Transwell with a dense Matrigel layer toward 10% serum for 12 h (n = 8–9 Transwell from 3 independent experiments). Kruskal–Wallis test followed by Dunn’s comparison test. I Quantification of the Theta dorsal fluorescence intensity of CAIa plated on glass (filled bars) or fibronectin-coated coverslips (striped bars), treated or not (black border columns) with mβCD (blue border columns) and labeled at 4, 20 or 37 °C with the mCherry-Theta toxin fragment (10–20 cells from n = 3–6 images from 1 experiment). Kruskal–Wallis test followed by Dunn’s comparison test and Mann–Whitney test. J Theta intracellular behavior determined by vital imaging at 37 °C on fibronectin-plated CAIa colabeled with the mCherry-Theta toxin fragment and the LysoTracker probe to label late endosomes/lysosomes. The first two insets show LysoTracker-positive compartments containing Theta-labeled chol whereas the third one shows a LysoTracker-negative Theta structure (n = 2). K X–Z reconstructions of confocal images of CAIa plated on fibronectin-coated coverslips, treated or not with mβCD and colabeled at 37 °C with the mCherry-Theta toxin fragment and the SiR-Actin. Arrowheads, ventral chol-enriched domains (n = 1)
Fig. 3
Fig. 3
Cholesterol depletion in malignant CAIa cells does not affect focal adhesions but reduces invadopodia size and abundance. Cell lines were plated on fibronectin-coated coverslips, treated with 2 mM mβCD for 2 h (blue), immunolabeled for paxillin (A–D) or cortactin (E–H), analyzed by confocal microscopy and quantified. AE Confocal images of the 3 cell lines (A) or CAIa (E) immunolabeled with anti-Paxillin or anti-Cortactin together with F-actin (stained by Phalloidin) and nuclei (stained with Hoechst). Insets in A and orange arrowheads show paxillin-positive focal adhesions (FA). Insets in E and yellow arrowheads show X–Z reconstructions of invadopodia length along the dotted line. BD Quantifications of the number of A and CAIa cells presenting focal adhesions, the number of focal adhesions per cell and the focal adhesion size [n = 27–35 images (B) and n = 44–84 cells (C, D) from 4–5 independent experiments]. F–H Quantifications of the number of CAIa cells presenting invadopodia, the number of invadopodia per cell and the invadopodia size (n = 16–65 images from 2 independent experiments). Unpaired t test
Fig. 4
Fig. 4
Cholesterol depletion in malignant CAIa cells reduces gelatin degradation to a similar extent than MMP inhibition. Cell lines were plated on Oregon Green-coated coverslips, serum-starved combined or not with 2 mM mβCD (blue) for 2 h, then repleted or not with chol for 1 h (light blue). Cells were then stimulated overnight (ON) with serum-containing medium supplemented or not with GM6001 (red) and then tested for gelatin degradation. A Representative images of gelatin degradation (black areas; arrowheads) of cells (immuno)labeled with anti-Cortactin, F-actin (Phalloidin) and nuclei (Hoechst). B, C Quantification of gelatin degradation potential of the 3 cell lines (B 5–20 cells from n = 8–12 images from 1 experiment) or CAIa treated or not with mβCD, GM6001 or the combination of both drugs or repleted with chol (C 10–30 cells from n = 9–50 images from 1 to 4 independent experiments). Kruskal–Wallis test followed by Dunn’s comparison test. D Linear correlation between the invasion of the 3 cell lines and CAIa treated with mβCD in combination or not with GM6001 and gelatin degradation potential
Fig. 5
Fig. 5
Actin polymerization inhibition in malignant CAIa cells decreases the effect of cholesterol depletion on invasion, cholesterol surface exposure and invadopodia size. Cell lines were treated for 2 h with 2 mM mβCD (blue) in combination (purple) or not with 0.5 µM cytochalasinD (cytoD; pink) and then tested for invasion, surface chol content and invadopodia. A, E Quantification of invasion of the 3 cell lines (A) or CAIa (E) in Transwell with a dense Matrigel layer toward 10% serum for 6–12 h (n = 5–9 Transwell from 2–3 independent experiments). B, F Quantification of the Theta dorsal fluorescence intensity of the 3 cell lines (B) or CAIa (F; 5–15 cells from n = 7–21 images from 2 to 6 independent experiments). Data in E,F are expressed in the percentage of mβCD-free conditions. Kruskal–Wallis test followed by Dunn’s comparison test (A, B) and Mann–Whitney test (E, F) to compare all treatments per cell line and Wilcoxon signed-rank test to compare treatments with untreated CTL (A, B, E, F). C Linear correlation between cell invasion and Theta dorsal fluorescence intensity. D X–Z reconstructions of confocal images of CAIa plated on fibronectin-coated coverslips, treated or not with mβCD in combination with cytoD and then labeled at 37 °C with the mCherry-Theta toxin fragment. Arrowheads, intracellular chol sequestration. GI Quantification of the number of cells presenting invadopodia, the number of invadopodia per cell and the invadopodia size of CAIa plated on fibronectin-coated coverslips, treated with mβCD in combination or not with cytoD and immunolabeled with anti-Cortactin (n = 8–50 images from 2 independent experiments). One sample t test and unpaired t test (G) and Wilcoxon signed-rank test and Mann–Whitney test (H, I)
Fig. 6
Fig. 6
The higher endoplasmic reticulum network spreading and its closer contact with mitochondria/lysosomes in malignant cells than in normal and premalignant cells are lost upon cholesterol depletion. The 3 cell lines were plated on fibronectin-coated coverslips, treated or not with 2 mM mβCD for 2 h (blue) and analyzed by confocal microscopy. A Coimmunolabeling with anti-KDEL (endoplasmic reticulum; ER) and anti-α-Tubulin (microtubules, to reveal the whole cytoplasm). Nuclei stained with Hoechst. B Colabeling at 37 °C with the Fluo4-AM specific to Ca2+ and the ER-Tracker. C labeling at 37°C with the LysoTracker (LT) specific to late endosomes/lysosomes followed by immunolabeling with anti-KDEL. D Quantification of the ER network spreading of the 3 cell lines treated or not (black border columns) with 2 mM mβCD for 2 h (blue border columns). Data are expressed as the difference of area between the whole cytoplasm and the ER (n = 12–47 cells from n = 7–8 images from 1 experiment). Kruskal–Wallis test followed by Dunn’s comparison test and Mann–Whitney test. E Quantification of the number of LysoTracker (LT) positive structures in close contact with the ER in the 3 cell lines treated or not (black border columns) with 2 mM mβCD for 2 h (blue border columns). Data are expressed as ER-LysoTracker (LT) contact structures reported to total LysoTracker positive structures (n = 29–50 profiles from 8 to 14 images from 1 experiment)
Fig. 7
Fig. 7
Malignant MDA-MB-231 cells also present high surface cholesterol distribution and depend on cholesterol for invasion, invadopodia size and gelatin degradation. MDA-MB-231 were treated with 2 mM of mβCD (blue) in combination or not with 10 µM GM6001 (red) or repleted with chol for 1 h (light blue) and then tested for invasion (A, B), surface chol content (C), invadopodia formation (D, F–H) and gelatin degradation (E, I). A, B Quantification of invasion in Transwell with a dense Matrigel layer toward 10% serum for 12 h upon GM6001 or after 2 h of mβCD (n = 4–5 Transwell from 2 independent experiments and n = 6 from 3 independent experiments, respectively). Mann–Whitney test. C Quantification of Theta dorsal fluorescence intensity of MDA-MB-231 plated on glass (filled bars) or fibronectin-coated coverslips (striped bars), treated or not (black border columns) with mβCD (blue border columns) and labeled at 4 or 37 °C with the mCherry-Theta toxin fragment (7–15 cells from n = 8–11 images from 2 independent experiments). Mann–Whitney test. D, E Confocal images of MDA-MB-231 plated on fibronectin (FN)-coated or Oregon Green-coated coverslips, treated as described in Figs. 3E and 4 and immunolabeled with anti-Cortactin together with F-Actin (Phalloidin) and nuclei (Hoechst). Insets in D show X–Z reconstructions of invadopodia length along the dotted line. F–H Quantification of the number of cells presenting invadopodia, the number of invadopodia per cell and the invadopodia size from images presented in D (n = 12–35 images from 2 independent experiments). Unpaired t test. I Quantification of gelatin degradation potential from images presented in E (8–15 cells from n = 10–46 images from 1 to 4 independent experiments). One-Way ANOVA test followed by Dunnett’s comparison test
Fig. 8
Fig. 8
Hypothetical model. Positive linear correlations between the Theta dorsal fluorescence intensity and cell invasion (A), gelatin degradation potential (B) and invadopodia size (C) in MCF10A (white), AT (grey), CAIa (black) and MDA-MB-231 (light pink) treated with mβCD (blue border) in combination (purple border) or not with cytoD (pink border) or repleted with chol (light blue border). D Hypothetical model for the implication of membrane chol-enriched domains in malignant cell invasion through their endocytosis from the dorsal side, exchange of MMPs at ER-late endosome/lysosome contact sites and transport into invadopodia. In addition, dorsal and ventral chol-enriched domains could also contribute to invadopodia signaling events (not shown). For additional information, see discussion. N, nucleus; ECM, extracellular matrix; ER, endoplasmic reticulum; LE, late endosome; Lys, lysosome. Thick arrows, pathway favored in malignant vs non-malignant cells

Similar articles

Cited by

References

    1. Lekka M, Laidler P, Gil D, Lekki J, Stachura Z, Hrynkiewicz AZ. Elasticity of normal and cancerous human bladder cells studied by scanning force microscopy. Eur Biophys J. 1999;28(4):312–316. doi: 10.1007/s002490050213. - DOI - PubMed
    1. Guck J, Schinkinger S, Lincoln B, Wottawah F, Ebert S, Romeyke M, et al. Optical deformability as an inherent cell marker for testing malignant transformation and metastatic competence. Biophys J. 2005;88(5):3689–3698. doi: 10.1529/biophysj.104.045476. - DOI - PMC - PubMed
    1. Lekka M, Gil D, Pogoda K, Dulinska-Litewka J, Jach R, Gostek J, et al. Cancer cell detection in tissue sections using AFM. Arch Biochem Biophys. 2012;518(2):151–156. doi: 10.1016/j.abb.2011.12.013. - DOI - PubMed
    1. Lekka M. Discrimination between normal and cancerous cells using AFM. Bionanoscience. 2016;6:65–80. doi: 10.1007/s12668-016-0191-3. - DOI - PMC - PubMed
    1. Runel G, Lopez-Ramirez N, Chlasta J, Masse I. Biomechanical properties of cancer cells. Cells. 2021 doi: 10.3390/cells10040887. - DOI - PMC - PubMed