Measurement of Lysosome Positioning by Shell Analysis and Line Scan
- PMID: 35819772
- PMCID: PMC11072972
- DOI: 10.1007/978-1-0716-2209-4_19
Measurement of Lysosome Positioning by Shell Analysis and Line Scan
Abstract
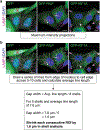
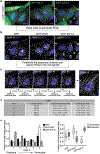
Lysosomes are membrane-bound organelles that degrade diverse biomolecules and regulate a multitude of other essential processes including cell growth and metabolism, signaling, plasma membrane repair and infection. Such diverse functions of lysosomes are highly coordinated in space and time and are therefore tightly coupled to the directional transport of the organelles within the cytoplasm. Thus, robust quantitative assessments of lysosome positioning within the cell provide a valuable tool for researchers interested in understanding these multifunctional organelles. Here, we present point-by-point methodology to measure lysosome positioning by two straight forward and widely used techniques: shell analysis and line scan.
Keywords: ImageJ analysis; Line scan; Lysosome distribution; Lysosome positioning measurements; Lysosome transport; Organelle positioning; Shell analysis.
© 2022. The Author(s), under exclusive license to Springer Science+Business Media, LLC, part of Springer Nature.
Figures


Similar articles
-
Mechanisms and functions of lysosome positioning.J Cell Sci. 2016 Dec 1;129(23):4329-4339. doi: 10.1242/jcs.196287. Epub 2016 Oct 31. J Cell Sci. 2016. PMID: 27799357 Free PMC article. Review.
-
Current methods to analyze lysosome morphology, positioning, motility and function.Traffic. 2022 May;23(5):238-269. doi: 10.1111/tra.12839. Epub 2022 Apr 24. Traffic. 2022. PMID: 35343629 Free PMC article. Review.
-
Regulators of Lysosome Function and Dynamics in Caenorhabditis elegans.G3 (Bethesda). 2017 Mar 10;7(3):991-1000. doi: 10.1534/g3.116.037515. G3 (Bethesda). 2017. PMID: 28122949 Free PMC article.
-
Lysosome-associated membrane proteins (LAMPs) regulate intracellular positioning of mitochondria in MC3T3-E1 cells.Exp Cell Res. 2015 Feb 1;331(1):211-222. doi: 10.1016/j.yexcr.2014.09.014. Epub 2014 Sep 22. Exp Cell Res. 2015. PMID: 25246127
-
OrgaMapper: a robust and easy-to-use workflow for analyzing organelle positioning.BMC Biol. 2024 Sep 30;22(1):220. doi: 10.1186/s12915-024-02015-8. BMC Biol. 2024. PMID: 39343900 Free PMC article.
Cited by
-
Biallelic BORCS8 variants cause an infantile-onset neurodegenerative disorder with altered lysosome dynamics.Brain. 2024 May 3;147(5):1751-1767. doi: 10.1093/brain/awad427. Brain. 2024. PMID: 38128568 Free PMC article.
-
BLOC1S1 variants cause lysosomal and autophagic defects resulting in a hypomyelinating leukodystrophy with epileptic encephalopathy.medRxiv [Preprint]. 2025 Jul 17:2025.07.17.25331211. doi: 10.1101/2025.07.17.25331211. medRxiv. 2025. PMID: 40791729 Free PMC article. Preprint.
-
OCRL1 Deficiency Affects the Intracellular Traffic of ApoER2 and Impairs Reelin-Induced Responses.Biomolecules. 2024 Jul 5;14(7):799. doi: 10.3390/biom14070799. Biomolecules. 2024. PMID: 39062513 Free PMC article.
-
Inhibition of endolysosome fusion increases exosome secretion.J Cell Biol. 2023 Jun 5;222(6):e202209084. doi: 10.1083/jcb.202209084. Epub 2023 May 22. J Cell Biol. 2023. PMID: 37213076 Free PMC article.
References
-
- Vyas JM, Kim YM, Artavanis-Tsakonas K, Love JC, Van der Veen AG, Ploegh HL (2007) Tubulation of class II MHC compartments is microtubule dependent and involves multiple endolysosomal membrane proteins in primary dendritic cells. J Immunol 178(11):7199–7210. 10.4049/jimmunol.178.11.7199 - DOI - PMC - PubMed
-
- Bretou M, Saez PJ, Sanseau D, Maurin M, Lankar D, Chabaud M, Spampanato C, Malbec O, Barbier L, Muallem S, Maiuri P, Ballabio A, Helft J, Piel M, Vargas P, Lennon-Dumenil A (2017) Lysosome signaling controls the migration of dendritic cells. Sci Immuno 2(16):1–11. 10.1126/sciimmunol.aak9573 - DOI - PubMed
Publication types
MeSH terms
Grants and funding
LinkOut - more resources
Full Text Sources

