. 2022 Jul 12:2022:baac054.
doi: 10.1093/database/baac054.

HumanMine: advanced data searching, analysis and cross-species comparison

Affiliations

HumanMine: advanced data searching, analysis and cross-species comparison

Rachel Lyne et al. Database (Oxford). .

Abstract

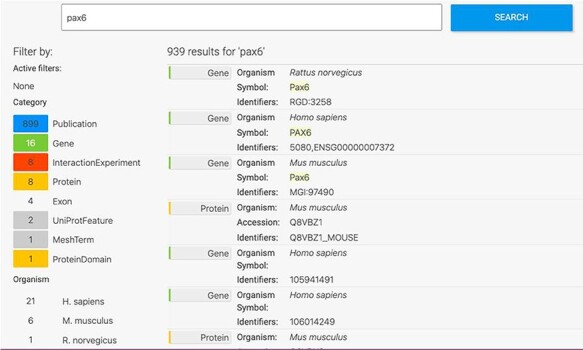
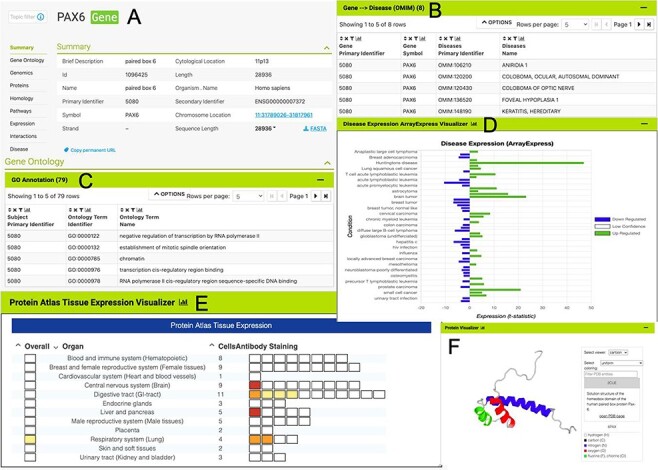
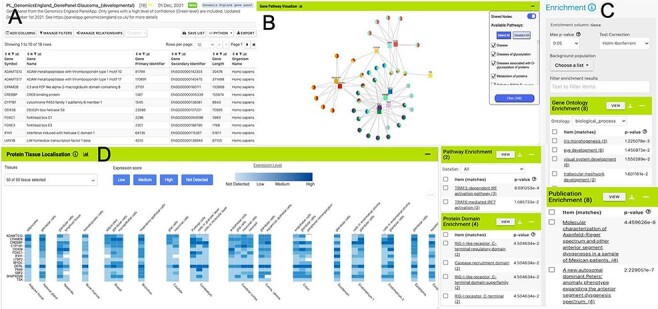
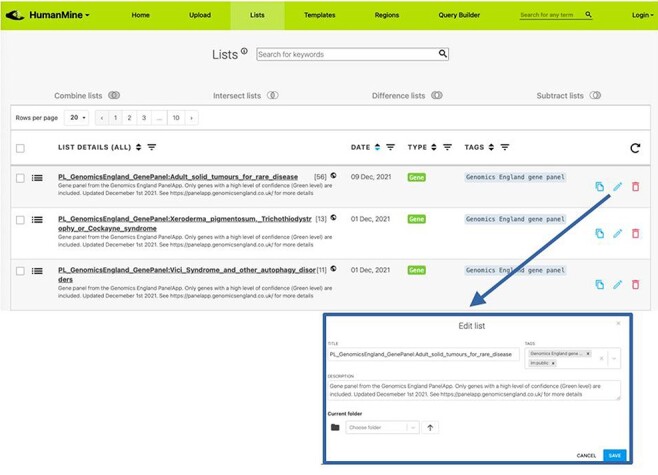
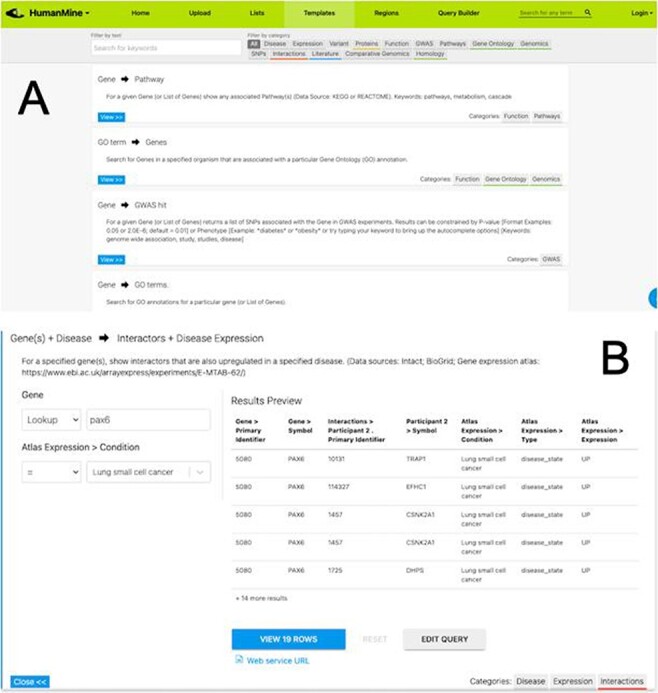
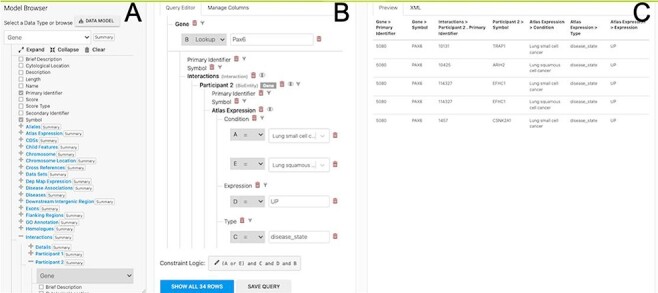
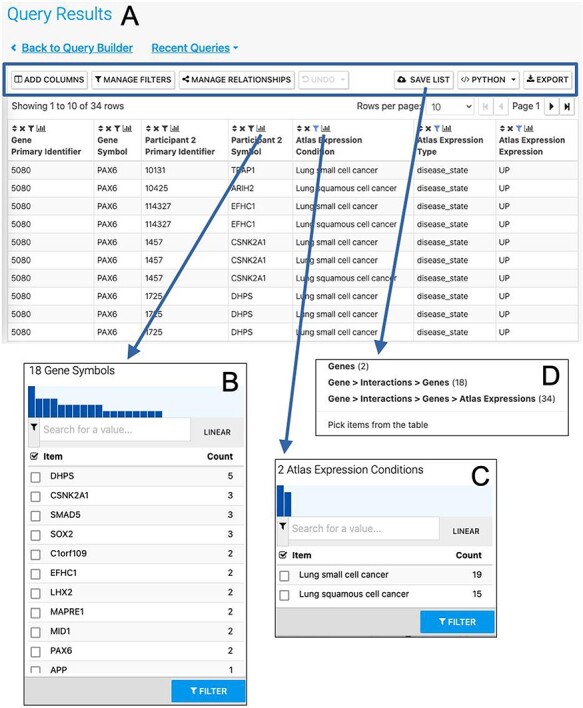
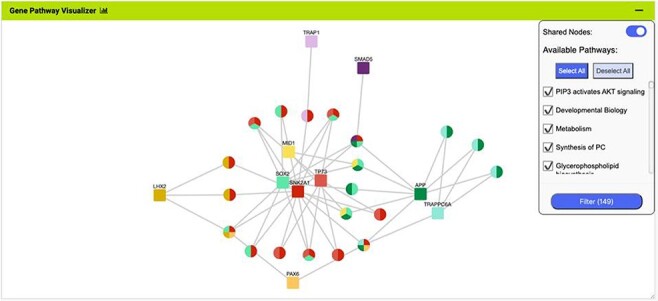
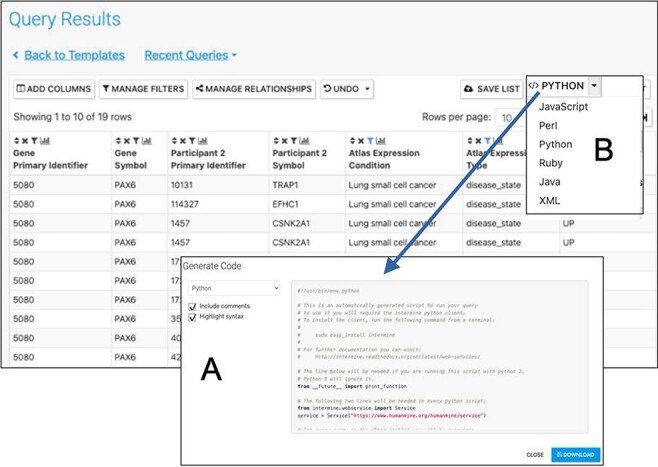
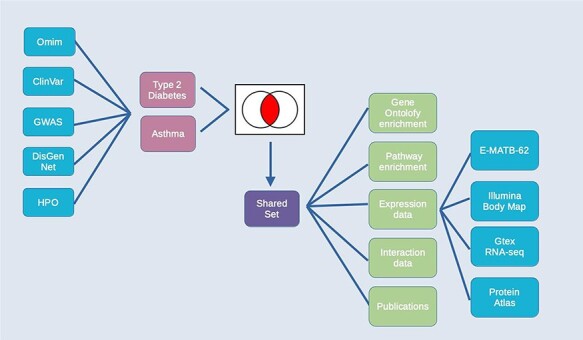
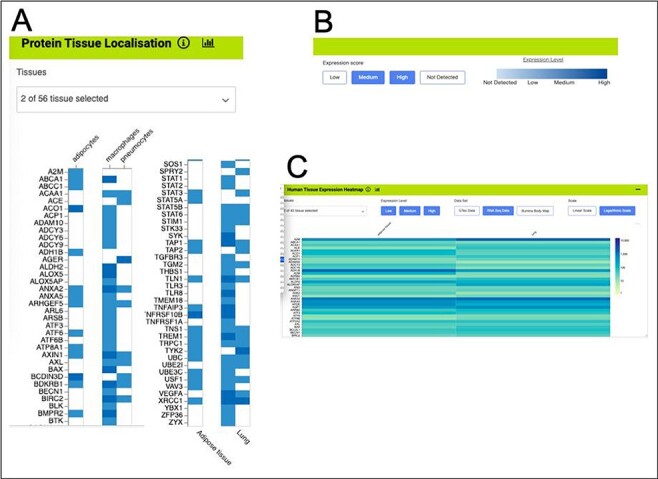
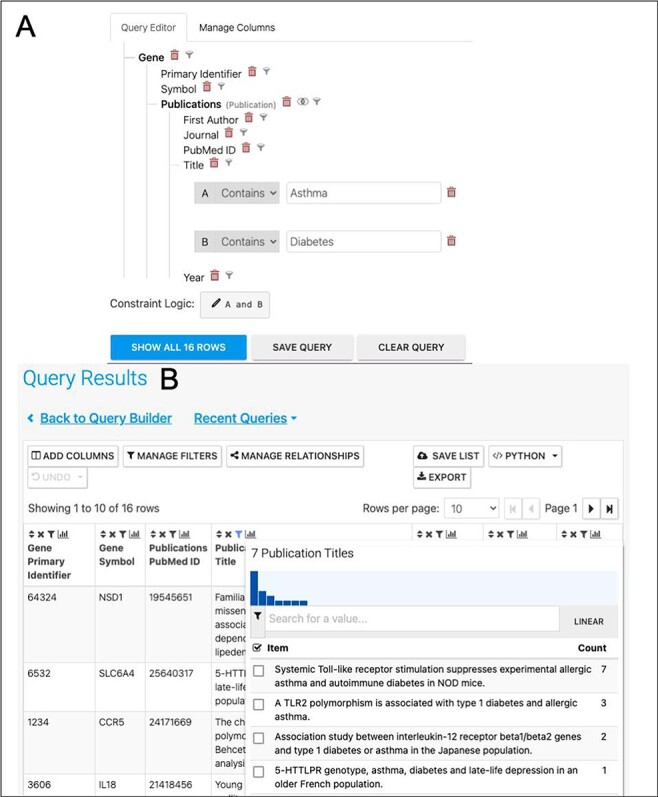
HumanMine (www.humanmine.org) is an integrated database of human genomics and proteomics data that provides a powerful interface to support sophisticated exploration and analysis of data compiled from experimental, computational and curated data sources. Built using the InterMine data integration platform, HumanMine includes genes, proteins, pathways, expression levels, Single nucleotide polymorphism (SNP), diseases and more, integrated into a single searchable database. HumanMine promotes integrative analysis, a powerful approach in modern biology that allows many sources of evidence to be analysed together. The data can be accessed through a user-friendly web interface as well as a powerful, scriptable web service Application programming interface (API) to allow programmatic access to data. The web interface includes a useful identifier resolution system, sophisticated query options and interactive results tables that enable powerful exploration of data, including data summaries, filtering, browsing and export. A set of graphical analysis tools provide a rich environment for data exploration including statistical enrichment of sets of genes or other biological entities. HumanMine can be used for integrative multistaged analysis that can lead to new insights and uncover previously unknown relationships. Database URL: https://www.humanmine.org.


Figures

Figure 1.
Figure 1.
Keyword search. A search for ‘Pax6’ returns a filterable menu of data classes and organisms with the number of entities found in each on the left and individual entities displayed on the right. Each individual entity provides a link to its report page.
Figure 2.
Figure 2.
The PAX6 report page. Report pages present data through a range of interactive tables, graphs and visualizations depending on the data type. A selection of features from the report page for the human PAX6 gene are shown here. (A) A summary of the main identifiers and chromosomal location. (B). An interactive table of Gene Ontology annotations. Only the first five rows are shown. (C). A table of disease annotations (original data source: OMIM, https://www.omim.org). Only the first five rows are displayed. (D). A graph showing up- and downregulation of the PAX6 gene in various disease conditions (original data from ArrayExpress experiment E-MTAB-62, https://www.ebi.ac.uk/arrayexpress/experiments/E-MTAB-62). (E). A graph showing protein localization data (from the Protein Atlas project, https://www.proteinatlas.org/humanproteome/tissue.). (F). A protein structure viewer pulling in data from the Protein Data Bank (https://www.rcsb.org).
Figure 3.
Figure 3.
List analysis page for the public list: PL_GenomicsEngland_GenePanel:Glaucoma_(developmental). Like the report pages, list analysis pages provide a number of interactive tables and graphs. A selection is shown here. (A). Interactive table summarizing the contents of the list. (B) A network graph showing Gene–Pathway connections for genes in the list. Only genes that have two or more pathway connections are shown (this option can be toggled on the menu panel). The menu panel also allows filtering of the pathway annotations used in the graph. (C) Enrichment statistics for Gene Ontology terms, Publications, Protein domains and Pathway annotations. (D) A heat map showing protein localization for each gene in the list (original data from The Protein Atlas project https://www.proteinatlas.org/humanproteome/tissue).
Figure 4.
Figure 4.
Lists. All lists, both public and private for a user account, can be viewed under the Lists tab.
Figure 5.
Figure 5.
(A) A library of ‘template’ searches is available from the ‘Templates’ tab. The template library can be searched using keywords or filtered using the various data category tags. (B) The ‘Gene(s) + Disease Interactors + Disease Expression’ template expanded. Each template provides one or more constraints that can be modified according to the search the user wishes to run. A preview of the template result is shown with options to view the full results or edit the query in the Query Builder.
Figure 6.
Figure 6.
The Query Builder. The query builder consists of three main panels—the model Browser (A), the query editor (B) and the query preview (C). The ‘Gene(s) + Disease Interactors + Disease Expression’ search is shown with an extra constraint for ‘condition = Lung squamous cell cancer’ added. Each constraint in the query editor is labelled with a letter enabling the constraint logic to be edited here to give ((A or E) and C and D and B).
Figure 7.
Figure 7.
The Results Table showing results from the query ‘Gene(s) + Disease Interactors + Disease Expression’ for the PAX6 gene with constraints on the disease name for small cell lung cancer or lung squamous cell cancer. The results tables provide many additional functions including ‘Add columns’ allowing additional data to be added, ‘Manage filters’ allowing filters on any column to be defined, ‘Manage relationships’ enabling either the union or intersect of classes of related data in the table to be defined, ‘Save list’ enabling subsets of items in the table to be saved as lists, ‘Python’, automatic code generation, available as a drop-down list of available languages and ‘Export’ (A). The column summary on the Participant 2 > Symbol column (the genes with which PAX6 interacts) allows the number of unique interacting genes (18) to be found (B). Using the column summary on the Atlas Expression > Condition column it is possible to see the number of rows for each disease condition. This could be used to filter the table to show just one of the disease conditions (C). The ‘Save as list’ function can be used to save any set of items from the table. Here it may be useful to save the set of interacting genes (Gene > Interactions > Genes (18)) (D). To save the set of interacting genes specific to one of the cancers, the table could be filtered first using the column summary function as described above.
Figure 8.
Figure 8.
The Gene Pathway Visualizer on the list analysis page, showing Gene–Pathway associations for the 14 upregulated small cell lung cancer genes that interact with PAX6. A number of potentially important cancer genes including SOX2, CSNK2A1, LMX2, SMAD5, APP and TP73 can be seen. Only genes that have two or more pathway connections are shown (this option can be toggled on the menu panel).
Figure 9.
Figure 9.
Automatic code generation. From any results table, it is possible to view and copy code for the underlying query in various programming languages. Here the python code for the Gene(s) + Disease Interactors + Disease Expression result is shown (A). Code for Python, Perl, Ruby, Javascript and Java is available (B).
Figure 10.
Figure 10.
Exploring comorbidities using HumanMine. A schematic representation of the steps involved in the use-case ‘Using HumanMine to explore shared pathways in disease comorbidities’. See text for details.
Figure 11.
Figure 11.
Gene expression heat maps for a selection of the genes from the shared set. (A). Protein tissue localization (original data from The Protein Atlas project, https://www.proteinatlas.org/humanproteome/tissue). The viewer has been filtered to show data for adipose tissue (adipocytes) and lung (macrophages and pneumocytes) only. (B). It is possible to toggle the expression score ‘bins’ on or off and a colour scale representing expression level is shown. (C). Heat map filtered to show RNA-seq data for adipose and lung (original data from The Protein Atlas project, https://www.proteinatlas.org/humanproteome/tissue). The viewer allows toggling between other expression data sets, showing different binned levels of expression and provides a scale for expression level.
Figure 12.
Figure 12.
(A). A query to find publications in which the title includes both Asthma and Diabetes. (B). The results return seven publications as shown by the column summary.
Figure 13.
Figure 13.
Features of the InterMine interface can be combined to create iterative workflows. For instance, the entities from the results of a query generated either using the query builder or through a template search can be saved as a list. The list can be fed into further queries or combined with other lists using set operations to create further lists. At any stage, individual entities or lists can be examined in more detail through the list analysis and report pages.

References

    1. Motenko H., Neuhauser S.B., O’Keefe M.. et al. (2015) MouseMine: a new data warehouse for MGI. Mamm. Genome, 26, 325–330. - PMC - PubMed
    1. Wang S. J., Laulederkind S.J.F., Hayman G.T.. et al. (2013) Analysis of disease-associated objects at the Rat Genome Database. Database, 2013, bat046. - PMC - PubMed
    1. Ruzicka L., Bradford Y.M., Frazer K.. et al. (2015) ZFIN, The zebrafish model organism database: Updates and new directions. Genesis, 53, 498–509. - PMC - PubMed
    1. Lyne R., Smith R., Rutherford K.. et al. (2007) FlyMine: an integrated database for Drosophila and Anopheles genomics. Genome Biol., 8, R129. - PMC - PubMed
    1. Balakrishnan R., Park J., Karra K.. et al. (2012) YeastMine—an integrated data warehouse for Saccharomyces cerevisiae data as a multipurpose tool-kit. Database, 2012, bar062. - PMC - PubMed

Publication types