. 2022 Sep 6;3(5):444-467.
doi: 10.1158/2643-3230.BCD-21-0226.

PU.1-Dependent Enhancer Inhibition Separates Tet2-Deficient Hematopoiesis from Malignant Transformation

Affiliations

PU.1-Dependent Enhancer Inhibition Separates Tet2-Deficient Hematopoiesis from Malignant Transformation

Maria M Aivalioti et al. Blood Cancer Discov. .

Abstract

Cytosine hypermethylation in and around DNA-binding sites of master transcription factors, including PU.1, occurs in aging hematopoietic stem cells following acquired loss-of-function mutations of DNA methyl-cytosine dioxygenase ten-eleven translocation-2 (TET2), albeit functional relevance has been unclear. We show that Tet2-deficient mouse hematopoietic stem and progenitor cells undergo malignant transformation upon compromised gene regulation through heterozygous deletion of an upstream regulatory region (UREΔ/WT) of the PU.1 gene. Although compatible with multilineage blood formation at young age, Tet2-deficient PU.1 UREΔ/WT mice develop highly penetrant, transplantable acute myeloid leukemia (AML) during aging. Leukemic stem and progenitor cells show hypermethylation at putative PU.1-binding sites, fail to activate myeloid enhancers, and are hallmarked by a signature of genes with impaired expression shared with human AML. Our study demonstrates that Tet2 and PU.1 jointly suppress leukemogenesis and uncovers a methylation-sensitive PU.1-dependent gene network as a unifying molecular vulnerability associated with AML.

Significance: We identify moderately impaired PU.1 mRNA expression as a biological modality predisposing Tet2-deficient hematopoietic stem and progenitor cells to malignant transformation. Our study furthermore uncovers a methylation-sensitive PU.1 gene network as a common feature of myeloid leukemia potentially allowing for the identification of patients at risk for malignant transformation. See related commentary by Schleicher and Pietras, p. 378. This article is highlighted in the In This Issue feature, p. 369.


Figures

Figure 1.
Figure 1.
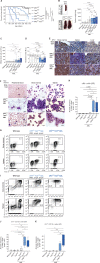
Progressive inhibition of PU.1 during leukemic evolution. A, PU.1 mRNA expression levels in preleukemic HSC relative to healthy MPP, expressed as fold change. HSC (N = 12 samples) and MPP (N = 4 samples) are human-derived samples. Plotted are fold changes, represented as min-to-max box and whiskers graph and line at the median. Fold change was calculated using counts from the GSE74246 RNA-seq data set. Significance was assessed using an unpaired Student t test, indicated as ns (not significant). B, PU.1 mRNA expression levels in LSCs relative to healthy GMPs, expressed as fold change. LSC (N = 8 samples) and GMP (N = 4 samples) are human-derived samples. Plotted is fold change, represented as min-to-max box and whiskers graph and line at the median. Fold change was calculated using counts from the GSE74246 RNA-sequencing data set. Significance was assessed using an unpaired Student t test, indicated as ***, P ≤ 0.001. C, PU.1 mRNA expression levels in the bulk blast population, relative to healthy monocytes, expressed as fold change. Blast population (N = 12 samples) and monocytes (N = 4 samples) are human-derived samples. Plotted is fold change, represented as min-to-max box and whiskers graph and line at the median. Fold change was calculated using counts from the GSE74246 RNA-sequencing data set. Significance was assessed using an unpaired Student t test, indicated as **, P ≤ 0.01. D, Comparative upstream regulator analysis using DEGs from preleukemic, ARCH HSCs (vs. MPP controls) or LSCs (vs. GMP controls), from GSE74246, that carry clonal hematopoiesis (Dnmt3a, Tet2, and IDH1/2)- or other AML-associated mutations (NPM1 and Flt3). HSC (N = 12) and LSC (N = 8) are human-derived samples. Plotted is z score (z ≥ 2 denotes activation; z ≤ −2 denotes inhibition), calculated through the built-in function of the IPA software. E, Upstream regulator analysis using DESeq2-determined DEGs from a comparison of mouse Tet2-deficient CD4CD8aCD19B220Ter119 cKit+ cells (Tet2HET and Tet2KO) vs. WT CD4CD8aCD19B220Ter119 cKit+ cells. Plotted is z score (z ≥ 2 denotes activation; z ≤ −2 denotes inhibition), calculated through the built-in function of the IPA software. N = 2 independent RNA-seq experiments. F, Comparative upstream regulator analysis of DEGs between Tet2KO LSK vs. Tet2 WT LSK (GSE132090) and Tet2KO GMP vs. Tet2 WT GMP (GSE27816). Tet2KO LSK (N = 2), Tet2 WT LSK (N = 2), Tet2KO GMP (N = 2), and Tet2 WT GMP (N = 2) are mouse-derived, and DEGs were determined by DESeq2 analysis of published RNA-seq data values (GSE132090 and GSE27816). Plotted is z score (z ≥ 2 denotes activation; z ≤ −2 denotes inhibition), calculated through the built-in function of the IPA software.
Figure 2.
Figure 2.
Tet2-deficient mice develop AML upon perturbation of PU.1 gene regulation during aging. A, Kaplan–Meier survival analysis of UREHETTet2HET, UREHETTet2KO, and UREKOTet2HET mice (same mice as in Supplementary Fig. S2A), along with single mutant controls. Data are plotted as a percentage of nonmoribund mice at indicated days since their birth. Significance was assessed using the log-rank test (GraphPad Prism). B, Pictures of spleens, depicting size of age-matched WT, UREHETTet2HET, and UREHETTet2KO mice (left) and spleen weights of UREHETTet2HET (N = 10), UREHETTet2KO (N = 7), and UREKOTet2HET (N = 5; same mice as in Supplementary Fig. S2A) and age-matched WT (N = 11) and single mutant control mice (N = 9–15; right). Individual samples in each group are indicated as circles. Mouse spleens were analyzed in independent experiments. Data represent mean ± SD. Significance was assessed using an unpaired Student t test and is indicated as ns, not significant. C and D, WBC (N = 5–14) and RBC levels (N = 5–16) of leukemic mice and age-matched WT and single mutant control animals. Individual samples in each group are indicated as circles. Mice blood counts were analyzed in independent experiments. Data represent mean ± SD. Significance was assessed using an unpaired Student t test and is indicated as ns, not significant. E, Myeloperoxidase (MPO) stain of bone marrow, spleen, and liver sections from WT and leukemic compound mutant mice. Scale bars indicate 20 μm. F, May-Giemsa stain of peripheral blood, bone marrow, and spleen cell cytospins from WT and compound mutant mice with AML. Scale bars indicate 20 μm. G, Representative flow cytometry plots of cKit antigen presentation on bone marrow and spleen cells from leukemic compound mutant mice and age-matched WT controls. Plots are gated at single, CD4CD8aB220 (Lymph) cells, as in Supplementary Fig. S1M. H, Graphical representation of the calculated absolute frequency of Lymph cKit+ cells in the spleens of compound mutant mice (N = 7–8), and age-matched WT (N = 3) and single-gene mutant parental (N = 4–7) controls. Spleen cell-surface antigen expression was analyzed in independent experiments. Data are plotted as min-to-max box and whiskers graphs, with a line at the median. Significance was assessed using an unpaired Student t test and is indicated as ns, not significant. I, Representative flow cytometry plots of Gr-1 and CD11b antigen presentation on bone marrow and spleen cells from leukemic compound mutant mice and age-matched WT controls. Plots are gated at single Lymph cells, as in Supplementary Fig. S1M. J and K, Graphical representation of the calculated absolute frequency of Lymph Gr-1+CD11b+ and Lymph Gr-1+CD11b cells in the spleens of compound mutant mice (N = 4–6) and age-matched WT (N = 3) and single gene-mutant parental (N = 3–6) controls. Spleen cell-surface antigen expression was analyzed in independent experiments. Data are plotted as min-to-max box and whiskers graphs, with a line at the median. Significance was assessed using an unpaired Student t test and is indicated as *, P ≤ 0.05; **, P ≤ 0.01; ***, P ≤ 0.001; ****, P ≤ 0.0001.
Figure 3.
Figure 3.
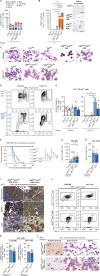
Cell-intrinsic defects in self-renewal and differentiation are hallmarks of compound mutant leukemia. A–E, Serial replating colony-forming assay (eight platings: 1°–8°) of TBM cells from UREHETTet2HET and UREHETTet2KO mice with AML or age-matched parental controls (N = 3–4 per genotype, N = 4 independent experiments). A and B, Number of colony-forming units (cfu)-granulocyte/erythrocyte/monocyte/megakaryocyte (Cfu-GEMM), cfu-granulocyte/monocyte (Cfu-GM), (Cfu)-granulocyte (Cfu-G), cfu-monocyte (Cfu-M), burst-forming units-erythroid (Bfu-E), cfu-erythrocyte/megakaryocyte (Cfu-E/Mk), and of colonies containing undifferentiated blastlike cells (Blast), at plating 1 (A) and 8 (B, left). Data represent mean ± SD. Significance was assessed using an unpaired Student t test. Colony morphology of cells after the eighth round of plating (B, right). Scale bars are 1,000 μm. C, May-Giemsa stain of leukemic compound mutant and parental control cells, at primary and late (>7th) plating. Stain was performed in independent experiments. Scale bars are 20 μm. D, Representative flow cytometry plots of Gr-1 and CD11b antigen presentation on colony assay-derived cells (primary and late (>7th) plating) from leukemic compound mutant mice, gated at single, CD4CD8aCD19B220 (Lymph) cells, as in Supplementary Fig. S3C (stain 1). E, Graphical representation of the calculated absolute frequency of Lymph Gr-1+CD11bLo cells from colony-assay–derived cells, at primary and late (>7th) platings. Data represent mean ± SEM. Significance was assessed using ordinary one-way ANOVA. F–L, Bone marrow transplantation assay of total nucleated bone marrow cells (total BM) or cKit+ leukemic or total BM control cells, into sublethally irradiated NSG mice (N = 2 donors per genotype; N = 2–12 NSG recipients per genotype in five independent experiments). F, Kaplan–Meier survival analysis of total BM-transplanted recipient mice. Data are plotted as a percentage of nonmoribund mice at indicated days, post bone marrow transplantation. Significance was assessed using the log-rank test. G, Spleen weights of transplanted mice with control or leukemic mice-derived total BM cells. Data represent mean ± SD. Significance was assessed using an unpaired Student t test. H, Spleen weights of transplanted mice with leukemic mice-derived cKit+ BM cells. Data represent mean ± SD. I, MPO stain of bone marrow, spleen, and liver sections of leukemic compound mutant mice cKit+ cell-transplanted mice. Scale bars are 20 μm. J, Flow cytometry plots of cKit antigen presentation on bone marrow cells of recipients of total BM- and cKit+ cells, gated at single, CD45.2+ CD45.1 Lymph cells, as in Supplementary Fig. S4A. K, Graphical representation of the relative frequency of CD45.2+ CD45.1 Lymph cKit+ cells in the bone marrow of total BM- and cKit+ cell-transplanted recipients. Data represent mean ± SD. L, Cytospins of peripheral blood, bone marrow, and spleens of compound mutant cKit+ AML cell recipients. Scale bars are 20 μm. *, P ≤ 0.05; **, P ≤ 0.01; ***, P ≤ 0.001; ****, P ≤ 0.0001.
Figure 4.
Figure 4.
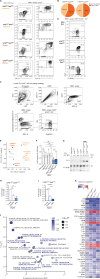
Loss of PU.1-mediated gene regulation irrespective of relative PU.1 mRNA or protein levels. A and B, Heterogeneity of the compound mutant AML phenotype. A, Representative flow cytometry plots of cKit (left) and Gr-1 CD11b (right) antigen presentation on the surface of bone marrow cells from leukemic mice with immature and mature characteristics. Plots shown are gated at single, CD4 CD8aB220 (Lymph) cells, as in Supplementary Fig. S1M. Mice bone marrow cell-surface antigen expression was analyzed in independent experiments. B, Percentage of mice that presented with immature and mature AML. C, Cell sort gating strategy. Cells were sorted by gating at single, viable, CD4CD8aCD19B220 (Lymph) Ter119 cKit+ cells in independent experiments. D, Example of gating on cKit+ cells in WT and compound mutant samples. E, PCA of gene expression of leukemic and age-matched WT mice. N = 2 in independent experiments. F, PU.1 mRNA expression levels in leukemic and parental control animals, dichotomizing mice in PU.1Hi and PU.1Low-expressing. N = 2–3 per genotype. Plotted are RNA-seq transcripts per million expressed as fold change of WT. Significance was assessed using unpaired Student t test and is indicated as ns, not significant. Data represent mean ± SD. G, Quantification of PU.1 protein abundance in bead-sorted cKit+ cells from moribund UREHETTet2HET, UREHETTet2KO mice with AML or age-matched WT and single mutant control mice using Western blot analysis. Values on top of blots indicate image-assisted protein quantification, as tubulin-normalized fold changes compared with wild-type controls (FC WT). H, qRT-PCR analysis of PU.1 mRNA expression levels in FACS-purified LSK cells of young, aged, and leukemic UREHETTet2HET mice. Data are expressed as fold change to young compound mutant mice. N = 2–3 mice per age group and per genotype. N = 2 in independent qPCR experiments. Significance was assessed using an unpaired Student t test. Data represent mean ± SD. I, qRT-PCR analysis of PU.1 mRNA expression levels in FACS-purified LSK cells of young, aged, and leukemic UREHETTet2KO mice. Data are expressed as fold change to young compound mutant mice. N = 2–3 mice per age group and per genotype. N = 2 independent qPCR experiments. Significance was assessed using an unpaired Student t test. Data represent mean ± SD. J, GSEA of DEGs in leukemic animals. DEGs were determined by DESeq2. Significance was assessed using the built-in function of GSEA. K, Comparative pathway analysis (IPA) of DEGs in compound mutant mice (vs. WT), showing similarities in upstream regulators, among the leukemic genotypes and PU.1Hi and PU.1Low mice. Significance was assessed using the built-in function of IPA and is indicated as z score. z score ≥ 2 denotes activation; z score ≤ −2 denotes inhibition. **, P ≤ 0.01; ***, P ≤ 0.001; ****, P ≤ 0.0001.
Figure 5.
Figure 5.
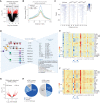
Loss of PU.1-mediated enhancer activity governing proper myeloid differentiation in compound mutant mice with leukemia. A, Volcano plot showing differential chromatin status in leukemic animals (N = 3 PU.1Low AML vs. N = 9 nonleukemic). Significance was assessed using the built-in function of the respective R/Bioconductor package, described in the Methods. B and C, Quantitative enrichment analysis plot (B) and heat map (C) representing chromatin accessibility in WT (N = 3 pooled mice), UREHETTet2HET (N = 2 biological replicates), and UREHETTet2KO mice (N = 2 biological replicates). Data are expressed as mean normalized read coverage across the indicated regions (monocytic- and neutrophilic-specific enhancers), which were split into 100 bins. Significance was assessed using Wilcoxon ranked-sum tests with correction for multiple testing. D, Schematic showing the 20 cell types and 8 epigenetic features that were used for annotation of 27 epigenetic states and their representation in each of the cell types. Epigenetic states are defined by 1–5 capital letters that are described in the legend. E and F, Heatmaps of differential chromatin status, in UREHETTet2HET (N = 2 biological replicates; vs. N = 3 WT; E) and UREHETTet2KO (N = 2 biological replicates; vs. N = 3 WT; F) mice, contrasted to the IDEAS cell type–specific epigenomic states (37). Significance was assessed using the built-in function of the respective R/Bioconductor package, described in the Methods. G, Differentially expressed enhancer RNAs (eRNA) that correspond to cis-regulatory elements (cCRE) in leukemic animals (PU.1Low AML vs. WT). Significance was assessed using the respective R/Bioconductor package, described in the Methods. N = 2 independent RNA-seq experiments. H, Pie charts with the percentages of PU.1 or Tet2 targets or not, present at cCREs in closed (left) or open (right) chromatin regions.
Figure 6.
Figure 6.
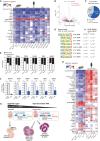
Suppression of a distinct set of direct PU.1 targets is shared between mouse and human myeloid leukemia. A, Comparative upstream regulator analysis of DEGs in compound mutant HPSC from leukemic mice and blast cells from patients with myeloid malignancies (AML, APL, MDS; accession numbers of publicly available data sets are shown at the bottom of the heatmap), showing significant similarities. Significance was assessed using the built-in function of the IPA software and is indicated as z score. z score ≥ 2 denotes activation; z score ≤ −2 denotes inhibition. B, Volcano plot of DEGs (PU.1Low AML vs. WT), showing ETV6–RUNX1-associated targets (in red) with significant expression deregulation. Significance was assessed using the built-in function of the respective R/Bioconductor package. C, Pie chart illustrating the fraction of PU.1 and Tet2 direct targets at cCRE in closed chromatin regions, within the group of ETV6–RUNX1-associated downstream genes. PU.1 and Tet2 targets are defined as overlapping cCRE with PU.1/Tet2 binding, derived from published ChIP-seq data (GSE50762 and GSE115965). D, HOMER motif enrichment analysis of all cCRE-associated closed chromatin loci (P value on the left column) or ETV6–RUNX1-associated genes (P value on the right column) in leukemic animals (PU.1Low AML vs. WT). Significance was assessed using the built-in function of the HOMER software. E, Percentage of methylation states in regions at and around PU.1 motifs at enhancers of PU.1/ETV6–RUNX1-associated targets in compound mutant mice (N = 2 biological replicates) compared with WT controls (N = 3 pooled mice). CD4CD8aCD19B220 (Lymph) Ter119 cKit+ cells were sorted as in Fig. 4C and D in independent experiments. Significance was assessed using the Fisher exact test. F, qRT-PCR analysis of expression of PU.1/ETV6–RUNX1-associated targets in FACS-purified GMP cells of leukemic mice, relative to healthy age-matched compound mutant animals (healthy aged; N = 3–5 biological replicates). qRT-PCR analysis was performed in four independent experiments. GMP were sorted as indicated in the gating strategy in Supplementary Fig. S7D. Significance was assessed using an unpaired Student t test and is indicated as **, P ≤ 0.01; ***, P ≤ 0.001; ****, P ≤ 0.0001. G, Comparative upstream regulator analysis of DEGs from leukemic compound mutant mice and human healthy ARCH HSC (all combined or Tet2-, Dnmt3a-, IDH1/2-, NPM1-mutated) from a published data set (GSE74246). Significance was assessed using the built-in function of the IPA software and is indicated as z score. z score ≥ 2 denotes activation; z score ≤ −2 denotes inhibition. H, Proposed mechanistic model (created with BioRender.com). Enhancer-mediated PU.1 dysregulation (modeled herein through heterozygous deletion of the −14 kb URE of the PU.1 encoding gene) predisposes Tet2-deficient HSPC to AML. Reduced PU.1 mRNA expression is compatible with nonleukemic hematopoiesis in compound mutant mice. Healthy aged compound mutant UREΔ/WTTet2-deficient HSPC (left) gave rise to myeloid cells with full maturation capacity and expression of genes regulated by PU.1-associated methylation-sensitive ETS sites (methETS). In contrast, leukemic compound mutant HSPC (right) showed a signature of PU.1-associated methETS motif bearing, hypermethylated genes with loss of expression. Functionally, leukemic HPSC gave rise to myeloid precursor cells with a stage-specific differentiation block at immature monocytic and more mature neutrophilic blast levels.

Comment in

References

    1. Jaiswal S, Fontanillas P, Flannick J, Manning A, Grauman PV, Mar BG, et al. . Age-related clonal hematopoiesis associated with adverse outcomes. N Engl J Med 2014;371:2488–98. - PMC - PubMed
    1. Fuster JJ, MacLauchlan S, Zuriaga MA, Polackal MN, Ostriker AC, Chakraborty R, et al. . Clonal hematopoiesis associated with TET2 deficiency accelerates atherosclerosis development in mice. Science 2017;355:842–7. - PMC - PubMed
    1. Jaiswal S, Natarajan P, Silver AJ, Gibson CJ, Bick AG, Shvartz E, et al. . Clonal hematopoiesis and risk of atherosclerotic cardiovascular disease. N Engl J Med 2017;377:111–21. - PMC - PubMed
    1. Bonnefond A, Skrobek B, Lobbens S, Eury E, Thuillier D, Cauchi S, et al. . Association between large detectable clonal mosaicism and type 2 diabetes with vascular complications. Nat Genet 2013;45:1040–3. - PubMed
    1. Jan M, Snyder TM, Corces-Zimmerman MR, Vyas P, Weissman IL, Quake SR, et al. . Clonal evolution of preleukemic hematopoietic stem cells precedes human acute myeloid leukemia. Sci Transl Med 2012;4:149ra18. - PMC - PubMed