. 2022 Oct:490:37-49.
doi: 10.1016/j.ydbio.2022.07.001. Epub 2022 Jul 9.

Peripheral nerve development in zebrafish requires muscle patterning by tcf15/paraxis

Affiliations

Peripheral nerve development in zebrafish requires muscle patterning by tcf15/paraxis

Lauren E Limbach et al. Dev Biol. 2022 Oct.

Abstract

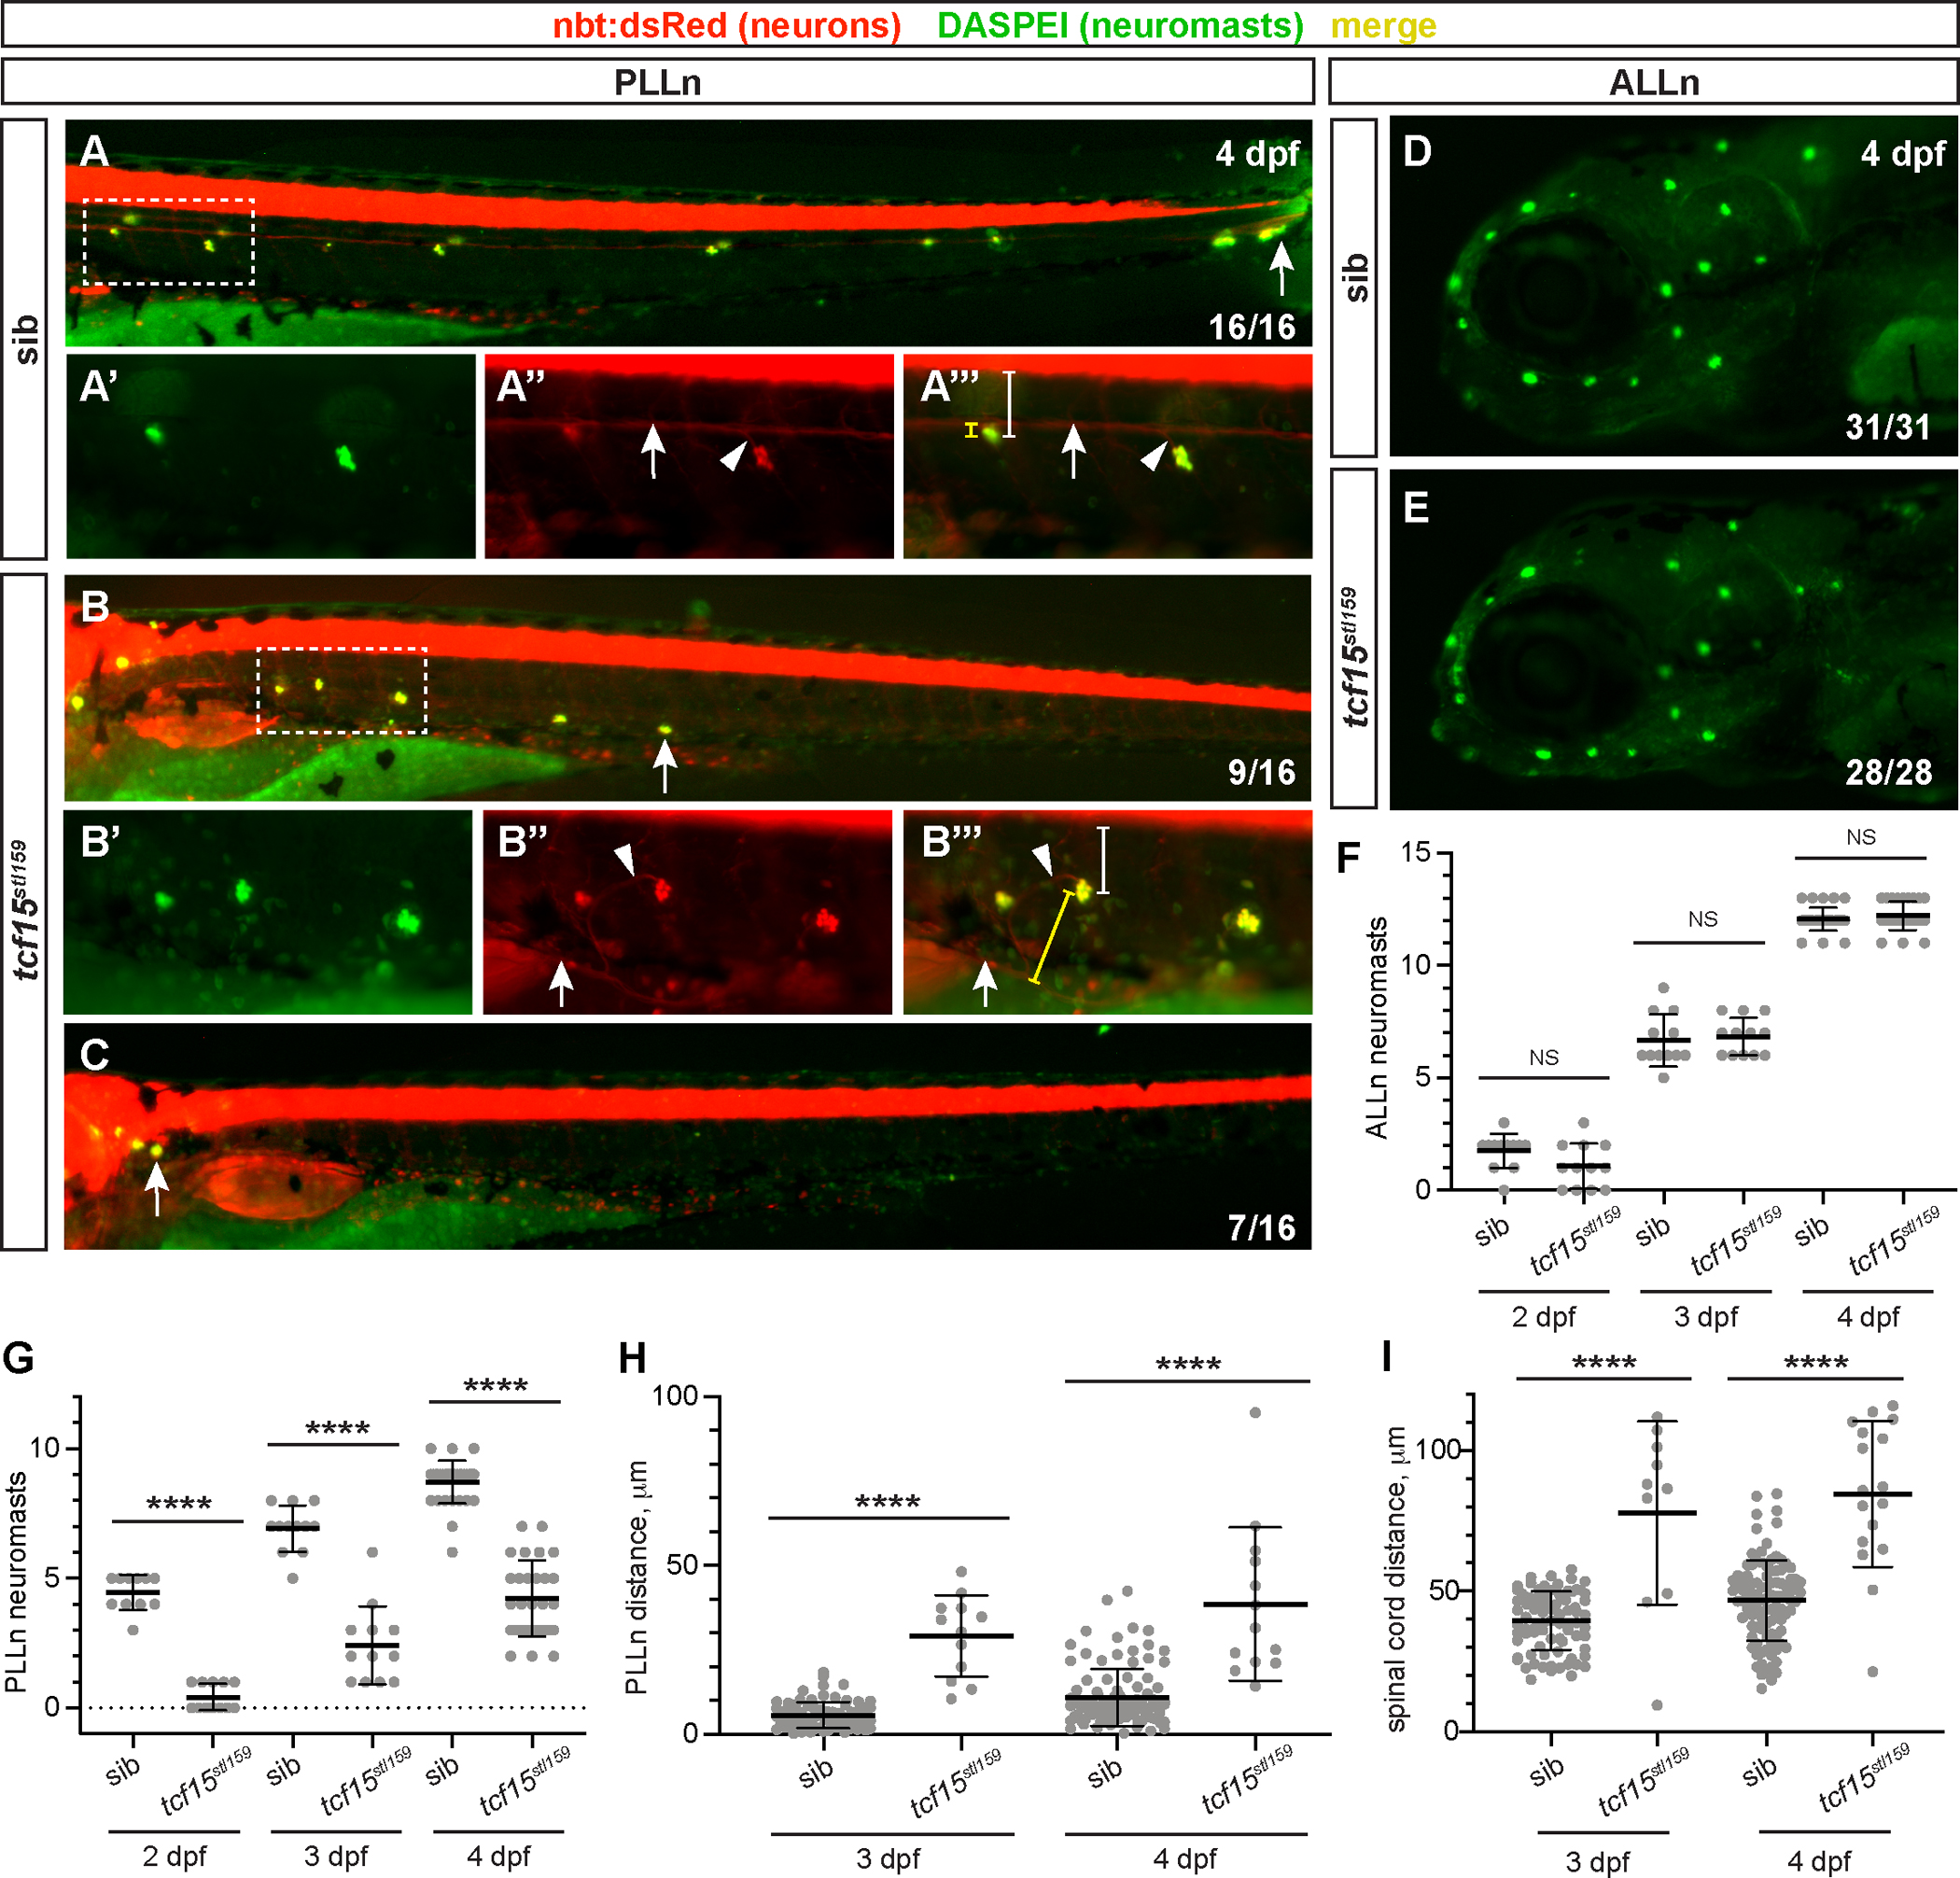
The vertebrate peripheral nervous system (PNS) is an intricate network that conveys sensory and motor information throughout the body. During development, extracellular cues direct the migration of axons and glia through peripheral tissues. Currently, the suite of molecules that govern PNS axon-glial patterning is incompletely understood. To elucidate factors that are critical for peripheral nerve development, we characterized the novel zebrafish mutant, stl159, that exhibits abnormalities in PNS patterning. In these mutants, motor and sensory nerves that develop adjacent to axial muscle fail to extend normally, and neuromasts in the posterior lateral line system, as well as neural crest-derived melanocytes, are incorrectly positioned. The stl159 genetic lesion lies in the basic helix-loop-helix (bHLH) transcription factor tcf15, which has been previously implicated in proper development of axial muscles. We find that targeted loss of tcf15 via CRISPR-Cas9 genome editing results in the PNS patterning abnormalities observed in stl159 mutants. Because tcf15 is expressed in developing muscle prior to nerve extension, rather than in neurons or glia, we predict that tcf15 non-cell-autonomously promotes peripheral nerve patterning in zebrafish through regulation of extracellular patterning cues. Our work underscores the importance of muscle-derived factors in PNS development.

Keywords: Lateral line nerve; Myelin; Paraxial mesoderm; Schwann cells; Zebrafish.


Conflict of interest statement

Declaration of competing interest The authors declare no conflicts of interest.

Figures

Fig. 1.
Fig. 1.. stl159 mutants have mispatterned neural crest cell derivatives.
(A–B) mbp expression in sibling (sib, A) and mutant (B) 5 dpf larvae stained via whole-mount in situ hybridization. Arrows indicate region of magnification for PLLn (A′-B′); arrowheads for ALLn (A″-B″). (C–D) Quantification of mbp phenotype among larval progeny of carrier in-cross. Bracket indicates stl159 PLLn-specific mutant phenotype in ~25% of larvae. *p < 0.05, ***p < 0.001, Fisher’s Exact test, normal (blue) vs. mutant (gray) phenotypes. Categorical definitions are reported in Methods. (C) Presence of mbp staining along ALLn and PLLn trajectory (full, partial, or absent) at 3 and 5 dpf. (D) Intensity of mbp staining along ALLn and PLLn trajectory (normal, reduced, or absent) at 3 and 5 dpf. (E–F) sox10:megfp labels neurons and glia including Schwann cells and precursors in the PLLn in sibling (E) and mutant (F) 3 dpf larvae. Arrows represent regions of magnification in the anterior (E′-F′) and more posterior, near the end of the yolk extension (E″-F″); scale bar, 20 μm. High-resolution imaging in E″-F″ shows individual glial cells on the PLLn marked with arrowheads. Dotted line in stl159 mutant (F″) indicates a non-PLLn GFP-labeled cell; asterisk marks a pigment cell obscuring PLLn fluorescence. Scale bar represents 100 μm in E-F, 20 μm in E′-F′ and E″-F″. (G) Quantification of sox10:megfp cells in the PLLn at 3 dpf along muscle segments 9–11. ****p < 0.0001, Student’s t-test. (H–I) Brightfield imaging showing melanocyte patterning in sibling (H) and mutant (I) 5 dpf larvae. Arrowheads indicate region of magnification just posterior to the ear; arrows for lateral body wall.
Fig. 2.
Fig. 2.. Mutation in tcf15 is causative for the stl159 phenotype.
(A) Whole genome sequencing reveals highest mutant/WT allele ratio on chromosome 8 (red box). Only SNP ratios >0.85 are shown on graph. (B) SNPs within region of strongest linkage are shown with wild-type in black and mutant SNP in red. Only tcf15 (bold) contains a nonsense allele. (C) Map of predicted unspliced tcf15 transcript is shown 5′ to 3′ with two introns marked in blue. The C to T substitution occurs at position 232 and produces a TAA stop codon that truncates the protein from 183 to 77 amino acids (aa). (D) Representative Sanger sequencing electropherograms of wild-type, stl159/+, and homozygous stl159 mutants in the tcf15 locus. Note transition of C (blue) in wild-type to T (red) in stl159. (E) Map of tcf15 transcript shown 5′ to 3′ with sgRNA targets sites marked in boxed A-C. sgRNA-A is in 5′ UTR 266 nucleotides upstream of the start site, while sgRNA-B and C both lie within the first intron (blue) at +21 and + 181. The stl159 C to T transition is marked for reference. (F) Quantification of tcf15 CRISPR enhancement of stl159 based on pigment phenotype. **p < 0.01, ****p < 0.0001, Fisher’s exact test wild-type vs. stl159 mutant pigment phenotype.
Fig. 3.
Fig. 3.. tcf15 is required for proper PLLn extension.
(A) Immunostaining for acetylated tubulin (AcTub) in sibling (sib, A) and tcf15stl159 (B) larvae at 5 dpf, immediately posterior to the PLL ganglia. Arrow indicates PLLn, which is bundled and extended in siblings and stalled in tcf15stl159; asterisk marks misplaced melanocyte in mutant. Scale bar, 100 μm. (C) Quantification of the farthest muscle segment position of the PLLn in siblings and tcf15stl159 larvae at 3 dpf. Tcf15stl159 larvae are divided into two categories, those in which a PLLn extended posteriorly from the ganglion (“extend”) and those in which a PLLn was not observed along the lateral body wall posterior to the ganglion (“stall/anterior”). All groups are significantly different from each other, p < 0.0001, 1-way ANOVA with Tukey test. (D–L) nbt:dsRed expression in the same PLLn of individual larvae at 36, 48, and 72 hpf. All images were taken at the same magnification immediately posterior to the PLL ganglion. Motor nerves are apparent but not quantified in these images. D-F represents a single sibling larva; G-I is a tcf15stl159 larva with stalled and misrouted extension, and J-L is a tcf15stl159 larva with no PLLn extension by 72 hpf. Arrows mark the PLLn at the anterior (left) and posterior-most position (right) in D-I; no PLLn is visible in J-L. Scale bar, 100 μm (M) Quantification of the farthest muscle segment position of the PLLn in individual sibling and tcf15stl159 larvae at 2 and 4 dpf. Each larva is represented in a different color and 2–4 dpf data points are connected with a line. (N) Representation of change in farthest PLLn position from 2 to 4 dpf for the sibling and tcf15stl159 larvae shown in M; there is no significant difference between groups (p > 0.05, Student’s t-test).
Fig. 4.
Fig. 4.. tcf15 is required for neuromast development.
(A–C) DASPEI stain (green) marks neuromasts in nbt:dsRed-expressing (red) sibling (sib, A) and tcf15stl159 larvae at 4 dpf. Fraction in bottom right indicates number of larvae (of 16 siblings and 16 mutants) with each phenotype, normal (A), reduced extension (B), or stalled/failed to extend posteriorly (C). Arrows in A-C mark most posterior neuromast. Scale bar, 100 μm. Dotted boxes indicate high-magnification images, for DASPEI (A′-B′), PLLn marked with nbt:dsRed and arrow (A″-B″), and merge (A″′-B″′); scale bar, 100 μm. Arrowheads mark small PLLn processes that extend to the neuromast. Distance from neuromast to PLLn is bracketed in yellow; distance from neuromast to ventral spinal cord is bracketed in white. (D–E) DASPEI staining (green) of ALLn neuromasts shows no difference in sibling (sib, A) and tcf15stl159 larvae. (F) Quantification of ALLn neuromasts on the left side of individual larvae imaged at 2, 3, and 4 dpf. No significant differences are observed between genotypes at each timepoint (p > 0.05, 1-way ANOVA with Tukey test). (G) Quantification of PLLn neuromasts on the left side of individual larvae imaged at 2, 3, and 4 dpf. At each timepoint, fewer neuromasts have developed in tcf15stl159 larvae, ****p < 0.0001, 1-way ANOVA with Tukey test. (H–I) Quantification of shortest distance from individual neuromasts to main fascicle of PLLn (H) or ventral boundary of spinal cord (I) at 3 and 4 dpf. Neuromasts are more distant from the PLLn (****p < 0.0001, 1-way ANOVA with Tukey test) and more ventral and distant from the spinal cord (****p < 0.0001, 1-way ANOVA with Tukey test) in tcf15stl159 relative to siblings.
Fig. 5.
Fig. 5.. tcf15 is required for motor nerve extension and fasciculation.
(A–D) Motor nerves in nbt:dsRed-expressing (red) at 36 (A–B) and 72 (C–D) hpf in sibling (sib) and tcf15stl159 larvae. Scale bar, 100 μm. Examples of motor nerve length measurement are indicated with a white bracketed line. PLLn are visible at 72 hpf and marked with gray arrows (C); arrowheads mark minor branches of motor nerves at 72 hpf (C–D). (E) Quantification of motor nerves on one side of 72 hpf larvae. There are slightly but significantly fewer motor nerves in tcf15stl159 relative to siblings, ****p < 0.0001, 1-way ANOVA with Tukey test. (F) Quantification of motor nerve length in sibling and tcf15stl159 larvae at 36 and 72 hpf. At both timepoints tcf15stl159 have shorter motor nerves, ****p < 0.0001, 1-way ANOVA with Tukey test. Dots represent individual motor nerves. (G) Schematic for counting motor nerve branches; both main and minor branches are counted equally. (H) Quantification of branches in motor nerves and tcf15stl159 larvae at 72 hpf. Tcf15stl159 have more branches motor nerves, ****p < 0.0001, 1-way ANOVA with Tukey test. Dots represent individual motor nerves.
Fig. 6.
Fig. 6.. tcf15 is expressed in muscle early to set up proper architecture for nerve development.
(A–C) Whole mount in situ hybridization of tcf15 in wild-type embryos at 12 hpf (A-A′), 24 hpf (B), and 3 dpf (C). Note strong expression (arrowheads) at 12 hpf that moves to the posterior by 24 hpf. No tcf15 is observed in the PLLn (arrow, C) or surrounding muscle by 3 dpf. (D–E) Brightfield imaging showing normal gross muscle patterning in sibling (E) and tcf15stl159 mutant (F) 3 dpf larvae. Bracketed lines indicate one muscle segment; white curved arrow indicates measurement of muscle boundary angle from dorsal. (F) Quantification of number of muscle segments/larvae in sibling and tcf15stl159 mutant larvae at 3 and 5 dpf. No significant difference (NS) is observed between genotype or timepoints (p > 0.05, 1-way ANOVA). (G) Quantification of body length, measured from ear to tail tip (fin excluded), of sibling and tcf15stl159 mutant larvae at 3 and 5 dpf. No significant differences (NS) are observed between genotypes at each timepoint (p > 0.05, 1-way ANOVA). (H) Quantification of angle of muscle boundary from dorsal for five representative muscle segments (from segments 8–13) in sibling and tcf15stl159 mutant larvae at 3 and 5 dpf. Angle is slightly but significantly broader in tcf15stl159 mutants relative to age-matched siblings at both timepoints, ****p < 0.0001, 1-way ANOVA. (I) Schematic of larval cross-section at 5 dpf with major anatomical features noted. Regions of interest for panels J–K and L-M are indicated with dotted boxes. (J–K) TEM of sibling (J) and tcf15stl159 mutant (K) 5 dpf larvae. Horizontal myoseptum is prominent in sibling (J, arrow) and absent in mutant. Magnified regions of interest (J′-K′) are noted with a dotted box. In sibling larva (J′), there are numerous myelinated axons (pseudocolored green) with neighboring Schwann cells (sc) and muscle (m). Unmyelinated bundles of axons (a, white arrowhead) are present at this stage. The mutant larva (K′) has disorganized muscle (m) with unidentified adjacent cells, potentially Schwann cells (*). (L–M) Ultrastructure of medial body wall muscle (m) is organized in sibling (L), but has aberrant ultrastructure in mutants with small bundle of unmyelinated axons (a, arrowhead) in mutants (M).

Similar articles

Cited by

References

    1. Banerjee S, Gordon L, Donn TM, Berti C, Moens CB, Burden SJ, Granato M, 2011. A novel role for MuSK and non-canonical Wnt signaling during segmental neural crest cell migration. Development 138, 3287–3296. 10.1242/dev.067306. - DOI - PMC - PubMed
    1. Banerjee S, Hayer K, Hogenesch JB, Granato M, 2015. Zebrafish foxc1a drives appendage-specific neural circuit development. Development 142, 753–762. 10.1242/dev.115816. - DOI - PMC - PubMed
    1. Bonanomi D, Pfaff SL, 2010. Motor axon pathfinding. Cold Spring Harbor Perspect. Biol. 2, a001735. 10.1101/cshperspect.a001735. - DOI - PMC - PubMed
    1. Bremer J, Granato M, 2016. Myosin phosphatase fine-tunes zebrafish motoneuron position during axonogenesis. PLoS Genet. 12, e1006440. 10.1371/journal.pgen.1006440. - DOI - PMC - PubMed
    1. Brosamle C, Halpern ME, 2002. Characterization of myelination in the developing zebrafish. Glia 39, 47–57. 10.1002/glia.10088. - DOI - PubMed

Publication types

Substances

LinkOut - more resources