

Clinical prediction models for mortality in patients with covid-19: external validation and individual participant data meta-analysis
- PMID: 35820692
- PMCID: PMC9273913
- DOI: 10.1136/bmj-2021-069881
Clinical prediction models for mortality in patients with covid-19: external validation and individual participant data meta-analysis
Abstract
Objective: To externally validate various prognostic models and scoring rules for predicting short term mortality in patients admitted to hospital for covid-19.
Design: Two stage individual participant data meta-analysis.
Setting: Secondary and tertiary care.
Participants: 46 914 patients across 18 countries, admitted to a hospital with polymerase chain reaction confirmed covid-19 from November 2019 to April 2021.
Data sources: Multiple (clustered) cohorts in Brazil, Belgium, China, Czech Republic, Egypt, France, Iran, Israel, Italy, Mexico, Netherlands, Portugal, Russia, Saudi Arabia, Spain, Sweden, United Kingdom, and United States previously identified by a living systematic review of covid-19 prediction models published in The BMJ, and through PROSPERO, reference checking, and expert knowledge.
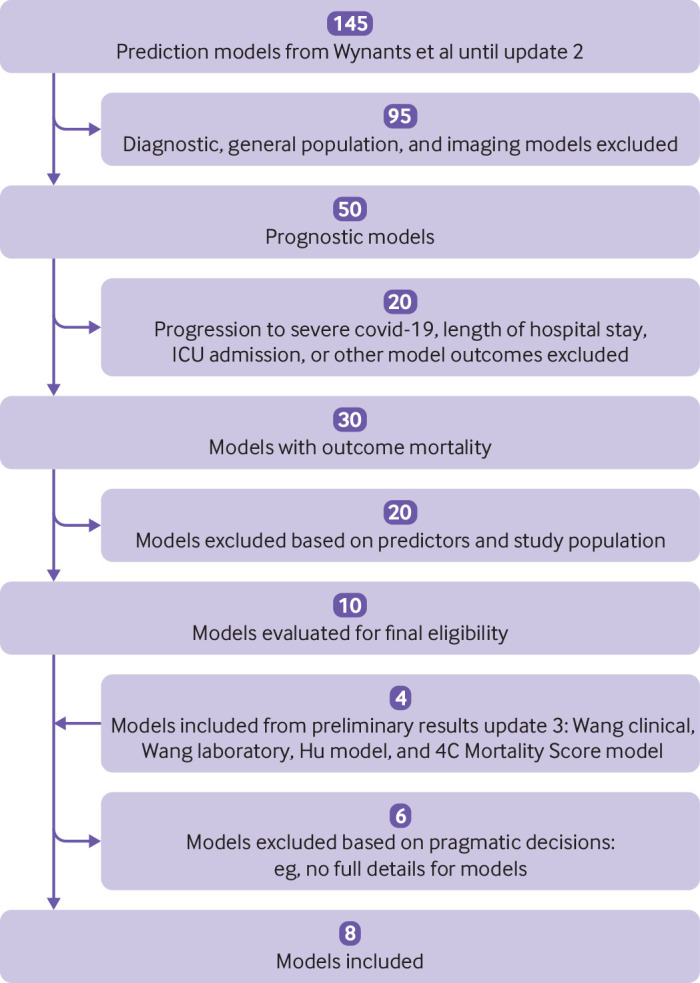
Model selection and eligibility criteria: Prognostic models identified by the living systematic review and through contacting experts. A priori models were excluded that had a high risk of bias in the participant domain of PROBAST (prediction model study risk of bias assessment tool) or for which the applicability was deemed poor.
Methods: Eight prognostic models with diverse predictors were identified and validated. A two stage individual participant data meta-analysis was performed of the estimated model concordance (C) statistic, calibration slope, calibration-in-the-large, and observed to expected ratio (O:E) across the included clusters.
Main outcome measures: 30 day mortality or in-hospital mortality.
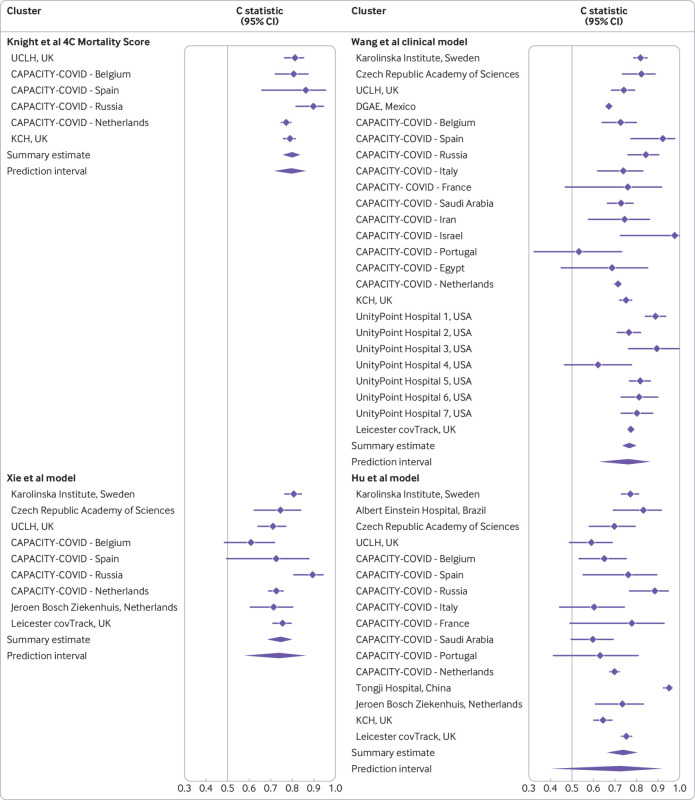
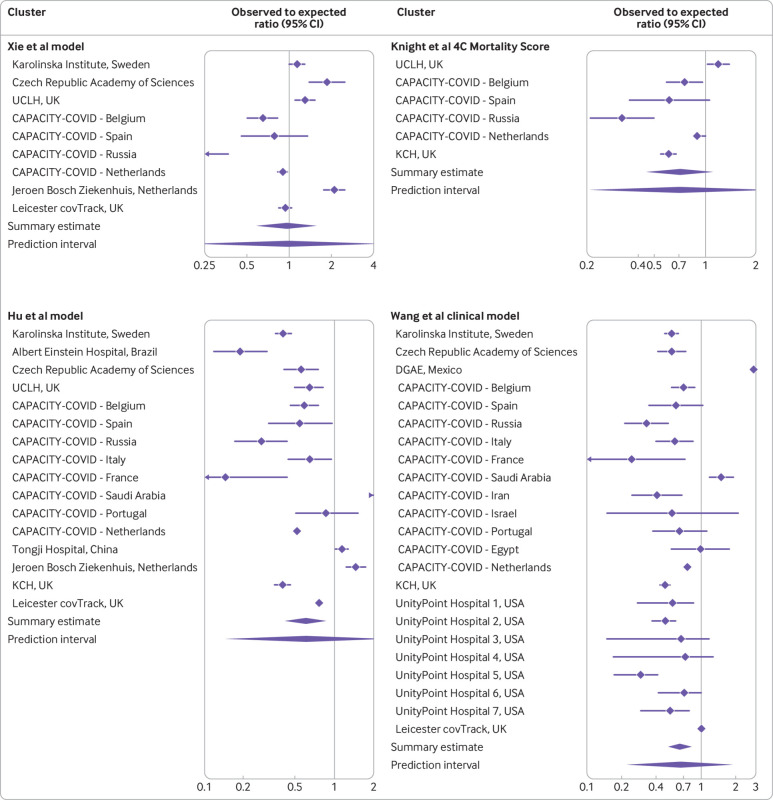
Results: Datasets included 27 clusters from 18 different countries and contained data on 46 914patients. The pooled estimates ranged from 0.67 to 0.80 (C statistic), 0.22 to 1.22 (calibration slope), and 0.18 to 2.59 (O:E ratio) and were prone to substantial between study heterogeneity. The 4C Mortality Score by Knight et al (pooled C statistic 0.80, 95% confidence interval 0.75 to 0.84, 95% prediction interval 0.72 to 0.86) and clinical model by Wang et al (0.77, 0.73 to 0.80, 0.63 to 0.87) had the highest discriminative ability. On average, 29% fewer deaths were observed than predicted by the 4C Mortality Score (pooled O:E 0.71, 95% confidence interval 0.45 to 1.11, 95% prediction interval 0.21 to 2.39), 35% fewer than predicted by the Wang clinical model (0.65, 0.52 to 0.82, 0.23 to 1.89), and 4% fewer than predicted by Xie et al's model (0.96, 0.59 to 1.55, 0.21 to 4.28).
Conclusion: The prognostic value of the included models varied greatly between the data sources. Although the Knight 4C Mortality Score and Wang clinical model appeared most promising, recalibration (intercept and slope updates) is needed before implementation in routine care.
© Author(s) (or their employer(s)) 2019. Re-use permitted under CC BY. No commercial re-use. See rights and permissions. Published by BMJ.
Conflict of interest statement
Competing interests: All authors have completed the ICMJE uniform disclosure form at https://www.icmje.org/disclosure-of-interest/ and declare: funding from the European Union’s Horizon 2020 research and innovation programme. ML and FWA have received grants from the Dutch Heart Foundation and ZonMw; FWA has received grants from Novartis Global, Sanofi Genzyme Europe, EuroQol Research Foundation, Novo Nordisk Nederland, Servier Nederland, and Daiichi Sankyo Nederland, and MM has received grants from Czech Ministry of Education, Youth and Sports for the submitted work; RKG has received grants from National Institute for Health and Care Research; FS has received an AWS DDI grant and grants from University of Sheffield and DBCLS; no financial relationships with any organisations that might have an interest in the submitted work in the previous three years; TD works with International Societiy for Pharmacoepidemiology Comparative Effectiveness Research Special Interest Group (ISPE CER SIG) on methodological topics related to covid-19 (non-financial); no other relationships or activities that could appear to have influenced the submitted work.
Figures
References
-
- Samadizadeh S, Masoudi M, Rastegar M, Salimi V, Shahbaz MB, Tahamtan A. COVID-19: Why does disease severity vary among individuals? Respir Med 2021;180:106356. https://www.resmedjournal.com/article/S0954-6111(21)00062-7/abstract. 10.1016/j.rmed.2021.106356 - DOI - PMC - PubMed
Publication types
MeSH terms
LinkOut - more resources
Full Text Sources
Medical
Miscellaneous