. 2022 Jul 12;20(1):160.
doi: 10.1186/s12915-022-01352-w.

Antagonistic effects of mitochondrial matrix and intermembrane space proteases on yeast aging

Affiliations

Antagonistic effects of mitochondrial matrix and intermembrane space proteases on yeast aging

Montserrat Vega et al. BMC Biol. .

Abstract

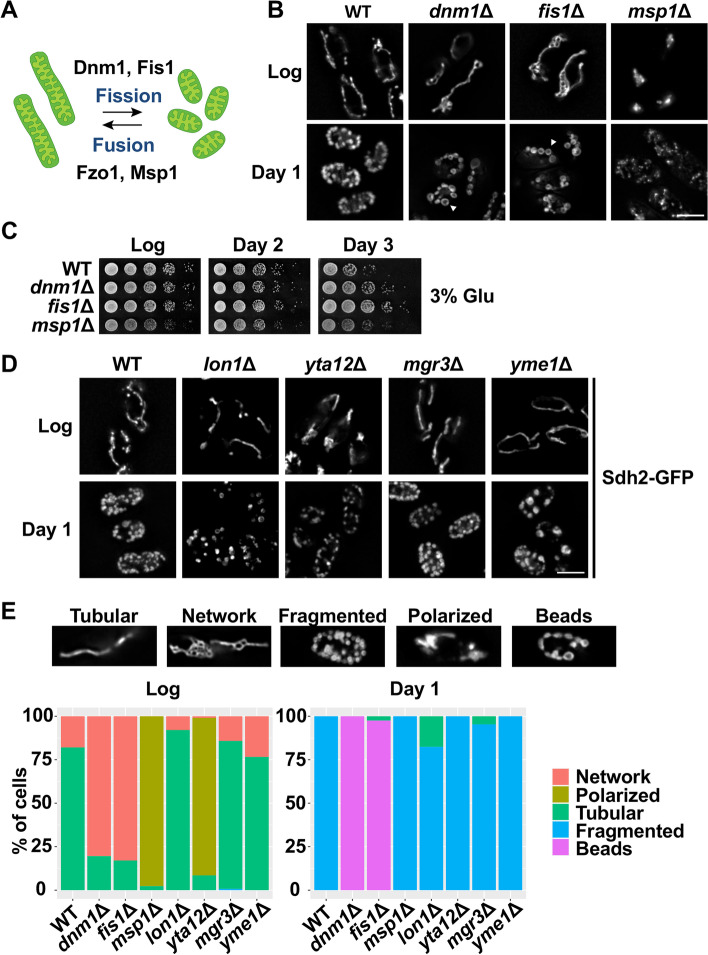
Background: In many organisms, aging is characterized by a loss of mitochondrial homeostasis. Multiple factors such as respiratory metabolism, mitochondrial fusion/fission, or mitophagy have been linked to cell longevity, but the exact impact of each one on the aging process is still unclear.

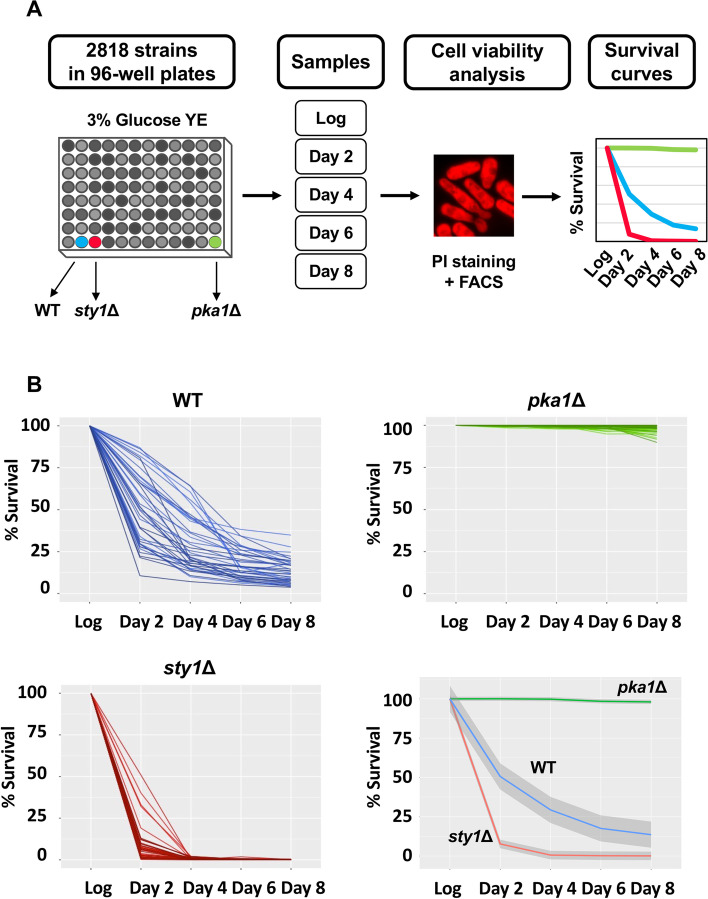
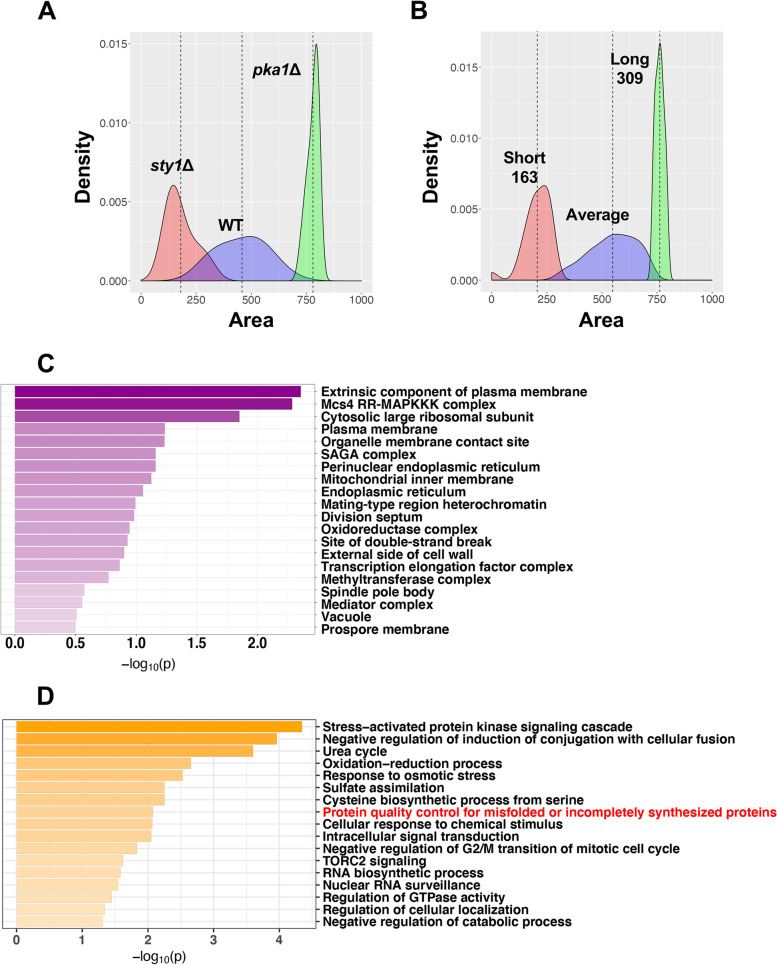
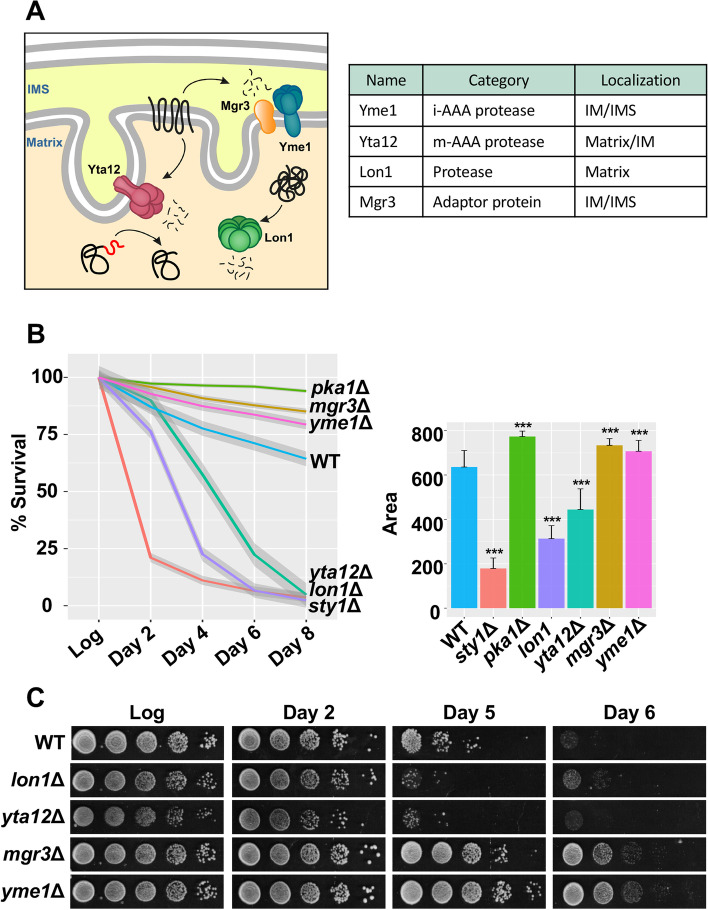
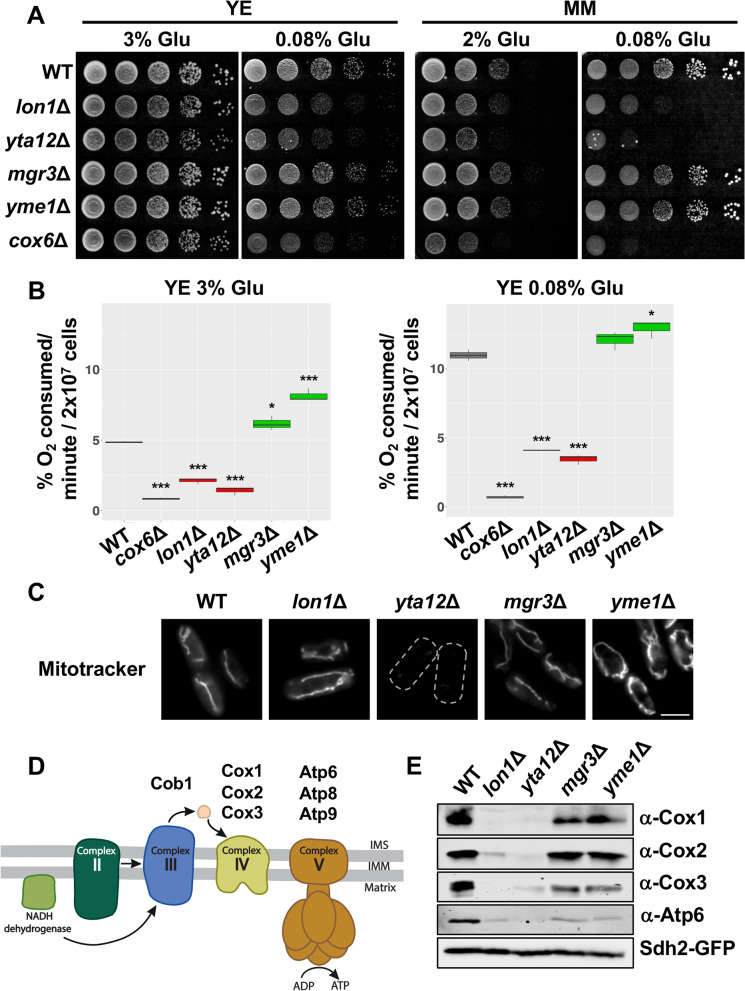
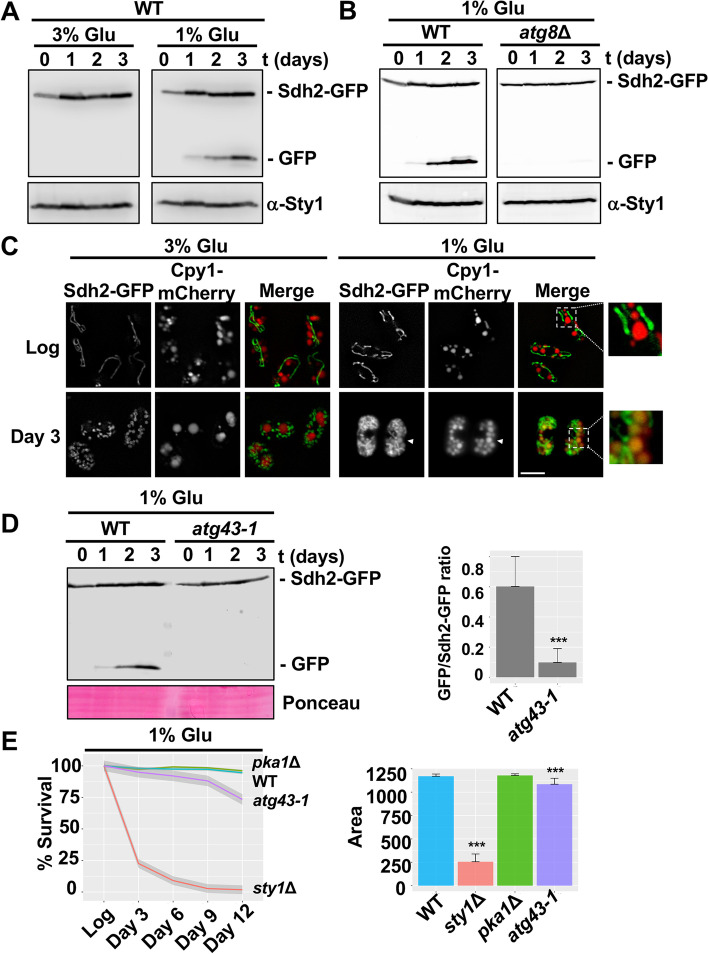
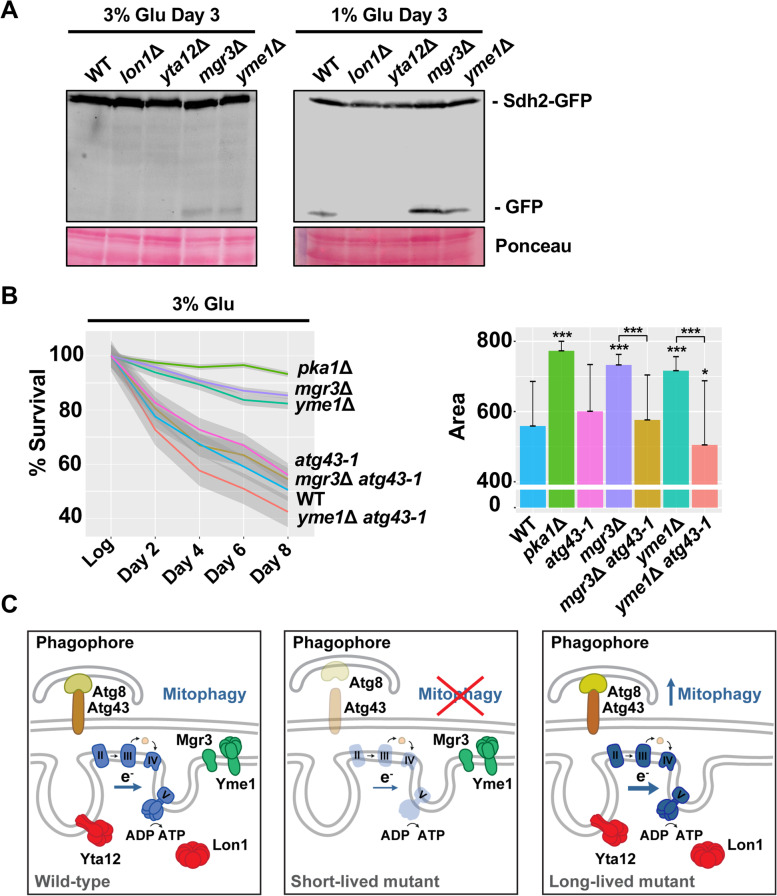
Results: Using the deletion mutant collection of the fission yeast Schizosaccharomyces pombe, we have developed a genome-wide screening for mutants with altered chronological lifespan. We have identified four mutants associated with proteolysis at the mitochondria that exhibit opposite effects on longevity. The analysis of the respiratory activity of these mutants revealed a positive correlation between increased respiration rate and prolonged lifespan. We also found that the phenotype of the long-lived protease mutants could not be explained by impaired mitochondrial fusion/fission activities, but it was dependent on mitophagy induction. The anti-aging role of mitophagy was supported by the effect of a mutant defective in degradation of mitochondria, which shortened lifespan of the long-lived mutants.

Conclusions: Our characterization of the mitochondrial protease mutants demonstrates that mitophagy sustains the lifespan extension of long-lived mutants displaying a higher respiration potential.

Keywords: Chronological aging; Mitochondrial dynamics; Mitophagy; Mitoproteases; Respiratory capacity.


Conflict of interest statement

The authors declare no competing interests.

Figures

Fig. 1
Fig. 1
Chronological aging screening. A Experimental design for chronological aging screening. Bioneer collection plates were grown in rich media (YE) with 3% glucose, and samples were collected during logarithmic growth (Log) and days 2, 4, 6, and 8 after reaching the stationary phase. Cell viability was measured by FACS using cell staining with propidium iodide (PI). B Survival curves of control strains. Percentage of survival of 666 (WT), sty1Δ (short-lived), and pka1Δ (long-lived) strains at the indicated time points. Shadows in average curves indicate a 95% confidence interval
Fig. 2
Fig. 2
Classification of chronological aging mutants and Gene Ontology (GO) enrichment analysis. A, B Area distribution of the control strains used in the screening. Density plot showing the survival distribution of the three control strains: 666 (WT), sty1Δ (short-lived strain), and pka1Δ (long-lived strain). These distributions were considered to estimate the probability for every analyzed mutant to belong to each one of these groups. Once these posterior probabilities were calculated, each mutant was assigned to the category with the highest probability. The density plot (B) shows the resulting classification of mutants based on this approach. C, D Gene Ontology term enrichment. The long-lived (309) and short-lived (163) mutants identified in the screening were selected for GO enrichment analysis. They were classified into Cellular Component (C) and Biological Process (D) GO terms using Metascape [64]. Each bar represents a GO term ordered by statistical significance (-log10 value)
Fig. 3
Fig. 3
Deletion of mitochondrial proteases affects longevity. A Scheme and table depicting the localization of the mitochondrial proteases Lon1, Yta12, Yme1, and the adaptor protein Mgr3. B, C Deletion of the mitoproteases Lon1 or Yta12 decreases lifespan, whereas deletion of Mgr3 or Yme1 increases longevity. Strains 972 (WT), lon1Δ, yta12Δ, mgr3Δ, and yme1Δ were grown in rich media with 3% glucose and viability was measured by FACS using propidium iodide (B) and survival spots (C). B Line plot represents the local regression curves for the average survival of each strain (n > 30) at different time points. Each survival curve also displays a 95% confidence interval band. Bar plot depicts the average area under the survival curve of each strain, and error bars represent SD. Significant differences between deletion strains and wild type were determined by two-sided t-test (*p < 0.05, **p < 0.01, ***p < 0.001). C Serial dilutions of culture samples from the logarithmic phase (Log) and days 2, 5, and 6 of the stationary phase were spotted onto rich media plates
Fig. 4
Fig. 4
Short-lived strains, lon1Δ and yta12Δ, display dysfunctional mitochondria. A lon1Δ and yta12Δ exhibit a growth defect under low glucose conditions. 972 (WT), lon1Δ, yta12Δ, mgr3Δ, yme1Δ, and cox6Δ strains were grown in rich media (YE) with 3% glucose and minimal media (MM) with 2% glucose. Serial dilutions of logarithmically growing cells were spotted onto YE containing 3% or 0.08% glucose and MM containing 2% or 0.08% glucose plates. B Differences in oxygen consumption levels of mitoprotease mutants and mgr3Δ. The indicated strains were grown in rich media with 3% or 0.08% glucose. Oxygen consumption was measured when cultures reached an OD600 of 0.5. Data from three biological replicates are shown. Significant differences between deletion strains and wild type were determined by two-sided t-test (*p < 0.05, **p < 0.01, ***p < 0.001). C Mitochondrial membrane potential (ΔΨ) is reduced in cells lacking the protease Yta12. Mitochondria of the indicated strains were stained with MitoTracker red and ΔΨ was determined by fluorescence microscopy. Maximum and minimum levels were adjusted using Fiji (ImageJ, National Institutes of Health) [65]. The corresponding quantification is shown in Fig. S1. Scale bar, 5 μm. D Scheme depicting the localization of OXPHOS proteins encoded by mitochondrial DNA (mtDNA). E Short-lived strains have diminished steady-state levels of several mtDNA-encoded proteins. Mitochondrial TCA extracts of 972 (WT), lon1Δ, yta12Δ, mgr3Δ, and yme1Δ were analyzed by immunoblotting using antibodies against the mtDNA-encoded proteins Cox1, Cox2, Cox3, and Atp6. Sdh2-GFP was used as a loading control
Fig. 5
Fig. 5
Influence of mitochondrial dynamics on chronological aging. A Scheme depicting the different proteins involved in mitochondrial fusion and fission. Dnm1 and Fis1 proteins mediate mitochondrial fission while Fzo1 and Msp1 are dedicated to mitochondrial fusion. B Mitochondrial morphology changes during chronological aging were determined by fluorescence microscopy in 972 (WT), dnm1Δ, fis1Δ, and msp1Δ strains expressing Sdh2-GFP. Cells were grown in rich media containing 3% glucose and analyzed after logarithmic growth (Log) and day 1 of the stationary phase. White arrows indicate mitochondria arranged like beads on a string. Scale bar, 5 μm. C dnm1Δ and fis1Δ strains show enhanced longevity. 972 (WT), dnm1Δ, fis1Δ, and msp1Δ cells were grown in rich media containing 3% glucose. Serial dilutions corresponding to culture samples from the logarithmic phase (Log) and days 2 and 3 of the stationary phase were spotted onto rich media plates. D Analysis of mitochondrial morphology in mitoprotease mutants and mgr3Δ. Fluorescence microscopy images of 972 (WT), lon1Δ, yta12Δ, mgr3Δ, and yme1Δ strains expressing the mitochondrial marker Sdh2-GFP. Cells were grown in rich media containing 3% glucose and analyzed after logarithmic growth (Log) and day 1 of the stationary phase. Scale bar, 5 μm. E Classification of mitochondrial morphology phenotypes. Mitochondria from 972 (WT), dnm1Δ, fis1Δ, msp1Δ, lon1Δ, yta12Δ, mgr3Δ, and yme1Δ were manually classified into five categories: tubular, network, fragmented, polarized, and beads. Images represent an example of each category. Bar plots show the percentage of cells from each category during logarithmic growth (Log) and day 1 of the stationary phase (n > 100)
Fig. 6
Fig. 6
Impact of mitophagy inhibition on chronological lifespan. A Mitophagy is induced during the stationary phase in low glucose conditions. Mitophagy was monitored by the cleavage of Sdh2-GFP detected by immunoblotting with an anti-GFP antibody. A wild-type strain (972) was grown in rich media containing 3% glucose (3% Glu) or 1% glucose (1% Glu). Samples correspond to TCA extracts of cell cultures after logarithmic growth (day 0) and days 1, 2, and 3 of the stationary state. Sty1 levels were used as a loading control. B Deletion of Atg8 inhibits processing of Sdh2-GFP during the stationary phase. Mitophagy induction in 972 (WT) and atg8Δ strains was monitored by immunoblotting as in A. Samples correspond to TCA extracts from logarithmic growth (day 0) and days 1, 2, and 3 of the stationary state. Sty1 levels were used as a loading control. C Colocalization of the mitochondrial marker Sdh2-GFP and the vacuolar marker Cpy1-mCherry. Wild-type cells grown in rich media with 3% glucose (3% Glu) or 1% glucose (1% Glu) were visualized during logarithmic growth (Log) and day 3 of the stationary phase. Insets show a magnified region containing vacuoles labeled with GFP and Cpy1-mCherry. Scale bar, 5 μm. D atg43-1 mutant blocks mitophagy during the stationary phase at low glucose conditions. Mitophagy in 972 (WT) and atg43-1 strains was monitored by the cleavage of Sdh2-GFP detected by immunoblotting with an anti-GFP antibody. Samples correspond to TCA extracts of cell cultures grown in media with 1% glucose and collected after logarithmic growth (day 0) and days 1, 2, and 3 of the stationary state. Ponceau was used as the loading control. Bar plot represents the mean and SD of the GFP/Sdh2-GFP ratio from three independent experiments. Quantification was performed using Image Lab software. Significant differences between the atg43-1 strain and wild type were determined by a two-sided t-test (***p < 0.001). E Inhibition of mitophagy reduces cell longevity under low glucose conditions (1% Glu). Lifespan of 972 (WT), pka1Δ, sty1Δ, and atg43-1 strains was measured by propidium iodide staining and FACS. Line plot represents the local regression curves for the average survival of each strain (n > 10) at different time points. Each survival curve also displays a 95% confidence interval band. Bar plot depicts the average area under the curve of each strain, and error bars represent SD. Significant differences between deletion strains and wild type were determined by a two-sided t-test (*p < 0.05, **p < 0.01, ***p < 0.001)
Fig. 7
Fig. 7
Mitophagy is required for lifespan extension in the long-lived mutants mgr3Δ and yme1Δ. A Monitoring mitophagy induction in lon1Δ, yta12Δ, mgr3Δ, and yme1Δ strains. The experiment was performed as in Fig. 6A. Samples correspond to cells grown in rich media containing 3% or 1% glucose and day 3 of the stationary phase. Ponceau was used as the loading control. Quantification of mitophagy activation is shown in Fig. S6A. B Mitophagy contributes to the longevity extension observed in mgr3Δ and yme1Δ strains under high glucose conditions (3% Glu). Lifespan of 972 (WT), pka1Δ, mgr3Δ, yme1Δ, atg43-1, mgr3Δ atg43-1, and yme1Δ atg43-1 strains was measured by propidium iodide staining and FACS. Line plot represents the local regression curves for the average survival of each strain (n > 10) at different time points. Each survival curve also displays a 95% confidence interval band. Bar plot depicts the average area under the curve of each strain, and error bars represent SD. Significant differences between deletion strains and wild type, and mgr3Δ and yme1Δ mutants versus mgr3Δ atg43-1 and yme1Δ atg43-1, respectively, were determined by a two-sided t-test (*p < 0.05, **p < 0.01, ***p < 0.001). C Model depicting the effect of deletion of the three mitochondrial proteases and the adaptor protein Mgr3 on longevity. Short-lived mutants, lon1Δ and yta12Δ, are characterized by impaired respiration and loss of mitophagy which curtail cell survival during the stationary phase. Conversely, in long-lived mutants, mgr3Δ and yme1Δ, enhanced respiratory activity together with the elimination of damaged mitochondria by mitophagy contribute to the extension of chronological lifespan

Similar articles

Cited by

References

    1. López-Otín C, Blasco MA, Partridge L, Serrano M, Kroemer G. The hallmarks of aging. Cell. 2013;153:1194–1217. doi: 10.1016/j.cell.2013.05.039. - DOI - PMC - PubMed
    1. Fontana L, Partridge L, Longo VD. Dietary restriction, growth factors and aging: from yeast to humans. Science. 2010;328:321–6. - PMC - PubMed
    1. Kaeberlein M. Regulation of yeast replicative life span by TOR and Sch9 in response to nutrients. Science. 2005;310:1193–1196. doi: 10.1126/science.1115535. - DOI - PubMed
    1. Wei M, Kim SK, Fabrizio P, Hu J, Ge H, Cheng C, et al. Life span extension by calorie restriction depends on Rim15 and transcription factors downstream of Ras/PKA, Tor, and Sch9. Plos Genet. 2008;4:e13–e11. doi: 10.1371/journal.pgen.0040013. - DOI - PMC - PubMed
    1. Zuin A, Carmona Mercè, Morales-Ivorra I, Gabrielli N, Vivancos AP, Ayté J, et al. Lifespan extension by calorie restriction relies on the Sty1 MAP kinase stress pathway. Embo J. 2010;29:981–91. - PMC - PubMed

Publication types

MeSH terms

Substances

LinkOut - more resources