

Poor Prognosis of Oral Squamous Cell Carcinoma Correlates With ITGA6
- PMID: 35820930
- PMCID: PMC10023534
- DOI: 10.1016/j.identj.2022.05.010
Poor Prognosis of Oral Squamous Cell Carcinoma Correlates With ITGA6
Abstract
Objectives: Oral cancer is the ninth most common cancer worldwide and a leading cause of cancer-related death. Oral squamous cell carcinoma (OSCC) accounts for 90% of all oral cancers. Autophagy is a conserved essential catabolic process related to OSCC. The aim of this study was to elucidate diagnostic and prognostic autophagy-related biomarkers in OSCC.
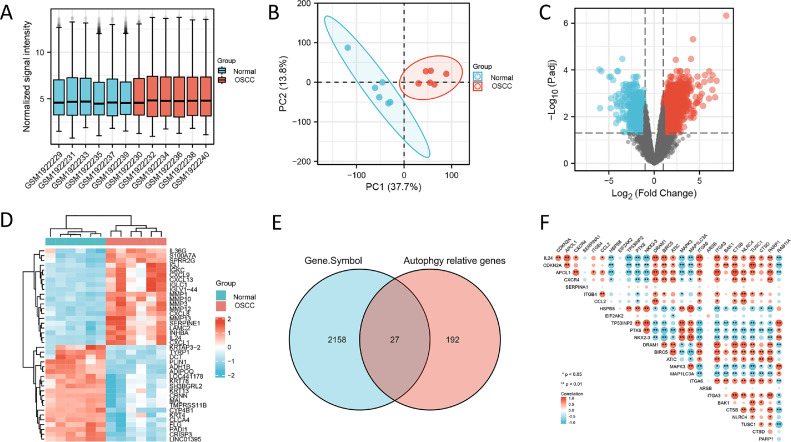
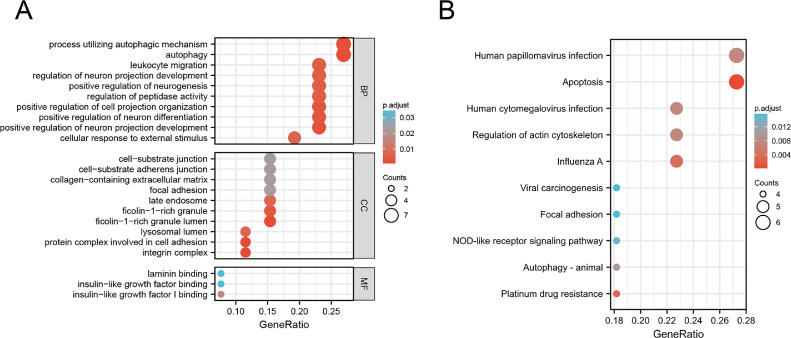
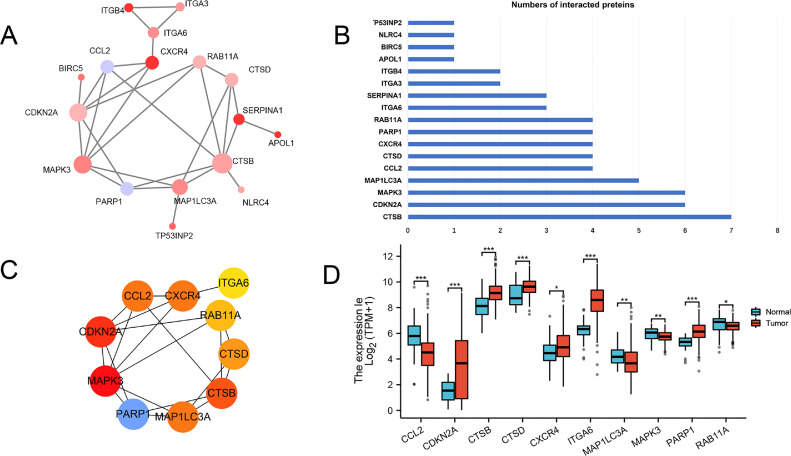
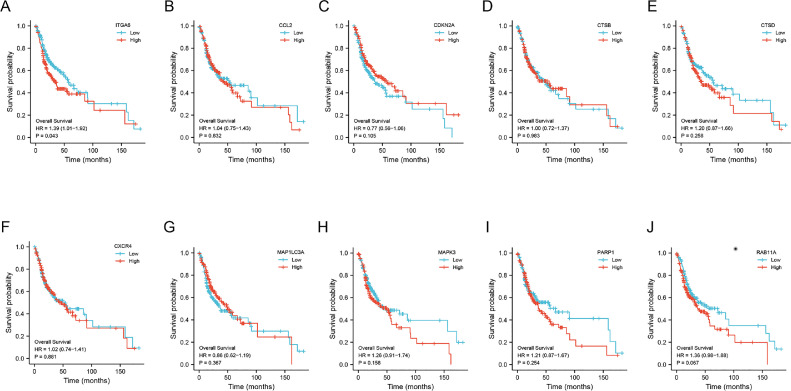
Methods: The OSCC gene expression data set was obtained from the Gene Expression Omnibus (GEO) database. Differentially expressed genes (DEGs) between the OSCC samples and adjacent healthy tissues were identified by R software. The Human Autophagy Database was screened, which revealed 222 autophagy-related genes. The autophagy-related DEGs were identified. Gene Ontology (GO) and Kyoto Encyclopedia of Genes and Genomes (KEGG) pathway analyses were applied. Protein-protein interaction network analysis was performed in the STRING database. cytoHubba in the Cytoscape software was applied to determine the top 10 hub genes. The data set of patients with OSCC from The Cancer Genome Atlas (TCGA) was used to evaluate the prognostic value of the 10 hub genes. The association between prognosis-related hub genes and immune infiltrates was explored.
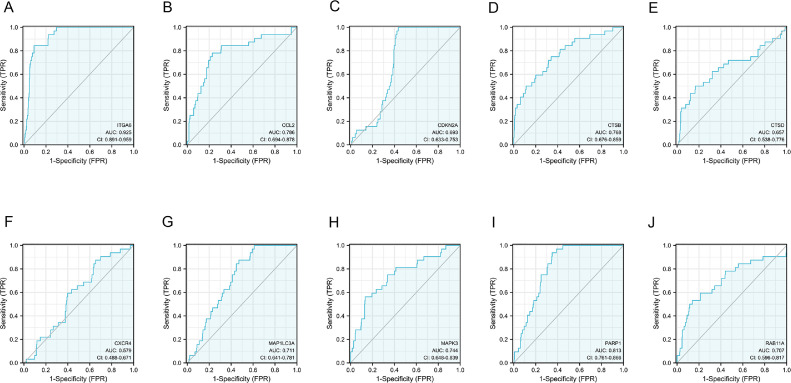
Results: Twenty-seven autophagy-related DEGs were identified. The top 10 hub genes were CCL2, CDKN2A, CTSB, CTSD, CXCR4, ITGA6, MAP1LC3A, MAPK3, PARP1, and RAB11A. ITGA6 was identified as the most efficient biomarker. Receiver operating characteristic curve analysis indicated that ITGA6 had the highest diagnostic accuracy for OSCC (area under the curve = 0.925). ITGA6 expression was significantly related to immune infiltrates.
Conclusions: The autophagy-related gene ITGA6 might be an efficient diagnostic and prognostic biomarker in OSCC.
Keywords: Autophagy; ITGA6; Oral squamous cell carcinoma.
Copyright © 2022 The Authors. Published by Elsevier Inc. All rights reserved.
Conflict of interest statement
Conflict of interest None disclosed.
Figures
Similar articles
-
Identification of a Gene Prognostic Signature for Oral Squamous Cell Carcinoma by RNA Sequencing and Bioinformatics.Biomed Res Int. 2021 Apr 1;2021:6657767. doi: 10.1155/2021/6657767. eCollection 2021. Biomed Res Int. 2021. PMID: 33869632 Free PMC article.
-
Screening and identification of autophagy-related biomarkers for oral squamous cell carcinoma (OSCC) via integrated bioinformatics analysis.J Cell Mol Med. 2021 May;25(9):4444-4454. doi: 10.1111/jcmm.16512. Epub 2021 Apr 9. J Cell Mol Med. 2021. PMID: 33837652 Free PMC article.
-
CXCL8, MMP12, and MMP13 are common biomarkers of periodontitis and oral squamous cell carcinoma.Oral Dis. 2024 Mar;30(2):390-407. doi: 10.1111/odi.14419. Epub 2022 Dec 15. Oral Dis. 2024. PMID: 36321868
-
Common gene signatures and key pathways in hypopharyngeal and esophageal squamous cell carcinoma: Evidence from bioinformatic analysis.Medicine (Baltimore). 2020 Oct 16;99(42):e22434. doi: 10.1097/MD.0000000000022434. Medicine (Baltimore). 2020. PMID: 33080677 Free PMC article.
-
Increased V-ATPase activity can lead to chemo-resistance in oral squamous cell carcinoma via autophagy induction: new insights.Med Oncol. 2024 Apr 9;41(5):108. doi: 10.1007/s12032-024-02313-9. Med Oncol. 2024. PMID: 38592406 Review.
Cited by
-
Exostoisns (EXT1/2) in Head and Neck Cancers: An In Silico Analysis and Clinical Correlates.Int Dent J. 2024 Jun;74(3):446-453. doi: 10.1016/j.identj.2023.10.017. Epub 2023 Nov 21. Int Dent J. 2024. PMID: 37989698 Free PMC article.
-
Comparative clinical significance and biological roles of PFKFB family members in oral squamous cell carcinoma.Cancer Cell Int. 2023 Nov 2;23(1):257. doi: 10.1186/s12935-023-03110-6. Cancer Cell Int. 2023. PMID: 37919747 Free PMC article.
-
PI3K/AKT Signaling Pathway Mediated Autophagy in Oral Carcinoma - A Comprehensive Review.Int J Med Sci. 2024 Apr 29;21(6):1165-1175. doi: 10.7150/ijms.94566. eCollection 2024. Int J Med Sci. 2024. PMID: 38774756 Free PMC article. Review.
-
Autophagy in oral cancer: Promises and challenges (Review).Int J Mol Med. 2024 Dec;54(6):116. doi: 10.3892/ijmm.2024.5440. Epub 2024 Oct 18. Int J Mol Med. 2024. PMID: 39422076 Free PMC article. Review.
-
Malignant Transformation of Normal Oral Tissue to Dysplasia and Early Oral Squamous Cell Carcinoma: An In Silico Transcriptomics Approach.Anal Cell Pathol (Amst). 2024 Sep 18;2024:6260651. doi: 10.1155/2024/6260651. eCollection 2024. Anal Cell Pathol (Amst). 2024. PMID: 39376501 Free PMC article.
References
-
- Siegel RL, Miller KD, Jemal A. Cancer statistics, 2019. CA Cancer J Clin. 2019;69:7–34. - PubMed
-
- Bray F, Ferlay J, Soerjomataram I, Siegel RL, Torre LA, Jemal A. Global cancer statistics 2018: GLOBOCAN estimates of incidence and mortality worldwide for 36 cancers in 185 countries. CA Cancer J Clin. 2018;68:394–424. - PubMed
-
- Neville BW, Day TA. Oral cancer and precancerous lesions. CA Cancer J Clin. 2002;52:195–215. - PubMed
MeSH terms
Substances
LinkOut - more resources
Full Text Sources
Medical
Miscellaneous
