. 2022 Jul 12;19(1):179.
doi: 10.1186/s12974-022-02497-9.

The primary macrophage chemokine, CCL2, is not necessary after a peripheral nerve injury for macrophage recruitment and activation or for conditioning lesion enhanced peripheral regeneration

Affiliations

The primary macrophage chemokine, CCL2, is not necessary after a peripheral nerve injury for macrophage recruitment and activation or for conditioning lesion enhanced peripheral regeneration

Aaron D Talsma et al. J Neuroinflammation. .

Abstract

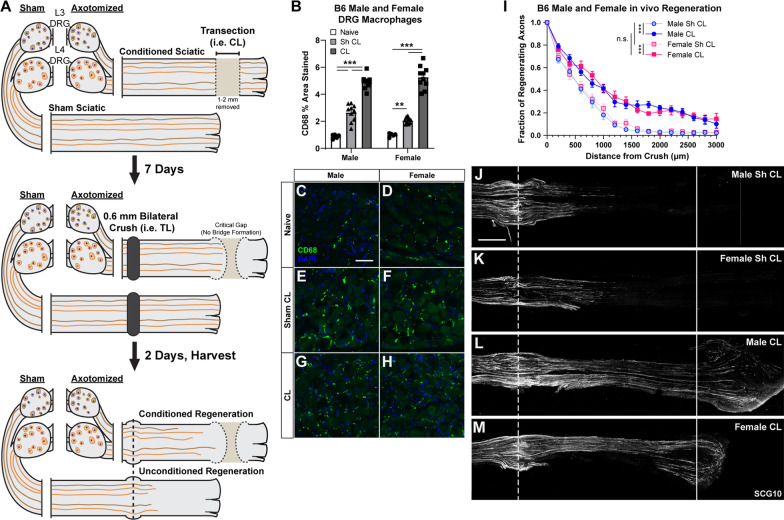
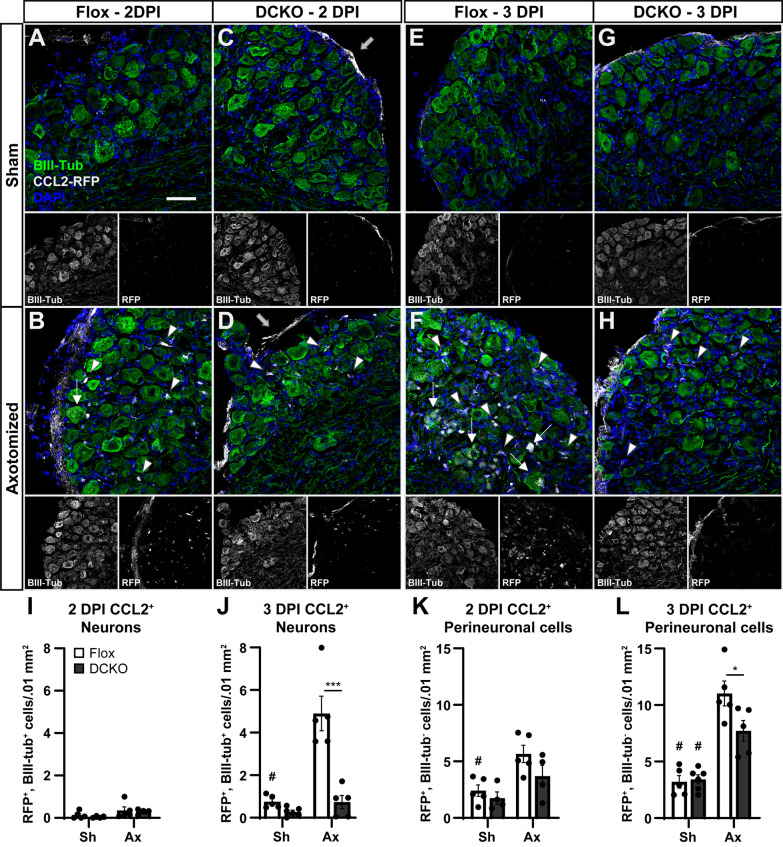
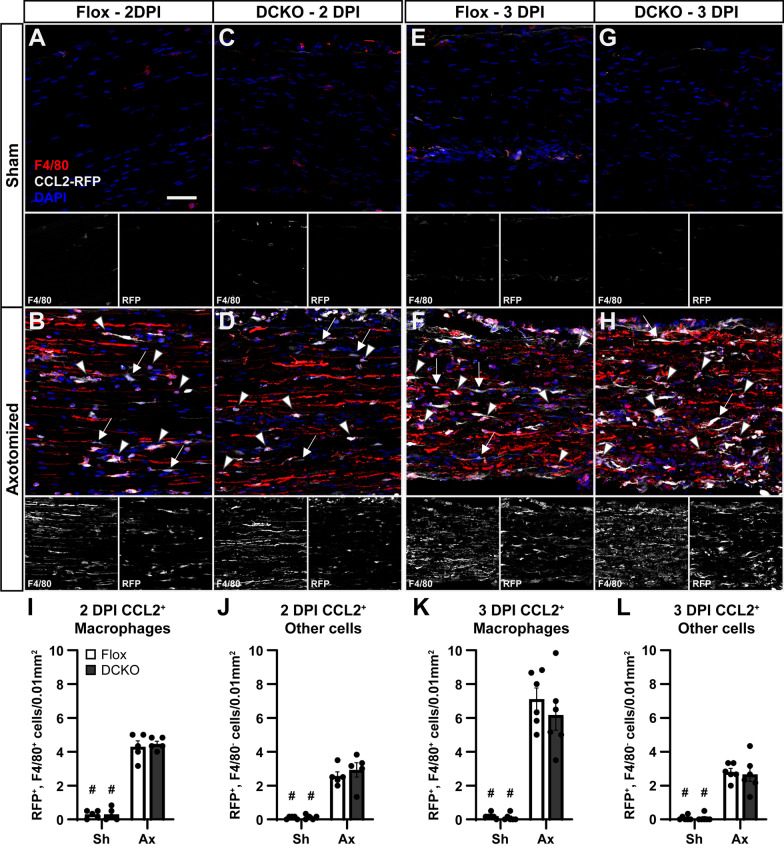
Background: Peripheral nerve injuries stimulate the regenerative capacity of injured neurons through a neuroimmune phenomenon termed the conditioning lesion (CL) response. This response depends on macrophage accumulation in affected dorsal root ganglia (DRGs) and peripheral nerves. The macrophage chemokine CCL2 is upregulated after injury and is allegedly required for stimulating macrophage recruitment and pro-regenerative signaling through its receptor, CCR2. In these tissues, CCL2 is putatively produced by neurons in the DRG and Schwann cells in the distal nerve.

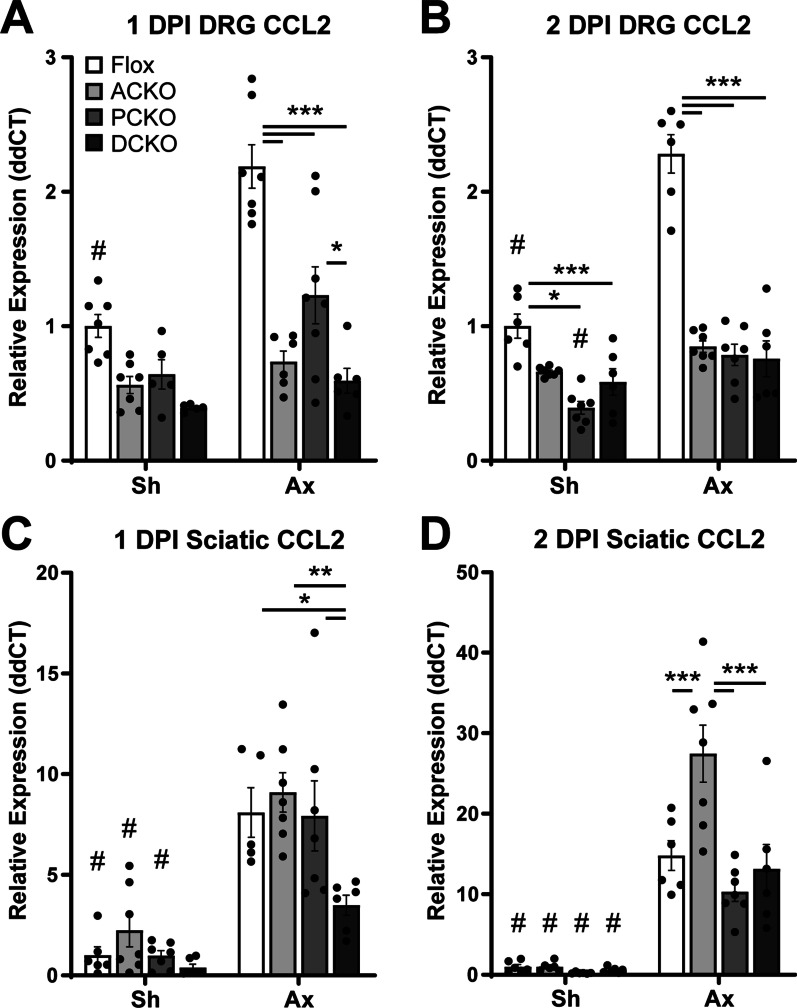
Methods: Ccl2fl/fl mice were crossed with Advillin-Cre, P0-Cre, or both to create conditional Ccl2 knockouts (CKOs) in sensory neurons, Schwann cells, or both to hypothetically remove CCL2 and macrophages from DRGs, nerves or both. CCL2 was localized using Ccl2-RFPfl/fl mice. CCL2-CCR2 signaling was further examined using global Ccl2 KOs and Ccr2gfp knock-in/knock-outs. Unilateral sciatic nerve transection was used as the injury model, and at various timepoints, chemokine expression, macrophage accumulation and function, and in vivo regeneration were examined using qPCR, immunohistochemistry, and luxol fast blue staining.

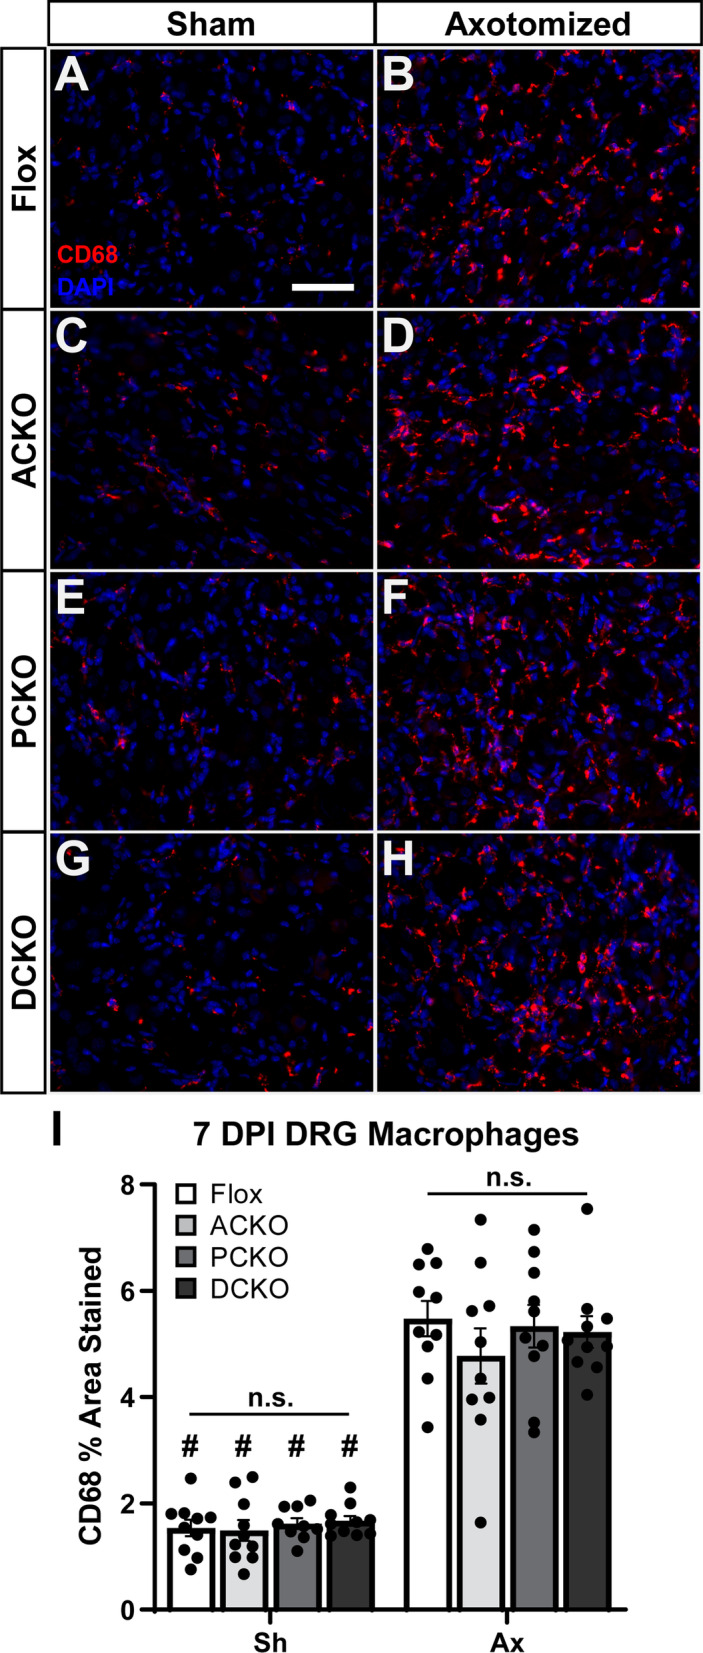
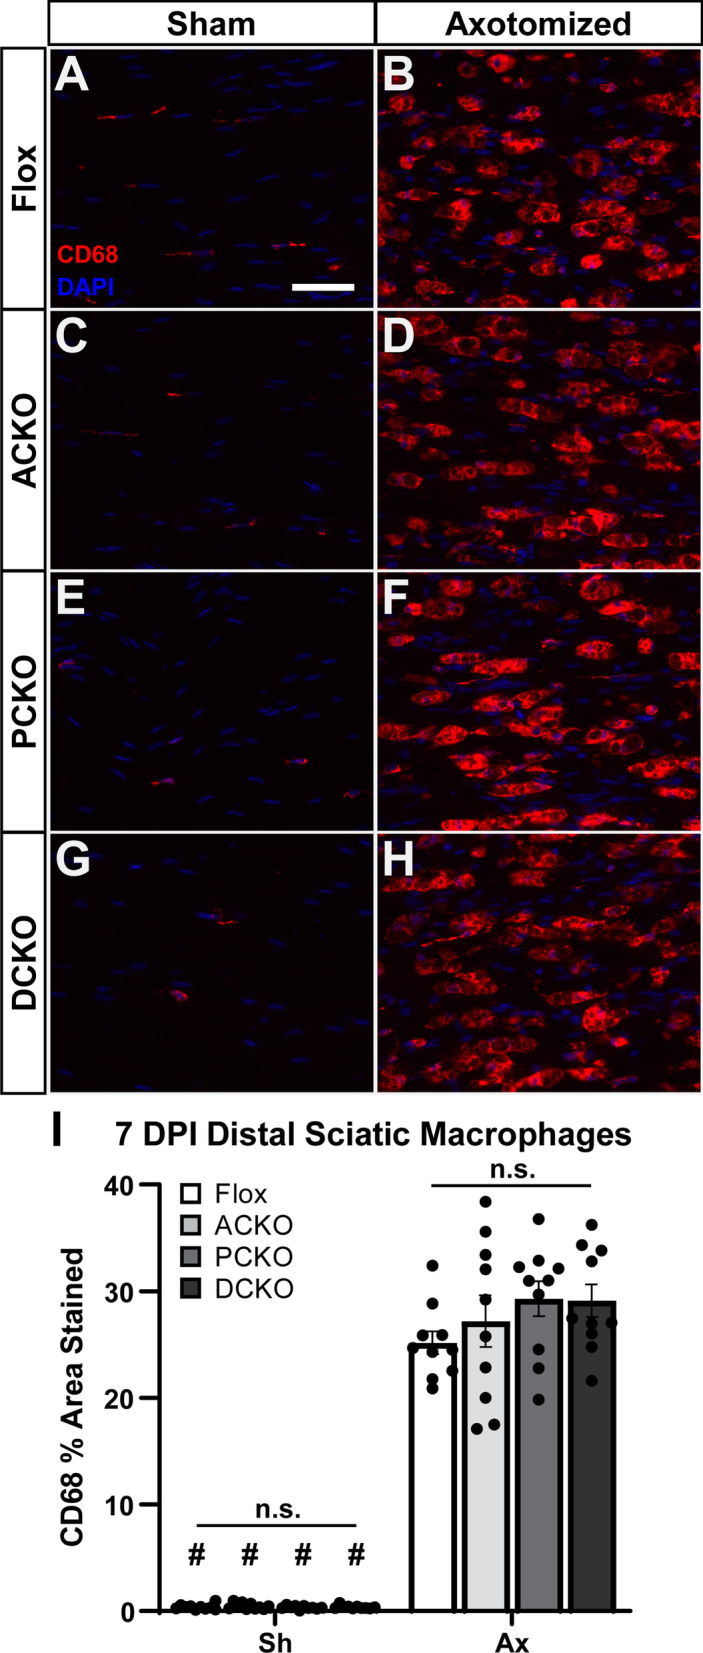
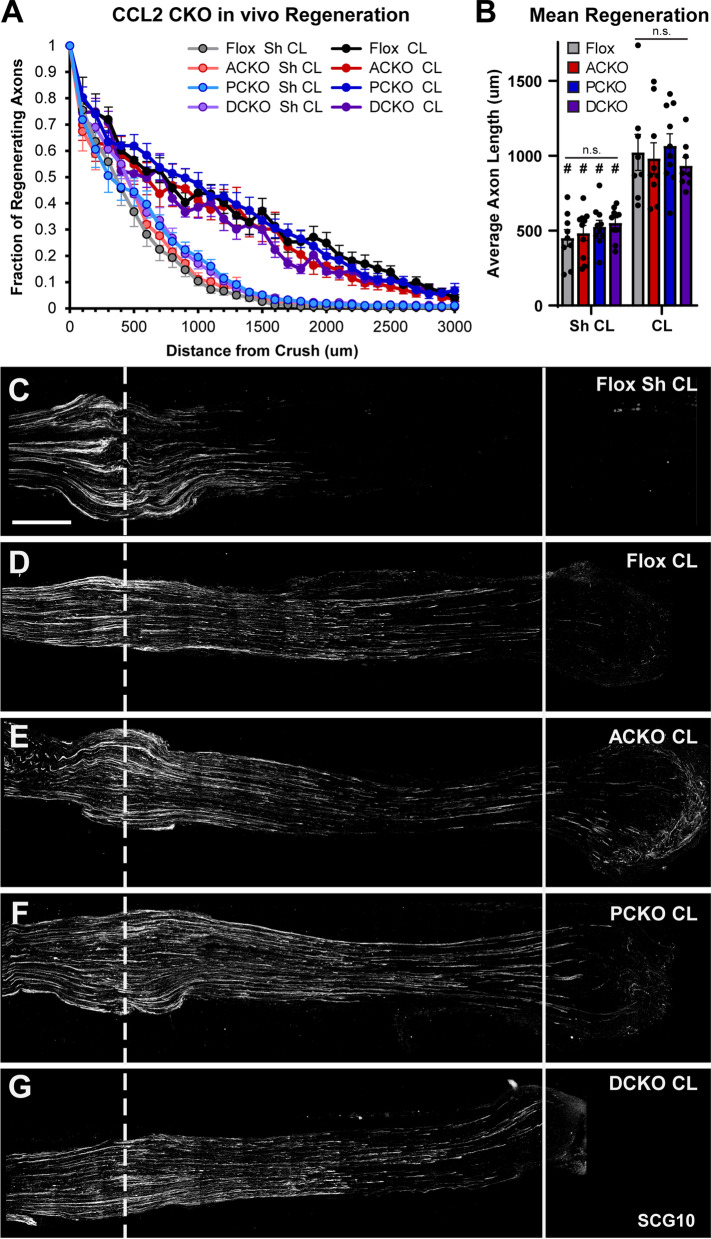
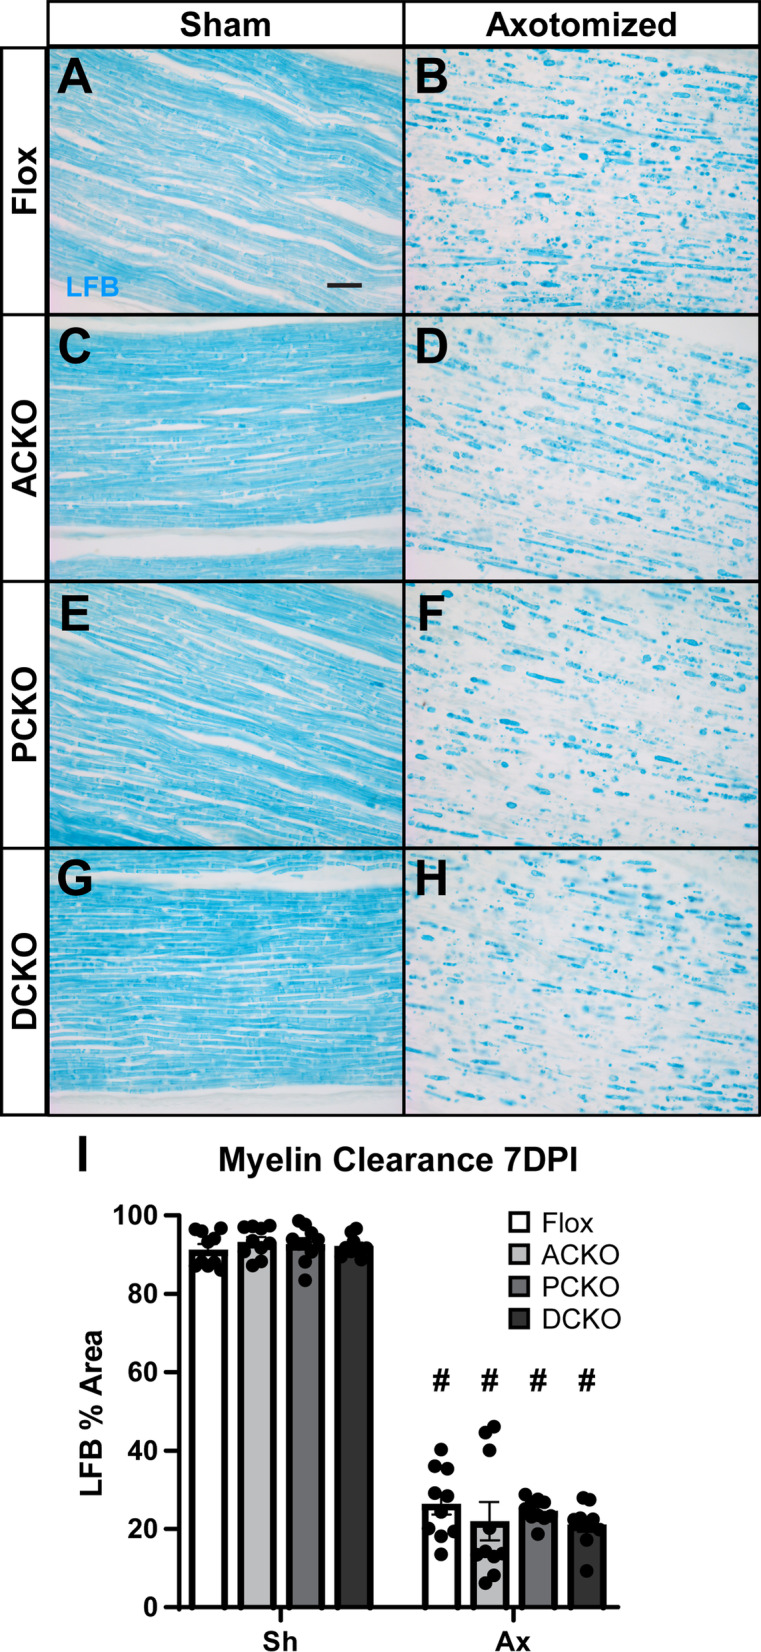
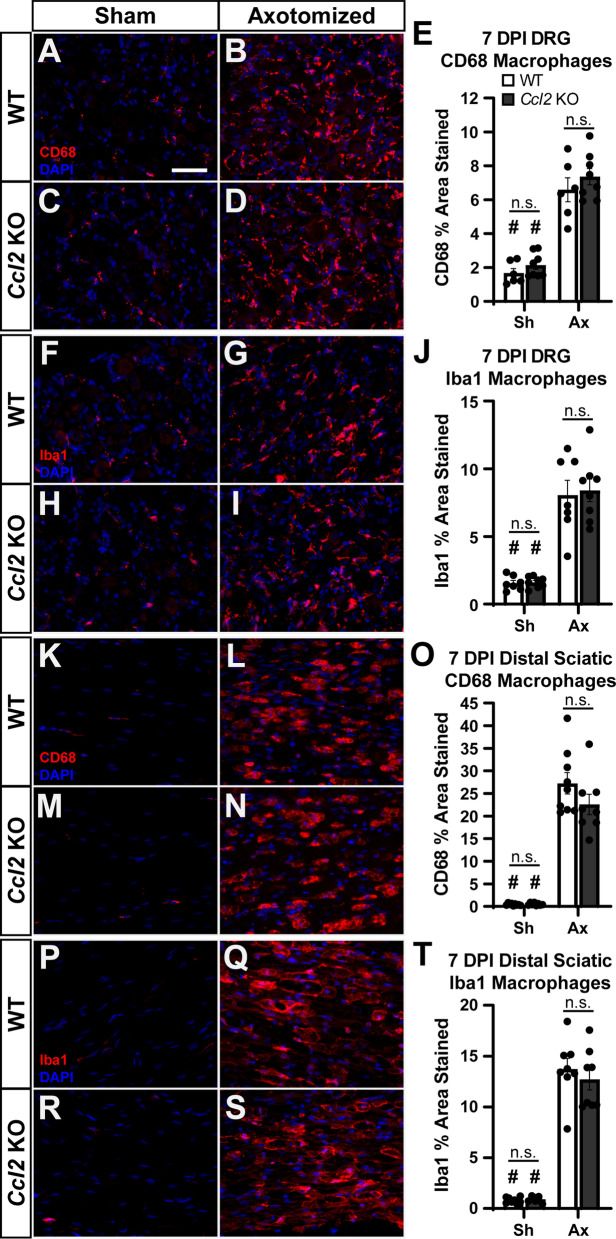
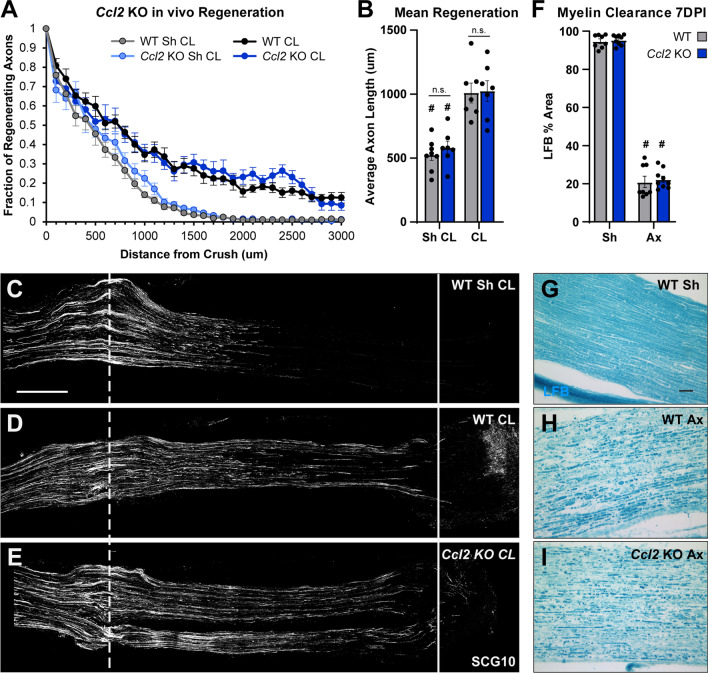
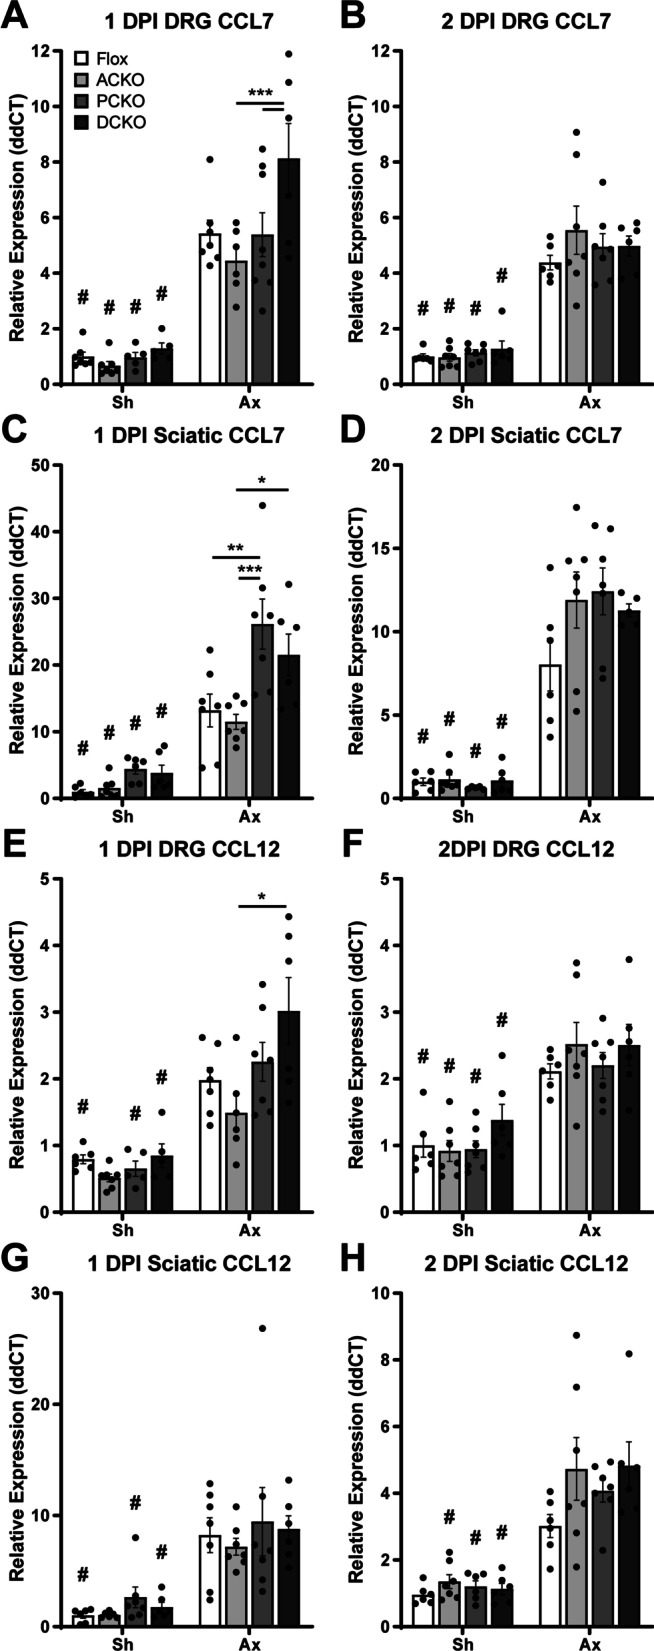
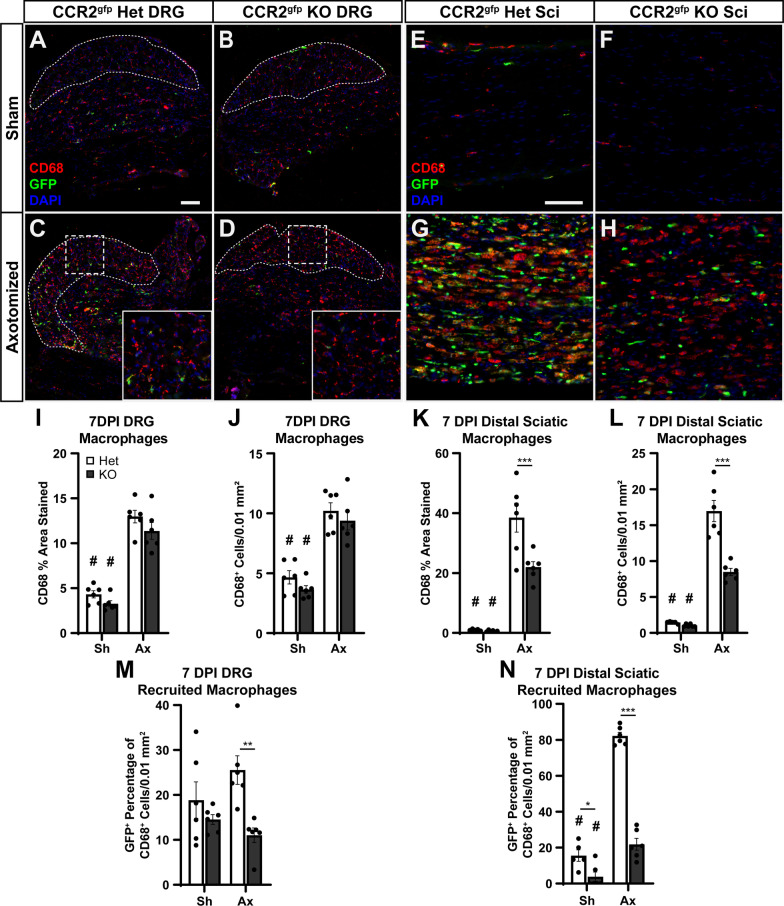
Results: Surprisingly, in all CKOs, DRG Ccl2 gene expression was decreased, while nerve Ccl2 was not. CCL2-RFP reporter mice revealed CCL2 expression in several cell types beyond the expected neurons and Schwann cells. Furthermore, macrophage accumulation, myelin clearance, and in vivo regeneration were unaffected in all CKOs, suggesting CCL2 may not be necessary for the CL response. Indeed, Ccl2 global knockout mice showed normal macrophage accumulation, myelin clearance, and in vivo regeneration, indicating these responses do not require CCL2. CCR2 ligands, Ccl7 and Ccl12, were upregulated after nerve injury and perhaps could compensate for the absence of Ccl2. Finally, Ccr2gfp knock-in/knock-out animals were used to differentiate resident and recruited macrophages in the injured tissues. Ccr2gfp/gfp KOs showed a 50% decrease in macrophages in the distal nerve compared to controls with a relative increase in resident macrophages. In the DRG there was a small but insignificant decrease in macrophages.

Conclusions: CCL2 is not necessary for macrophage accumulation, myelin clearance, and axon regeneration in the peripheral nervous system. Without CCL2, other CCR2 chemokines, resident macrophage proliferation, and CCR2-independent monocyte recruitment can compensate and allow for normal macrophage accumulation.

Keywords: Axotomy; CCL2; DRG; Macrophage; Neuroimmune; Regeneration.


Conflict of interest statement

The authors declare that they have no competing interests.

Figures

Fig. 1
Fig. 1
Male and female B6 (WT) mice have indistinguishable DRG macrophage accumulation and activation, and conditioned and unconditioned in vivo regeneration. A Diagram of our in vivo conditioning lesion (CL) and regeneration paradigm. B Macrophage quantification in Naïve, 2 day post-crush (Sh CL), and 9 day post-transection plus 2 day post-crush (CL) DRGs from male and female mice. Macrophages were quantified as the percent area stained by anti-CD68. Means were compared with a two-way ANOVA followed by Tukey’s post-hoc tests. CH Representative images of macrophages in the cell body area of L4 DRGs from the indicated sex and injury condition. Scale bar is 50 μm. I Axon regeneration expressed as the fraction of axons relative to the crush site every 200 µm. Each point is the mean fraction ± SEM. Pairs of curves were compared using non-linear regression assuming one phase decay, initial Y = 1, and the plateau = 0 and significance was determined by comparing the decay constants of the fitted curves. JM Representative images of regenerating axons stained for SCG10, a marker of regenerating sensory axons. Unconditioned growth (J, K), representing neuron intrinsic regeneration rate, and conditioned growth (L, M) were the same between sexes. Conditioned growth was increased compared to unconditioned growth in both sexes. The dotted line indicates the center of the crush site which was considered to be 500 μm wide, and the solid line is 3000 μm from the crush site. Scale bar is 500 μm. n = 10 for all groups and * indicates significance differences (**p < 0.01, ***p < 0.001) between indicated means
Fig. 2
Fig. 2
Ccl2 expression is decreased in the DRG but not the sciatic nerve in the Cre dependent conditional knockouts. A, B Ccl2 is upregulated 1 day (A) and 2 days (B) after injury in Flox control DRGs but not in any of the CKOs. C, D Ccl2 is upregulated in the distal sciatic nerves of all genotypes 1 day (C) and 2 days (D) after injury. # Indicates a significant (p < 0.05) difference between sham (Sh) and axotomized (Ax) within a genotype and * indicates a significant difference between indicated genotypes within an injury condition (*p < 0.05, **p < 0.01, ***p < 0.001)
Fig. 3
Fig. 3
DRG macrophage accumulation and activation is unaffected in the DRG-targeted ACKOs and DCKOs 7 days after injury. AH Representative images showing macrophages marked by anti-CD68 in L4 DRGs ipsilateral (B, D, F, H) and contralateral (A, C, E, G) to a sciatic nerve transection. All genotypes have an increase in macrophages after injury (A vs. B; C vs. D; E vs. F; and G vs. H) and no differences in macrophages among genotypes either before (A, C, E, G) or after (B, D, F, H) injury. Scale bar is 50 μm. I Macrophages were quantified as the percent area stained by anti-CD68 and plotted as mean ± SEM, n = 10 per group. # Indicates a significant (p < 0.05) difference between Sh and Ax within a genotype
Fig. 4
Fig. 4
Distal sciatic macrophage accumulation and activation is unaffected in the nerve-targeted PCKO and DCKO 7 days after injury. AH Representative images showing macrophages marked by CD68 immunostaining in the distal sciatic nerve ipsilateral (B, D, F, H) and contralateral (A, C, E, G) to a sciatic nerve transection. All genotypes have an increase in macrophages after injury (A vs. B; C vs. D; E vs. F; and G vs. H) and no differences in macrophages among genotypes either before (A, C, E, and G) or after (B, D, F, and H) injury. Scale bar is 50 μm. I Macrophages were quantified by CD68 area and plotted as mean ± SEM, n = 10 per group. # Indicates a significant (p < 0.05) difference between Sh and Ax within a genotype
Fig. 5
Fig. 5
Conditioned and unconditioned in vivo regeneration is unaffected in all the conditional Ccl2 knockouts. Conditioned nerves (CL) were transected 7 days prior to the test lesion crush and allowed to regenerate for 2 days. Unconditioned nerves (Sh CL) were given a sham surgery on the day of the conditioning lesion and were then crushed 7 days later and allowed to regenerate for 2 days. A Axon regeneration expressed as the fraction of axons relative to the crush site every 100 μm. Each point is the mean fraction ± SEM. B Mean regeneration determined by integrating regenerating axon fluorescence to find the average axon length for each nerve. # Indicates a significant (p < 0.05) difference between the Sh CL (unconditioned) and CL (conditioned) regeneration within a genotype. There were no significant differences between genotypes within an injury condition. For A and B, the analysis ends at 3000 μm from the crush because that is the length of the shortest nerve segment. For A and B, the n are: Flox Sh = 9, Flox CL = 8, ACKO Sh = 10, ACKO CL = 9, PCKO Sh = 10, PCKO CL = 10, DCKO Sh = 10, DCKO CL = 8. One CL nerve was excluded from analysis of each of the Flox CL, ACKO CL, and DCKO CL groups for violating assumption 5 (see “Materials and methods”). CG Representative images of regenerating nerves stained with SCG10. Unconditioned growth (C), representing neuron intrinsic regeneration rate, was the same amongst all genotypes. Conditioned growth (DG) was also the same across genotypes and increased compared to unconditioned controls (compare to C). The dotted line indicates the center of the crush site which was considered to be 500 μm wide, and the solid line is 3000 μm from the crush. Scale bar is 500 μm
Fig. 6
Fig. 6
Myelin clearance in the distal sciatic nerve is unaffected in all the conditional Ccl2 knockouts 7 days after injury. AH Representative images of myelin stained with Luxol Fast Blue (LFB) in uninjured (A, C, E, G) and injured (B, D, F, H) sciatic nerves. In all genotypes, myelin has almost completely degenerated and been cleared by 7 DPI. Scale bar is 50 µm. I Myelin clearance was quantified by LFB area and plotted as mean ± SEM. # Indicates a significant (p < 0.05) difference between Sh and Ax within a genotype. n = 10 for all genotypes except DCKO n = 9
Fig. 7
Fig. 7
CCL2 is expressed in both neurons and perineuronal cells in the DRG after injury. AH Representative images of uninjured (A, C, E, G) and injured (B, D, F, H) DRGs stained for the co-translated RFP to localize CCL2 expression at 2 (B, D) and 3 (F, H) DPI. Very little CCL2 is present at baseline (A, C, E, G). CCL2 is rapidly upregulated in various perineuronal cells (arrowheads) in both the Flox control (B, F) and DCKO (D, H). Expression in neurons lags behind perineuronal expression in Flox controls (arrows, B, F), and little to no neuronal expression is seen in DCKOs (D, H). Large gray arrows indicate the likely meningeal expression. Scale bar is 50 μm. IL Quantification of cells making CCL2 at 2 (I, K) and 3 (J, L) DPI in the cell body area of the DRGs. There is an apparent delayed onset of CCL2 expression in neurons (Flox Ax, I vs. J) when compared to perineuronal cells (K, L). The DCKOs show a strong CCL2 KO in neurons (I, J) and a trend toward fewer CCL2 expressing perineuronal cells (K, L). Individual images for the BIII-Tubulin and RFP channels are also displayed below each merged image (AH). Data are the mean ± SEM, n = 5 for all groups except DCKO 2 DPI, where n = 4. One pair of 3 DPI Flox and one pair of 3 DPI DCKOs stained too badly to quantify and were excluded, and one 2 DPI DCKO Ax DRG was lost in sectioning. # Indicates a significant (p < 0.05) difference between Sh and Ax within a genotype and * indicates a significant difference between indicated genotypes within an injury condition (*p < 0.05, *** p < 0.001)
Fig. 8
Fig. 8
CCL2 is expressed primarily in macrophages in the distal sciatic nerve after injury. AH Representative images of uninjured (A, C, E, G) and injured (B, D, F, H) distal nerves stained for the co-translated RFP to localize CCL2 expression at 2 (B, D) and 3 (F, H) DPI. Very little CCL2 is present at baseline (A, C, E, G). Many F4/80+ cells express CCL2 at both 2 (B, D; arrowheads) and 3 (F, H; arrowheads) DPI. Other cells that are likely Schwann cells and other stromal cells (arrows; B, D, F, H) also express CCL2 after injury. IL Quantification of cells making CCL2 at 2 (I, J) and 3 (K, L) DPI. The majority of CCL2+ cells are F4/80+ macrophages at both 2 (I vs. J) and 3 (K vs. L) DPI, and CCL2+ macrophages increase over the course of the injury response (I vs. K). The lack of a decrease in non-macrophage CCL2+ cells in the DCKOs compared to controls (J, L) suggests Schwann cells make little contribution to CCL2 expression. Individual images for the F4/80 and RFP channels are also displayed below each merged image (AH). Data are the mean ± SEM, n = 5 for the 2 DPI groups and n = 6 for the 3 DPI groups. # Indicates a significant (p < 0.05) difference between Sh and Ax within a genotype
Fig. 9
Fig. 9
CCL2 is not required for macrophage recruitment either to the DRG or distal sciatic nerve 7 DPI. AD Representative images showing macrophages marked by CD68 immunostaining in L4 DRGs ipsilateral (B, D) and contralateral (A, C) to a sciatic nerve transection. Ccl2 KOs show an increase in macrophages after injury comparable to WT controls (B vs. D). E Macrophages were quantified by CD68 area and plotted as mean ± SEM. There are no differences between genotypes before or after injury. WT n = 6, Ccl2 KO n = 8. FI Representative images showing macrophages marked by Iba1 immunostaining in L4 DRGs ipsilateral (G, I) and contralateral (F, H) to a sciatic nerve transection. Again, Ccl2 KOs show an increase in macrophages after injury comparable to WT controls (G vs. I). J Macrophages were quantified by Iba1 area and plotted as mean ± SEM. There are no differences between genotypes before or after injury. WT n = 7, Ccl2 KO n = 8. KN Representative images showing macrophages marked by CD68 immunostaining in distal sciatic nerves ipsilateral (L, N) and contralateral (K, M) to a sciatic nerve transection. Ccl2 KOs show an increase in macrophages after injury comparable to WT controls (L vs. N). O Macrophages were quantified by CD68 area and plotted as mean ± SEM. There are no differences between genotypes before or after injury. WT n = 9, Ccl2 KO n = 8. PS Representative images showing macrophages marked by Iba1 immunostaining in distal sciatic nerves ipsilateral (Q, S) and contralateral (P, R) to a sciatic nerve transection. Again, Ccl2 KOs show an increase in macrophages after injury comparable to WT controls (Q vs. S). T Macrophages were quantified by Iba1 area and plotted as mean ± SEM. There are no differences between genotypes before or after injury. WT n = 8, Ccl2 KO n = 8. # Indicates a significant (p < 0.05) difference between Sh and Ax within a genotype. Scale bar is 50 μm
Fig. 10
Fig. 10
Degeneration and regeneration are functionally normal in the absence of CCL2. Conditioning and in vivo regeneration were done as in Fig. 4. A Axon regeneration expressed as the fraction of axons relative to the crush site every 100 μm. Each point is the mean fraction ± SEM. B Mean regeneration determined by integrating regenerating axon fluorescence to find the average axon length for each nerve. Average axon lengths are plotted as mean ± SEM. For A and B, the analysis ends at 3000 μm from the crush, because that is the length of the shortest nerve segment. n = 7 nerves per injury condition per genotype, except WT Sh CL n = 8. One WT CL nerve was excluded from analysis for violating assumption 5 (see “Materials and methods”). CE Representative images of regenerating nerves stained for SCG10. Unconditioned growth (C), representing neuron intrinsic regeneration rate, was the same in both genotypes. Conditioned growth (D, E) was also the same in Ccl2 KOs as in WT and increased compared to unconditioned controls (compare to C). The dotted line indicates the center of the crush site which was considered to be 500 μm wide, and the solid line is 3000 μm from the crush. Scale bar is 500 μm. F Myelin clearance, quantified by LFB area and plotted as mean ± SEM. WT n = 8, Ccl2 KO n = 9. GI Representative images of myelin stained with LFB in uninjured (G) and injured (H, I) sciatic nerves. In both genotypes, myelin has almost completely degenerated and been cleared by 7 DPI. # Indicates a significant (p < 0.05) difference between the Sh CL (unconditioned) and CL (conditioned) regeneration within a genotype
Fig. 11
Fig. 11
Other CCR2 chemokines are upregulated in response to injury in both the DRG and sciatic nerve. AD Ccl7 mRNA is upregulated within 1 day after injury in both the DRG (A, B) and distal sciatic nerve (C, D). EH Ccl12 mRNA is also upregulated within 1 day after injury in both the DRG (E, F) and distal sciatic nerve (G, H). # Indicates a significant (p < 0.05) difference between Sh and Axwithin a genotype and * indicates a significant difference between indicated genotypes within an injury condition (*p < 0.05, **p < 0.01, ***p < 0.001)
Fig. 12
Fig. 12
Resident macrophages and alternative signaling mechanisms compensate for the loss of CCR2. AD Representative images of CCR2gfp het and CCR2gfp KO DRGs contralateral (A, B) and ipsilateral (C, D) to a sciatic nerve transection. All macrophages are marked by CD68 immunostaining and monocyte derived macrophages are marked by GFP immunostaining. Injured DRGs in both genotypes show an increase in CD68 macrophages compared to the contralateral control (C, D vs. A, B). The CCR2gfp het DRGs have more GFP+ cells and show a small increase after injury (C). Dotted tracings indicate the cell body area and are representative of the area quantified. Dotted squares indicate the location of the insets and are 200 by 200 µm. Scale bar is 100 µm. EH Representative images of CCR2gfp het and CCR2gfp KO DNs contralateral (E, F) and ipsilateral (G, H) to a sciatic nerve transection. All macrophages are marked by CD68 immunostaining and recruited macrophages are marked by GFP immunostaining. Injured DNs in both genotypes show an increase in CD68 macrophages compared to their contralateral control (G, H vs. E, F) but macrophages are significantly reduced in CCR2gfp KO DNs (G vs. H). The CCR2gfp het DNs have more GFP+ cells and show a substantial increase after injury (G), while the CCR2gfp KO DNs have a relative increase in resident CD68 only macrophages as well as a smaller increase in the double positive recruited macrophages (H). Scale bar is 100 µm. IL Quantification of CD68 macrophages in the DRG cell body area (I, J) or the DN (K, L) by the percent area positively stained (I, K) and by cell counts (J, L). M, N Quantification of the percentage of recruited macrophages in the DRG cell body area (M) and in the DN (N). Percentages were calculated as the number of double positive cells over the CD68 positive cells. # Indicates a significant (p < 0.05) difference between Sh and Ax within a genotype and * indicates a significant difference between indicated genotypes within an injury condition (*p < 0.05, **p < 0.01, ***p < 0.001). All data are the mean ± SEM and n = 6 per injury condition per genotype

Similar articles

Cited by

References

    1. McQuarrie IG, Grafstein B. Axon outgrowth enhanced by a previous nerve injury. Arch Neurol. 1973;29:53–55. doi: 10.1001/archneur.1973.00490250071008. - DOI - PubMed
    1. Zigmond RE, Echevarria FD. Macrophage biology in the peripheral nervous system after injury. Prog Neurobiol. 2019;173:102–121. doi: 10.1016/j.pneurobio.2018.12.001. - DOI - PMC - PubMed
    1. Ramon y Cajal S. Degeneration and regeneration of the nervous system. New York: Oxford University Press; 1928.
    1. Shapouri-Moghaddam A, Mohammadian S, Vazini H, Taghadosi M, Esmaeili SA, Mardani F, Seifi B, Mohammadi A, Afshari JT, Sahebkar A. Macrophage plasticity, polarization, and function in health and disease. J Cell Physiol. 2018;233:6425–6440. doi: 10.1002/jcp.26429. - DOI - PubMed
    1. Locati M, Curtale G, Mantovani A. Diversity, mechanisms, and significance of macrophage plasticity. Annu Rev Pathol. 2020;15:123–147. doi: 10.1146/annurev-pathmechdis-012418-012718. - DOI - PMC - PubMed