. 2022 Jul 12;13(1):4028.
doi: 10.1038/s41467-022-31431-z.

Malaria parasite heme biosynthesis promotes and griseofulvin protects against cerebral malaria in mice

Affiliations

Malaria parasite heme biosynthesis promotes and griseofulvin protects against cerebral malaria in mice

Manjunatha Chandana et al. Nat Commun. .

Erratum in

Abstract

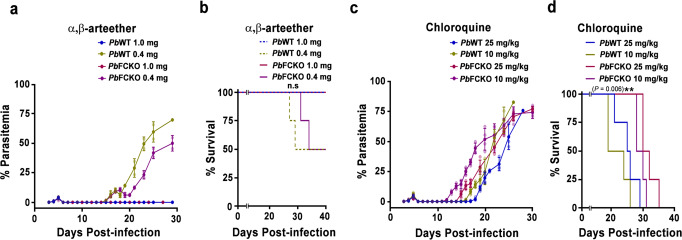
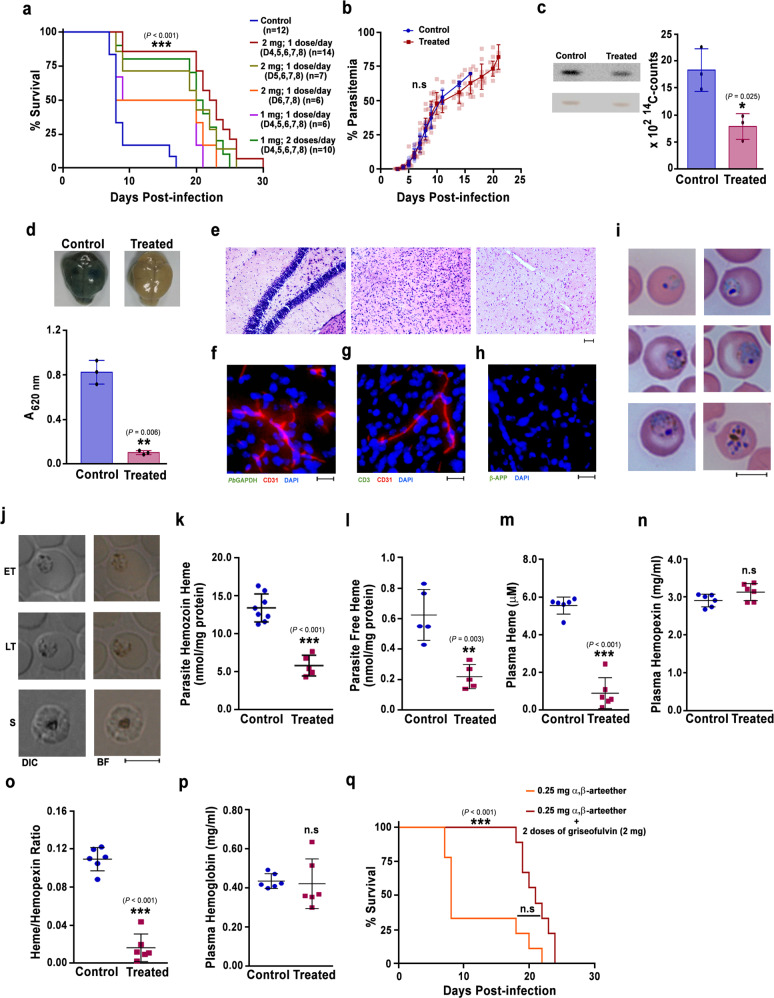
Heme-biosynthetic pathway of malaria parasite is dispensable for asexual stages, but essential for mosquito and liver stages. Despite having backup mechanisms to acquire hemoglobin-heme, pathway intermediates and/or enzymes from the host, asexual parasites express heme pathway enzymes and synthesize heme. Here we show heme synthesized in asexual stages promotes cerebral pathogenesis by enhancing hemozoin formation. Hemozoin is a parasite molecule associated with inflammation, aberrant host-immune responses, disease severity and cerebral pathogenesis. The heme pathway knockout parasites synthesize less hemozoin, and mice infected with knockout parasites are protected from cerebral malaria and death due to anemia is delayed. Biosynthetic heme regulates food vacuole integrity and the food vacuoles from knockout parasites are compromised in pH, lipid unsaturation and proteins, essential for hemozoin formation. Targeting parasite heme synthesis by griseofulvin-a FDA-approved antifungal drug, prevents cerebral malaria in mice and provides an adjunct therapeutic option for cerebral and severe malaria.


Conflict of interest statement

The authors declare no competing interests.

Figures

Fig. 1
Fig. 1. CM protection in heme pathway KO parasite-infected mice.
a Growth analysis of PbWT (n = 10), PbALASKO (n = 12) and PbFCKO (n = 12) parasites in C57BL/6 mice. 105 parasites were used to initiate PbWT and PbKO parasite infections. The data represent three different batches. (mean ± SD; ***P < 0.001, Two-way ANOVA). b Mortality curves of mice infected with PbWT, PbALASKO and PbFCKO parasites. The data represent the mice utilized for growth curve analysis (***P < 0.001, log-rank (Mantel–Cox) test). c Spleen weight of mice infected with PbWT (n = 13), PbALASKO (n = 14) and PbFCKO (n = 14) parasites. For each day, 3–5 mice from at least three different batches were included (mean ± SD; *P < 0.05, **P < 0.01, ***P < 0.001, Two-way ANOVA). Scale bar = 1 cm. d Growth analysis of PbWT (n = 14), PbALASKO (n = 14) and PbFCKO (n = 14) parasites in C57BL/6 mice. 105 and 107 parasites were used to initiate WT and KO parasite infections, respectively. The data represent four different batches (mean ± SD; n.s. not significant, Two-way ANOVA). e Mortality curves of mice infected with PbWT, PbALASKO and PbFCKO parasites. The data represent the mice utilized for growth curve analysis (***P < 0.001, log-rank (Mantel–Cox) test). f Percentage of infected reticulocytes in the parasitized red cells (mean ± SD; *P < 0.05, ***P < 0.001, Two-way ANOVA). The data represent six mice each for PbWT, PbALASKO and PbFCKO parasites. g Giemsa-stained images for peripheral blood smears prepared from tail vein blood of PbWT and PbKO parasite-infected mice. Reticulocytes could be identified by their distinct blue color. Images were captured using 100x objective. Scale bar = 5 μm. n = 4–6 independent experiments. h RMCBS score for mice infected with PbWT (n = 8) and PbKO (n = 12) parasites. PbWT data represent the mice that succumbed to ECM (mean ± SD; ***P < 0.001, unpaired t-test; two-sided). For (a, c, d, f), individual data points are shown with the respective light shaded colors. Source data are provided as a Source Data file.
Fig. 2
Fig. 2. Generation of Luc-expressing heme pathway KO parasites, in vivo bioluminescence imaging of infected mice and genetic complementation.
a Double-crossover recombination strategy to generate Luc-expressing PbALASKO (PbALASKOLuc) and PbFCKO (PbFCKOLuc) parasites. Black arrows represent the position of primers used for the confirmation of site-specific integration in PbKOLuc parasites (data provided in Supplementary Fig. 1). b Genomic DNA PCR confirmation for ALAS and FC deletions in PbALASKOLuc and PbFCKOLuc parasites, respectively. Lane M: 1 kb ladder; Lane 1, 3 and 5: ALAS product (2.11 kb); Lane 2, 4 and 6: FC product (1.54 kb). n = 3 independent experiments. c RT-PCR confirmation for ALAS and FC deletions. Lane M: 1 kb ladder; Lane 1, 3 and 5: ALAS product (1.92 kb); Lane 2, 4 and 6: FC product (1.05 kb). n = 3 independent experiments. d Live GFP and m-cherry fluorescence of PbControlLuc and PbKOLuc parasites. Images were captured using 100x objective. Scale bar = 5 μm. n = 4 independent experiments. e Whole body bioluminescence imaging of PbControlLuc and PbKOLuc parasite-infected mice on day 8 post-infection. n = 3 independent experiments. f Ex vivo bioluminescence imaging of liver (Li), lungs (Lu), brain (B), heart (H) and spleen (S) of PbControlLuc- and PbKOLuc-infected mice. Enlarged images of brain are shown. g Mortality curves of mice infected with PbControlLuc (n = 5), PbALASKOLuc (n = 4) and PbFCKOLuc (n = 5) parasites (***P < 0.001, log-rank (Mantel–Cox) test). h Growth analysis of PbWT (n = 6), PbFCKO+FC (n = 6) and PbFCKOLuc (n = 5) parasites in C57BL/6 female mice. The data represent two different batches (mean ± SD; n.s not significant, Two-way ANOVA). Individual data points are shown with the respective light shaded colors. i Mortality curves of mice infected with PbWT (n = 6), PbFCKO+FC (n = 6) and PbFCKOLuc (n = 5) parasites (n.s not significant, ***P < 0.001, log-rank (Mantel–Cox) test). j RMCBS score for mice infected with PbWT (n = 6), PbFCKO+FC (n = 6) and PbFCKOLuc (n = 5) parasites on day 7/8 post-infection. PbWT and PbFCKO+FC data represent the mice succumbed to ECM (mean ± SD; n.s - not significant, ***P < 0.001, unpaired t-test; two-sided). Source data are provided as a Source Data file.
Fig. 3
Fig. 3. Assessment of cerebral pathology in heme pathway KO parasite-infected mice.
a Evans blue extravasation in the brain of mice infected with PbWT and heme pathway PbKO parasites. b Quantification of Evans blue in the brain samples of mice infected with PbWT (n = 6) and heme pathway PbKO (n = 9) parasites. (mean ± SD; ***P < 0.001, unpaired t-test; two-sided). c H&E staining of the brain sections prepared from PbWT and PbKO parasite-infected mice. Black arrows—intracerebral and petechial hemorrhages, blue arrows—thrombosed blood vessels and brown arrows—gross demyelination. Images were captured using 10x objective. Scale bar = 50 μm. n = 3–5 independent experiments. d IgG extravasation in the brain sections of PbWT and PbKO parasite-infected mice. Black arrows—areas showing IgG immunoreactivity. Images were captured using 10x objective. Scale bar = 50 μm. n = 3 independent experiments. e H&E staining of the brain sections indicating (black arrows) occluded vasculatures containing luminal and abluminal leukocytes, and parasite-derived Hz. Images were captured using 60x objective. Scale bar = 10 μm. n = 3 independent experiments. f Immunofluorescence analysis of parasite accumulation in the brain sections of PbWT and PbKO parasite-infected mice. n = 3 independent experiments. g Immunofluorescence analysis of CD3+ cells in the blood vessels of PbWT and PbKO parasite-infected mice. n = 2 independent experiments. h Immunofluorescence analysis of β-APP staining in the brain sections of PbWT and PbKO parasite-infected mice. n = 2 independent experiments. fh Images were captured using 20x objective. Scale bar = 20 μm. Source data are provided as a Source Data file.
Fig. 4
Fig. 4. Assessment of inflammatory parameters in heme pathway KO parasite-infected mice.
a Plasma cytokine and chemokine levels of PbWT- and PbKO-infected mice (n = 5) (mean ± SD; *P < 0.05, **P < 0.01, ***P < 0.001, unpaired t-test; two-sided). b qPCR analyses of host transcripts in the brain samples of infected mice. Expression levels were normalized with mouse GAPDH. Relative expression fold changes of mRNA transcripts in the KO-infected mice with respect to WT-infected mice (mean ± SD) are shown (n = 3). c Flow cytometry analyses of T cells in the brain samples of infected mice. Mice on day 7/8 post-infection were used and the data for each cell type were obtained from at least three different mice infected with PbWT or PbKO parasites (mean ± SD; ***P < 0.001, Two-way ANOVA). Individual data points are shown as black circles. Gating strategy and representative flow cytometry plots are shown in the Supplementary Fig. 2. d Western analyses of brain homogenates prepared from PbWT- and PbKO-infected mice. 200 μg of total protein was used from the pooled brain homogenates of three different mice for PbWT, PbALASKO and PbFCKO. n = 2 independent experiments. Full-length blots are provided in the Supplementary Fig. 7. Source data are provided as a Source Data file.
Fig. 5
Fig. 5. Hz and heme levels in heme pathway KO parasites.
a, b Bright field images of Giemsa-stained PbWT, PbALASKO and PbFCKO asexual stage parasites and gametocytes, respectively, showing Hz content. Images were captured using 100x objective. n = 3–5 independent experiments. Scale bar = 5 μm. c Hz content in differential interference contrast (DIC; left) and bright field images (right) of paraformaldehyde-fixed pRBCs containing PbWT and PbKO parasites. Images were captured using 100x objective. Scale bar = 5 μm. n = 3 independent experiments. d Hz levels in PbWT (n = 12) and PbKO (n = 10) parasites. e Free heme levels in PbWT (n = 11) and PbKO (n = 10) parasites. f Free heme levels in the plasma samples of PbWT (n = 12) and PbKO (n = 11) parasite-infected mice. g Heme/Hemopexin ratio in the plasma samples of PbWT (n = 12) and PbKO (n = 10) parasite-infected mice. h Plasma hemopexin levels of PbWT (n = 13) and PbKO (n = 11) parasite-infected mice. i Plasma hemoglobin levels of PbWT (n = 13) and PbKO (n = 11) parasite-infected mice. j, k Hz load in the spleen and liver of PbWT (n = 14) and PbKO (n = 9 for ALASKO; n = 13 for FCKO) parasite-infected mice, respectively. dk The data represent mean ± SD (n.s not significant, **P < 0.01, ***P < 0.001, unpaired t-test; two-sided). Source data are provided as a Source Data file.
Fig. 6
Fig. 6. Sensitivity of WT and FCKO parasites to α, β-arteether and chloroquine.
a, b Blood parasitemia and mortality curves of infected mice treated with α,β-arteether, respectively. The data represent four mice for each group (n.s not significant, log-rank (Mantel–Cox) test). c, d Blood parasitemia and mortality curves of infected mice treated with chloroquine, respectively. The data represent four mice for each group (**P < 0.01, log-rank (Mantel–Cox) test). For (a, c), the data represent mean ± SD. Individual data points are shown with the respective light shaded colors. Source data are provided as a Source Data file.
Fig. 7
Fig. 7. Assessment of food vacuole pH, phospholipids and neutral lipids in FCKO parasites.
a Live cell fluorescence imaging of LysoTracker Deep Red uptake in PbWT and PbFCKO parasites. b Quantification of fluorescence signal from various stages. PbWT − 98 trophozoites and 22 schizonts; PbFCKO − 95 trophozoites and 23 schizonts. ET, MT and LT early, mid and late trophozoites; S schizonts. Images were captured using 100x objective. Scale bar = 5 μm. (***P < 0.001, unpaired t-test; two-sided). c TLC separation of 32P-orthophosphoric acid radiolabelled phospholipids for PbWT and PbFCKO total parasites and FVs. Half the phospholipid preparation was used for total parasites. For FVs, entire preparation was used. PC phosphatidylcholine, PI phosphatidylinositol, PE phosphatidylethanolamine. d Band intensities quantified (mean ± SD; n.s not significant, unpaired t-test; two-sided). The data represent four different experiments. Individual data points are shown as black circles. e Live cell fluorescence imaging of BODIPY 493/503 staining in PbWT and PbFCKO parasites. Images were captured using 100x objective. Scale bar = 5 μm. f Live cell fluorescence imaging of Nile Red staining in PbWT and PbFCKO parasites. Images were captured using 100x objective. Scale bar = 5 μm. g Quantification of the fluorescence signal from various stages for BODIPY 493/503 staining. The data represent 69 trophozoites and 15 schizonts for PbWT, and 68 trophozoites and 14 schizonts for PbFCKO (n.s not significant, unpaired t-test; two-sided). h Quantification of the fluorescence signal from various stages for Nile Red staining. The data represent 68 trophozoites and 14 schizonts for PbWT, and 70 trophozoites and 14 schizonts for PbFCKO (n.s not significant, unpaired t-test; two-sided). ET early trophozoites, MT mid trophozoites, LT late trophozoites, S schizonts. For (b, g, h), Box and whisker plots display 10th and 90th percentile as the whiskers, 25th−75th percentile as the boxes and median as the centre line. Source data are provided as a Source Data file.
Fig. 8
Fig. 8. Evaluation of OA synthesis and FV proteomics for WT and FCKO parasites.
a TLC separation of 14C-SA radiolabelled unsaturated FAMEs for PbWT and PbFCKO total parasites and FVs. One third of the FAME preparation used for total parasites and entire preparation used for FVs. b, c Band intensities quantified for total parasites and FVs, respectively (mean ± SD; n.s not significant, *P < 0.05, **P < 0.01, ***P < 0.001, unpaired t-test; two-sided), from three different experiments. Individual data points are shown as black circles. d Venn diagram of total proteins identified in the PbWT and PbFCKO FVs. e Functional classification of the proteins based on gene ontologies available at PlasmoDB and UniProt databases. Supplementary Data 1 and Supplementary Data 2 have the complete set of details related to PbWT and PbFCKO FV proteome analyses. Three different FV preparations of PbWT and PbFCKO were pooled independently to get adequate amount of protein for the proteomics analyses. f qPCR analysis of RNA transcripts. The ΔCt values obtained with respect to parasite GAPDH were plotted (mean ± SD; n.s not significant, unpaired t-test; two-sided). The data represent three different preparations of RNA from WT and FCKO parasites. g Western analysis of V-type H+ATPase subunits. The total parasite preparations represent parasite pellets pooled from two different mice. For FVs, three different FV pellets were pooled separately for WT and FCKO. These preparations were independent of those that were used for proteomics analysis. GAPDH is known to be present in FVs and therefore, used as a control for total parasite and FV preparations. (n = 2 independent experiments). Full-length blots are provided in the Supplementary Fig. 7. Source data are provided as a Source Data file.
Fig. 9
Fig. 9. Effect of griseofulvin treatment on CM pathogenesis.
a Mortality curves of PbWT-infected mice treated with different dosages of griseofulvin (***P < 0.001, log-rank (Mantel–Cox) test). b Growth curve analysis (n = 12) for 2 mg dose per day on day 4, 5, 6, 7, and 8 (mean ± SD; n.s not significant, Two-way ANOVA). c Phosphorimager and scanned images of TLC performed for 14C-ALA labeled parasite free heme and the radioactive counts measured for three different experiments (mean ± SD; n.s not significant, *P < 0.05, unpaired t-test; two-sided). Individual data points are shown as black circles. Full-length scans are provided in the Supplementary Fig. 7. d Extravasation of Evans blue and its quantification (n = 3) (mean ± SD; **P < 0.01, unpaired t-test; two-sided). Individual data points are shown as black circles. e H&E staining of the brain sections. Images were captured using 10x objective. Scale bar = 50 μm. n = 3 independent experiments. f Parasite accumulation g CD3+ cells in the blood vessels. n = 2 independent experiments. h Axonal injury in the brain sections. Images were captured using 20x objective. Scale bar = 20 μm. n = 3 independent experiments. i Giemsa-stained parasites. Images were captured using 100x objective. Scale bar = 5 μm. n = 3 independent experiments. j Hz content in differential interference contrast (DIC; left) and bright field images (right) of paraformaldehyde-fixed RBCs. Images were captured using 100x objective. Scale bar = 5 μm. n = 3 independent experiments. k Parasite Hz (n = 8 for control; n = 5 for treated). l Parasite free heme (n = 5). m Plasma free heme (n = 6). n Plasma hemopexin (n = 6). o Plasma heme/hemopexin ratio. p Plasma hemoglobin (n = 6). kp (mean ± SD; n.s not significant, **P ≤ 0.01, ***P < 0.001, unpaired t-test; two-sided). q Mortality curves for PbWT-infected C57BL/6 female mice treated with α,β-arteether alone (n = 9) and α,β-arteether in combination with griseofulvin (n = 9). The data represent two different batches. (***P < 0.001, n.s not significant, log-rank (Mantel–Cox) test). Source data are provided as a Source Data file.
Fig. 10
Fig. 10. Effect of griseofulvin on Pf parasites and model depicting the role of de novo heme in regulating FV integrity and Hz formation.
a Effect of griseofuvin on Pf3D7 parasite growth. The data (mean ± SD; R square = 0.8623) represent three different experiments. Individual data points are shown with the light shaded color. b Incorporation of 14C-ALA into Pf3D7 parasite de novo heme. The radioactive counts represent three different experiments (mean ± SD; *P < 0.05, **P < 0.01, unpaired t-test; two-sided). Individual data points are shown as black circles. Phosphorimager and scanned images of TLC performed for 14C-ALA labeled parasite free heme are also shown. Full-length scans are provided in the Supplementary Fig. 7. c Pf3D7 parasite Hz. d Pf3D7 parasite free heme. The data represent three different experiments (mean ± SD; *P < 0.05, **P < 0.01, unpaired t-test; two-sided). For c and d, individual data points are shown as black circles. e Giemsa-stained images of Pf3D7 parasites treated with griseofulvin. ET and LT early and late trophozoites; ES and LS early and late schizonts. Images were captured using 100x objective. Scale bar = 5 μm. n = 3 independent experiments. f Assessment of parasite Hz, free heme and growth in Pf clinical isolates. The data represent two different experiments for each clinical isolate. Percentage of inhibition was calculated with respect to untreated DMSO control. Individual data points are shown. g De novo heme pathway of malaria parasite and Hz formation in the FV are represented. Solid arrows indicate the effect of de novo heme on V-type H+-ATPase, FV pH and OA synthesis affecting hemozoin formation. Dashed arrows represent the probable effects of de novo heme on Hb endocytosis, and protein and lipid trafficking. Gly glycine, Succ-coA succinyl coenzymeA, ALA δ-aminolevulinic acid, PBG prophobilinogen, URogenIII uroporphyrinogen III, CPogenIII coproporphyrinogen III, PPogenIII protoporphyrinogen III, PPIX protoporphyrin IX, ER endoplasmic reticulum. Source data are provided as a Source Data file.

Similar articles

Cited by

References

    1. World Health Organization. World Malaria Reporthttps://www.who.int/teams/global-malaria-programme/reports/world-malaria... (2021).
    1. World Health Organization. Severe malaria. Trop. Med. Int. Health. 2014;19:7–131. doi: 10.1111/tmi.12313_2. - DOI - PubMed
    1. Zimmerman GA, Castro-Faria-Neto H. Persistent cognitive impairment after cerebral malaria: models, mechanisms and adjunctive therapies. Expert Rev. Anti. Infect. Ther. 2014;8:1209–1212. doi: 10.1586/eri.10.117. - DOI - PubMed
    1. Varo R, et al. Adjunctive therapy for severe malaria: a review and critical appraisal. Malar. J. 2018;17:47. doi: 10.1186/s12936-018-2195-7. - DOI - PMC - PubMed
    1. de Souza JB, Hafalla JC, Riley EM, Couper KN. Cerebral malaria: why experimental murine models are required to understand the pathogenesis of disease. Parasitology. 2010;137:755–772. doi: 10.1017/S0031182009991715. - DOI - PubMed

Publication types