

Identification of a broad-spectrum lytic Myoviridae bacteriophage using multidrug resistant Salmonella isolates from pig slaughterhouses as the indicator and its application in combating Salmonella infections
- PMID: 35821025
- PMCID: PMC9277904
- DOI: 10.1186/s12917-022-03372-8
Identification of a broad-spectrum lytic Myoviridae bacteriophage using multidrug resistant Salmonella isolates from pig slaughterhouses as the indicator and its application in combating Salmonella infections
Abstract
Background: Salmonella is a leading foodborne and zoonotic pathogen, and is widely distributed in different nodes of the pork supply chain. In recent years, the increasing prevalence of antimicrobial resistant Salmonella poses a threat to global public health. The purpose of this study is to the prevalence of antimicrobial resistant Salmonella in pig slaughterhouses in Hubei Province in China, and explore the effect of using lytic bacteriophages fighting against antimicrobial resistant Salmonella.
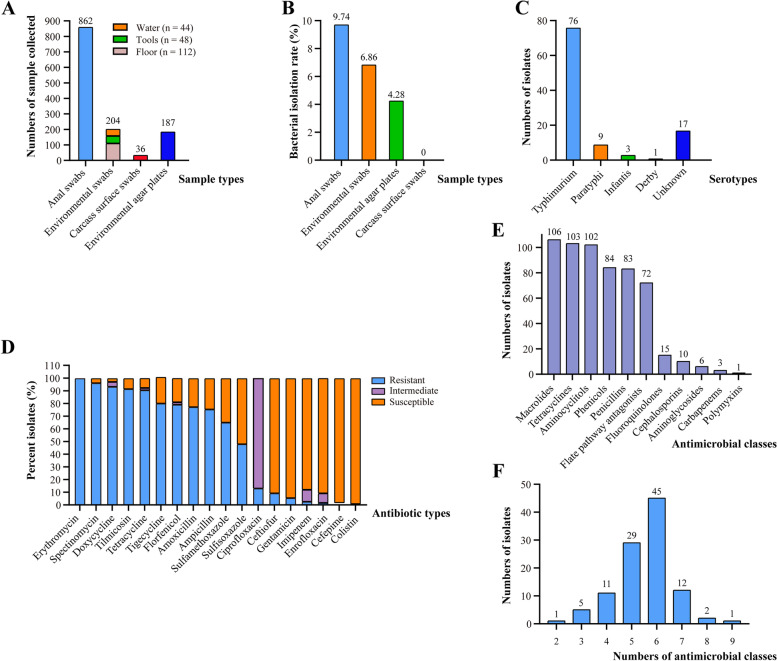
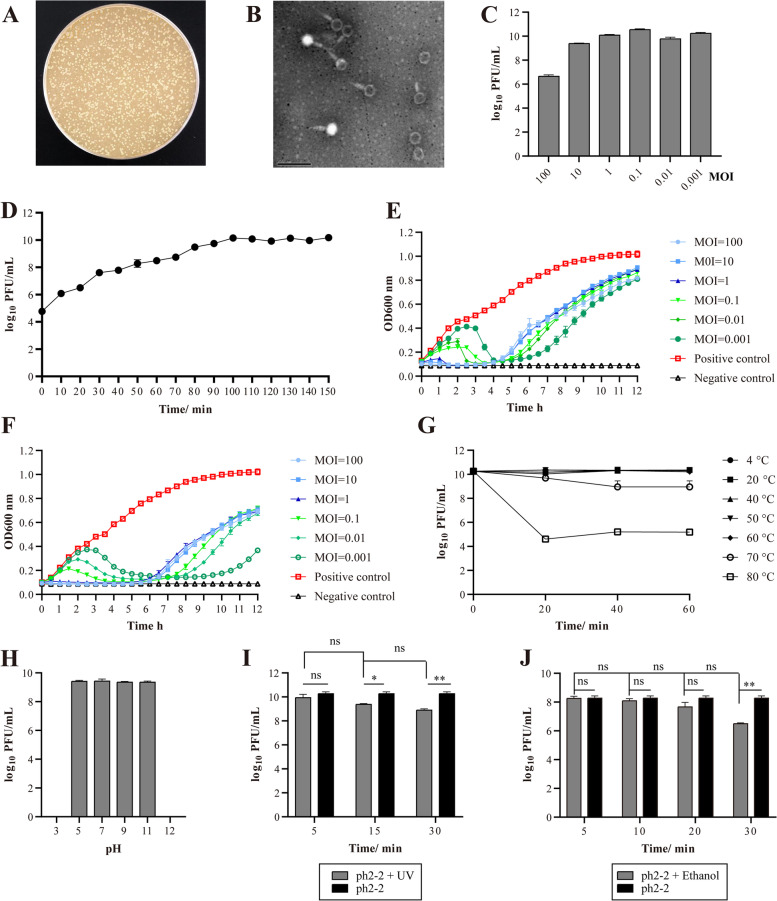
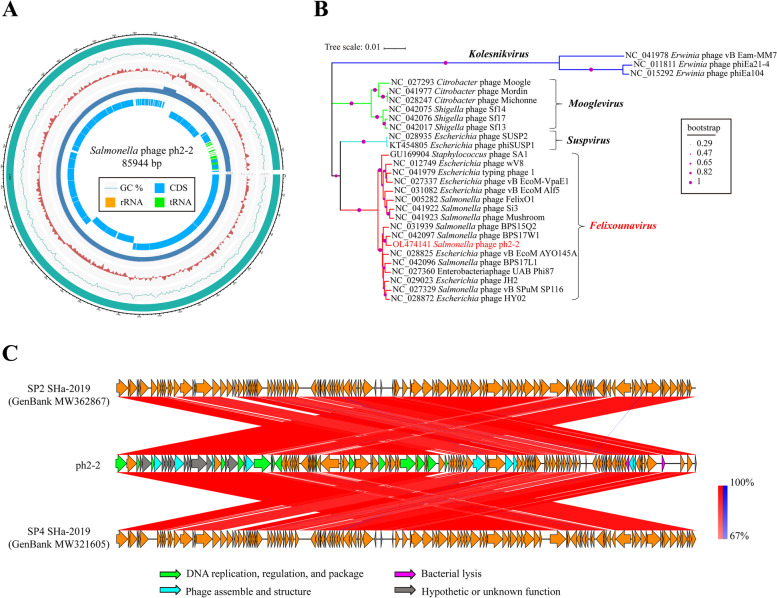
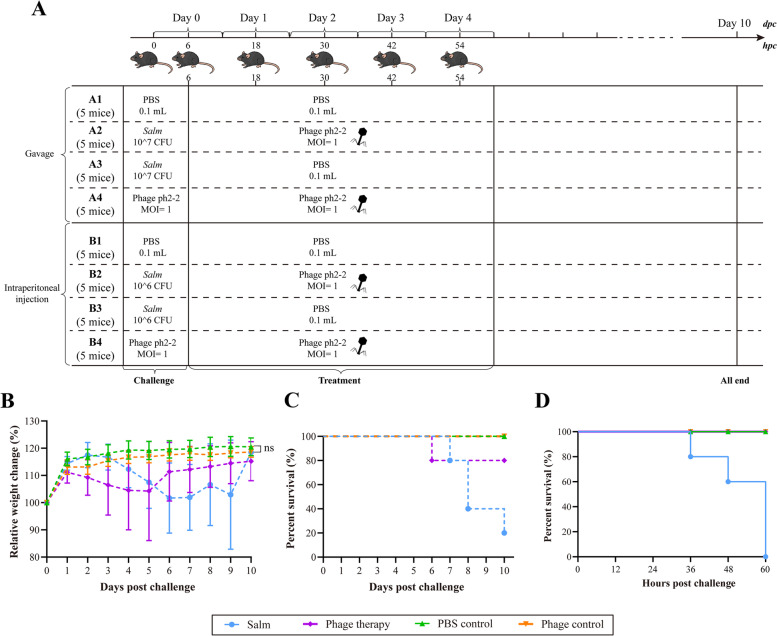
Results: We collected a total of 1289 samples including anal swabs of pigs (862/1289), environmental swabs (204/1289), carcass surface swabs (36/1289) and environmental agar plates (187/1289) from eleven slaughterhouses in seven cities in Hubei Province and recovered 106 Salmonella isolates. Antimicrobial susceptibility testing revealed that these isolates showed a high rate of antimicrobial resistance; over 99.06% (105/106) of them were multidrug resistant. To combat these drug resistant Salmonella, we isolated 37 lytic phages using 106 isolates as indicator bacteria. One of them, designated ph 2-2, which belonged to the Myoviridae family, displayed good capacity to kill Salmonella under different adverse conditions (exposure to different temperatures, pHs, UV, and/or 75% ethanol) and had a wide lytic spectrum. Evaluation in mouse models showed that ph 2-2 was safe and saved 80% (administrated by gavage) and 100% (administrated through intraperitoneal injection) mice from infections caused by Salmonella Typhimurium.
Conclusions: The data presented herein demonstrated that Salmonella contamination remains a problem in some pig slaughter houses in China and Salmonella isolates recovered in slaughter houses displayed a high rate of antimicrobial resistance. In addition, broad-spectrum lytic bacteriophages may represent a good candidate for the development of anti-antimicrobial resistant Salmonella agents.
Keywords: Antimicrobial resistance; Application; Lytic bacteriophage; Prevalence; Salmonella; Slaughterhouse.
© 2022. The Author(s).
Conflict of interest statement
Wan Liang is currently an employee of Hubei Jin Xu Agricultural Development Limited by Share Ltd., Wuhan, China. The other authors declare that they have no known competing financial interests or personal relationships that could have appeared to influence the work reported in this paper.
Figures
Similar articles
-
Longitudinal study of distributions of similar antimicrobial-resistant Salmonella serovars in pigs and their environment in two distinct swine production systems.Appl Environ Microbiol. 2013 Sep;79(17):5167-78. doi: 10.1128/AEM.01419-13. Epub 2013 Jun 21. Appl Environ Microbiol. 2013. PMID: 23793629 Free PMC article.
-
Hygiene Indicators and Salmonellae on Surfaces of Swine Carcasses from Two Slaughterhouses in Northern Portugal.J Food Prot. 2022 Nov 1;85(11):1566-1575. doi: 10.4315/JFP-21-312. J Food Prot. 2022. PMID: 35202475
-
Prevalence and antimicrobial resistance of Salmonella isolated from two pork processing plants in Alberta, Canada.Int J Food Microbiol. 2017 Jan 16;241:49-59. doi: 10.1016/j.ijfoodmicro.2016.10.004. Epub 2016 Oct 7. Int J Food Microbiol. 2017. PMID: 27750110
-
Prevalence, characterization and antimicrobial susceptibility of Salmonella enterica and Yersinia enterocolitica in pigs at slaughter in Italy.Int J Food Microbiol. 2013 May 15;163(2-3):248-57. doi: 10.1016/j.ijfoodmicro.2013.02.012. Epub 2013 Mar 1. Int J Food Microbiol. 2013. PMID: 23603278
-
Salmonella in slaughter pigs: prevalence, serotypes and critical control points during slaughter in two slaughterhouses.Int J Food Microbiol. 2001 Nov 8;70(3):243-54. doi: 10.1016/s0168-1605(01)00545-1. Int J Food Microbiol. 2001. PMID: 11764190
Cited by
-
Phenotypic Characterization and Genome Analysis of New Broad-Spectrum Virulent Salmophage, Salmonella Phage KKP_3822, for Biocontrol of Multidrug-Resistant Salmonella enterica Strains.Int J Mol Sci. 2024 Dec 1;25(23):12930. doi: 10.3390/ijms252312930. Int J Mol Sci. 2024. PMID: 39684641 Free PMC article.
-
Assessment of different factors on the influence of glass wool concentration for detection of main swine viruses in water samples.PeerJ. 2023 Oct 4;11:e16171. doi: 10.7717/peerj.16171. eCollection 2023. PeerJ. 2023. PMID: 37810768 Free PMC article.
References
-
- CDC: Salmonella. https://www.cdc.gov/salmonella/. Accessed 13 Feb 2022.
-
- Grimont PA, Weill F-X. Antigenic formulae of the Salmonella serovars. WHO Collaborating Centre Ref Res Salmonella. 2007;9:1–166.
-
- Hernandez SM, Keel K, Sanchez S, Trees E, Gerner-Smidt P, Adams JK, Cheng Y, Ray A, III, Martin G, Presotto A. Epidemiology of a Salmonella enterica subsp enterica serovar Typhimurium strain associated with a songbird outbreak. Appl Environ Microbiol. 2012;78:7290–7298. doi: 10.1128/AEM.01408-12. - DOI - PMC - PubMed
MeSH terms
LinkOut - more resources
Full Text Sources
