. 2022 Oct;32(10):878-896.
doi: 10.1038/s41422-022-00685-z. Epub 2022 Jul 12.

A super pan-genomic landscape of rice

Affiliations

A super pan-genomic landscape of rice

Lianguang Shang et al. Cell Res. 2022 Oct.

Abstract

Pan-genomes from large natural populations can capture genetic diversity and reveal genomic complexity. Using de novo long-read assembly, we generated a graph-based super pan-genome of rice consisting of a 251-accession panel comprising both cultivated and wild species of Asian and African rice. Our pan-genome reveals extensive structural variations (SVs) and gene presence/absence variations. Additionally, our pan-genome enables the accurate identification of nucleotide-binding leucine-rich repeat genes and characterization of their inter- and intraspecific diversity. Moreover, we uncovered grain weight-associated SVs which specify traits by affecting the expression of their nearby genes. We characterized genetic variants associated with submergence tolerance, seed shattering and plant architecture and found independent selection for a common set of genes that drove adaptation and domestication in Asian and African rice. This super pan-genome facilitates pinpointing of lineage-specific haplotypes for trait-associated genes and provides insights into the evolutionary events that have shaped the genomic architecture of various rice species.


Conflict of interest statement

The authors declare no competing interests.

Figures

Fig. 1
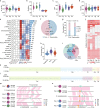
Fig. 1. De novo assembly and annotation of the 251 accessions.
a Geographic distribution of the 251 accessions examined in this study. Colored dots indicate the taxonomic classification of each accession. b Phylogeny of 251 accessions based on whole-genome SNPs. Accessions in different sub-populations are indicated by different colors. c Landscape of genome size and genomic elements across different sub-populations, including the percentage of gene-regions with different lengths, exons, introns, repeats, CentO repeats, LTR, Gypsy LTR, Copia LTR, SINEs + LINEs, and DNA TEs in genome. dg Pearson correlation coefficients for comparisons between genome size and total length of annotation regions (d), the total length of TEs (e), the total length of DNA TEs (f) and total length of LTR (g) across different sub-populations. Colored dots and lines indicate data from each sub-population. Osi, Aus, Osj, Or, Og, and Ob respectively refer to O. sativa indica, O. sativa aus, O. sativa japonica, O. rufipogon, O. glaberrima, and O. barthii.
Fig. 2
Fig. 2. Super pan-genome of 251 wild and cultivated Asian and African Oryza accessions.
a Total length of non-redundant novel sequences detected from the super pan-genome. Non-redundant novel sequences mean sequences that were absent in the Nipponbare reference genome and do not show redundancy across genomes. b Number of non-redundant genes in the non-redundant novel sequences. c The Landscape of PAVs for non-redundant genes across the 251 accessions. Each row indicates a non-redundant gene and each column indicates an accession. If the member of the non-redundant gene was present in an accession, it was colored in red; otherwise, it was colored in blue. Non-redundant genes were sorted by their occurrence. d Gene expression landscape of core and dispensable non-redundant genes. A Wilcoxon test was applied to the FPKM values. eg Bootstrapping of all (e), core (f), and dispensable genes (g) in 11 Os and 10 Or. 11 Os and 10 Or were randomly selected 500 times from 230 Asian rice. The black arrows indicate the numbers of all, core and dispensable genes in 21 African rice (11 Og and 10 Ob), respectively. Non-redundant genes present in ≥ 95% accessions are defined as core non-redundant genes, and the rest of non-redundant genes are dispensable. h The average ratio (numbers) of different non-redundant genes when comparing two accessions. Os, Osi, Osj, Or, Og, Ob, Af, As and All respectively refer to O. sativa, O. sativa indica, O. sativa japonica, O. rufipogon, O. glaberrima, O. barthii, African rice, Asian rice and the 251 accessions.
Fig. 3
Fig. 3. Characterization of NLRs in super pan-genome.
ad Gene numbers across different sub-populations: total number of all NLRs (a), singleton NLRs (b), paired NLRs (c), and clustered NLRs (d). The white dots indicate the mean values. The lowercase letters in the figure reflect the levels of statistical significance assessed with the Kruskal-Wallis tests (with Bonferroni’s multiple comparison post hoc tests). e Summary of integrated domain in NLRs. The heatmap indicates domains’ frequencies (Z-score transformed) among the sub-populations. We used the Wilcoxon test with FDR adjustment to infer the enrichment of a specific domain in a given sub-population. * adjusted P < 0.05, and ** adjusted P < 0.01. The barplot indicates the total number of integrated domain identified in all accessions. The figure only shows integrated domain observed over 10 times and with significant differences between Asian and African accessions. The results for all integrated domain are shown in Supplementary information, Table S2b. f The percentage of core or dispensable non-redundant NLRs in the Asian sub-population, including Osi, Osj, and Or. g Expression of core and dispensable non-redundant NLRs. A Wilcoxon test was applied to analyze the raw expression values. h The percentage of singleton, paired, and clustered NLRs among the core NLRs. The white dots indicate the mean values and the lowercase letters reflect the significance. Kruskal-Wallis tests (with Bonferroni’s multiple comparison post hoc tests) was used for the statistical significance analysis. i Combination pattern of paired NLRs. The inner ring represents the homogeneous rate (pink) and the heterogeneous rate (blue) of pair formation. The outer ring indicates the gene arrangements. H-H, T-T, and T-H respectively refer to the arrangements head-to-head, tail-to-tail, and tail-to-head. j The average number (the number of NLRs contained in the cluster) of collinearity loci in different sub-populations. k, l Example collinearity loci of singleton, paired, and clustered NLRs on Chr8 (k) and Chr9 (l). Gray, blue, and red dots indicate singleton, paired, and clustered NLRs, respectively. m, n The allelic variation among the sub-populations of the collinearity loci Chr8: 2,778,922−2,890,239 (m), Chr9: 20,154,563−20,167,795 (n). As, Af, Osi, Osj, Or, Og and Ob refer to Asian rice, African rice, O. sativa indica, O. sativa japonica, O. rufipogon, O. glaberrima, and O. barthii, respectively.
Fig. 4
Fig. 4. SVs can affect agronomic traits by altering gene expression.
a Manhattan plot of the associations of SVs from the pan-SV dataset and gene expression levels. Only cis results (associations of SVs and their nearby genes (within 2 kb)) were selected from the results of associations of all filtered SVs with all filtered genes and displayed. b Manhattan plot of the associations between the pan-SVs and expression levels of 13 candidate genes of QTL qTGW1.2a. A 1.3 kb DEL was strongly associated with the expression of LOC_Os01g57250. c Expression levels of the 13 candidate genes in QTL qTGW1.2a in leaves of each accession. The FPKM value is represented by different colors, with white indicating low and red indicating high values. Hap.1 and Hap.2 indicate the presence/absence of the 1.3 kb SV in LOC_Os01g57250. d, e FPKM of LOC_Os01g57250 (d) and TGW (e) of accessions with (Hap.2) or without (Hap.1) the SV in LOC_Os01g57250. Significance was tested by Wilcoxon tests (d, e). *P < 0.05, and **P < 0.01. f Expression levels of LOC_Os01g57250 in young leaves (n = 3) investigated by qPCR. The letters indicate statistical significance levels from one-way ANOVA with Tukey's test (P < 0.05). g, h Comparison of TGW among NIP, 9311, and NIL-qTGW1.2aNIP (n = 3). Scale bars, 1 cm. The letters indicate statistical significance levels from one-way ANOVA with Tukey's test (P < 0.05).
Fig. 5
Fig. 5. GWAS analysis using SVs.
a GWAS for grain length using the pan-SV dataset. Complex SVs occurred within the QTL spd6, exhibiting three major haplotypes. b, c Comparison of grain length in Hap.1 and Hap.2 of Osi (b) and Hap.1 and Hap.3 of Osj (c). Osi and Osj respectively refer to O. sativa indica and O. sativa japonica. Significance was tested by two-tailed t-test (b) and Wilcoxon tests (c). *P < 0.05, and **P < 0.01. d, e Comparison of grain length of ZH11, NIL-spd6Or (near-isogenic lines, NIL), and a transgenic plant with cDNA of LOC_Os06g04820 from ZH11 over-expression in the NIL-spd6Or background (n = 3). Scale bars, 1 mm. The letters indicate statistical significance levels from one-way ANOVA with Tukey's test (P <  0.05) (e). f GWAS for grain yield per plant using SVs genotyped based on the variation graph from previously published NGS data. The locus for grain yield on Chromosome 6 could only be identified by SVs but not by SNPs. g The most significant SV was a 1.4 kb DEL at the promoter of LOC_Os06g08550. h Comparison of grain yield per plant between two haplotypes of LOC_Os06g08550. The statistical significance was inferred by the Wilcoxon tests. ** P < 0.01.
Fig. 6
Fig. 6. Submergence adaption and domestication shattering of Asian and African rice.
a Genotypes of genes regulating submergence responses in each accession across sub-populations. Each column was an accession. Different colored boxes indicate different haplotypes. The blank boxes indicate gene absence in the corresponding accession. A gray box indicates the haplotype only present in the corresponding accession; boxes with other colors indicate haplotypes present in more than one accession. b, c FST values (computed based on SNPs at 20 kb resolution) between Ob and Og (b), and between Or and Osj (c) in a 2 Mb genomic region of DEC1 gene. d Genetic network that regulates shattering in rice. Blue, red, or green indicate genes domesticated in Osi, Os, or Og, respectively. e Haplotypes of the SHAT1 gene. Os, Osi, Osj, Or, Og and Ob respectively refer to O. sativa, O. sativa indica, O. sativa japonica, O. rufipogon, O. glaberrima and O. barthii.
Fig. 7
Fig. 7. Structural variations in the RPAD locus in Asian and African rice.
a SVs in the RPAD locus. The red, purple, blue, and black boxes respectively represent zinc-finger (ZNF) genes, EAR motif mutated ZNFs, C2H2 domain mutated ZNFs, and ZNFs with TE insertions. The dotted black lines indicate orthologous relationships. Gray regions indicate collinear sequences. Blue arrows and the corresponding dashed lines indicate deletion sites. Black triangles and P1−P10 indicate the positions and names of the primers used for validation of variations in RPAD locus. b Plant architecture of the control (GIL28) and the transgenic plants of ObZNF1–ObZNF9. Scale bars, 10 cm. c, d Comparison of the tiller angle (c) and tiller number (d) between the control and transgenic plants transformed with the indicated ObZNFs (n = 10). The letters indicate statistical significance assessed using one-way ANOVA with Tukey's test (P <  0.05) (c, d).

Comment in

  • The rice pangenome branches out.
    Olsen KM. Olsen KM. Cell Res. 2022 Oct;32(10):867-868. doi: 10.1038/s41422-022-00699-7. Cell Res. 2022. PMID: 35821091 Free PMC article. No abstract available.

Similar articles

Cited by

References

    1. Gnanamanickam, S. S. Rice and its importance to human life. In: biological control of rice diseases. Progress in biological control. Springer, (2009).
    1. Tao Y, Zhao X, Mace E, Henry R, Jordan D. Exploring and exploiting pan-genomics for crop improvement. Mol. Plant. 2019;12:156–169. doi: 10.1016/j.molp.2018.12.016. - DOI - PubMed
    1. Chen E, Huang X, Tian Z, Wing RA, Han B. The genomics of Oryza species provides insights into rice domestication and heterosis. Annu. Rev. Plant Biol. 2019;70:639–665. doi: 10.1146/annurev-arplant-050718-100320. - DOI - PubMed
    1. Wang W, et al. Genomic variation in 3,010 diverse accessions of Asian cultivated rice. Nature. 2018;557:43–49. doi: 10.1038/s41586-018-0063-9. - DOI - PMC - PubMed
    1. Choi JY, et al. M. D. The rice paradox: multiple origins but single domestication in Asian rice. Mol. Biol. Evol. 2017;34:969–979. - PMC - PubMed

Publication types