. 2022 Jul 12;12(1):11833.
doi: 10.1038/s41598-022-15492-0.

Quantifying the heritability of belief formation

Affiliations

Quantifying the heritability of belief formation

Valentina Vellani et al. Sci Rep. .

Abstract

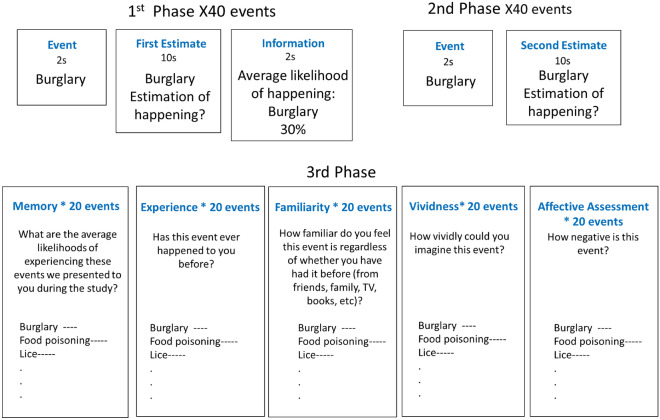
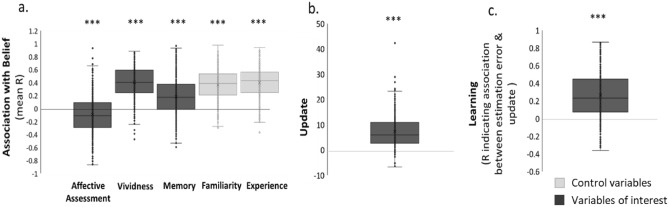
Individual differences in behaviour, traits and mental-health are partially heritable. Traditionally, studies have focused on quantifying the heritability of high-order characteristics, such as happiness or education attainment. Here, we quantify the degree of heritability of lower-level mental processes that likely contribute to complex traits and behaviour. In particular, we quantify the degree of heritability of cognitive and affective factors that contribute to the generation of beliefs about risk, which drive behavior in domains ranging from finance to health. Monozygotic and dizygotic twin pairs completed a belief formation task. We first show that beliefs about risk are associated with vividness of imagination, affective evaluation and learning abilities. We then demonstrate that the genetic contribution to individual differences in these processes range between 13.5 and 39%, with affect evaluation showing a particular robust heritability component. These results provide clues to which mental factors may be driving the heritability component of beliefs formation, which in turn contribute to the heritability of complex traits.


Conflict of interest statement

The authors declare no competing interests.

Figures

Figure 1
Figure 1
Belief Formation Task. On each trial, participants were presented with a short description of an adverse life event (2 s) and asked to estimate how likely this event was to occur to them in the future. They had up to 10 s to respond. They were then presented with the probability of that event occurring to someone from the same age, location and socio-economic background as them for 2 s. This was repeated for 40 different events. The second phase was the same as the first except that the average probability of the event to occur was not presented. In the third phase, subjects were asked to recollect the probability previously presented of the events and rate the events on past experience, familiarity, vividness of imagination and affective assessment. The last phase was repeated for 20 events randomly selected out of the 40 events.
Figure 2
Figure 2
Beliefs are associated with vividness of imagination, affective assessment, learning and memory. (a) Plotted are the mean correlation coefficients obtained by correlating for each participant across trials their prior belief (first estimate) with each rating. Results show that participants believed they were more likely to encounter an aversive event when they imagined the event more vividly, less negatively, and also when they were more familiar with the event, and had experienced it in the past. Participants also tended to remember the likelihood presented to them as greater when their prior regarding that likelihood was greater. (b) Average update scores (calculated as the difference between the first and second estimate coded positively when update is towards the information and negatively otherwise) were significantly greater than zero, suggesting that beliefs are modulated in response to new information. (c) Learning scores (the correlation between update and estimation errors) are significantly greater from 0, indicating that subjects were learning. Horizontal lines indicate median values, boxes indicate 25–75% interquartile range, the crosses indicate mean values and whiskers indicate 1.5 × interquartile range; individual scores are shown separately as circles.***p < 0.001. In black are variables of interest for heritability quantification.
Figure 3
Figure 3
Distribution of cognitive and affective factors associated with beliefs. Plotted are the distributions of the partial correlation (controlling for all covariates—this means that in an analysis of one factor above we are controlling for all the other above factors) between monozygotic (blue) twin A and twin B and dizygotic (red) twin A and twin B for each variable of interest. Since assignment of twins in each pair to the abscissa or ordinate is arbitrary and this assignment influences the correlation value, we randomly reassigned each twin in the pair as twin A or twin B 10,000 times, each time obtaining a correlation coefficient for the monozygotic samples (blue) and for the dizygotic one (red). A stronger correlation for monozygotic twins’ than dizygotic twins indicate heritability of the phenotype. This is indeed observed for belief updating, learning, memory, vividness of imagination, affective assessment, and priors (i.e. first estimate). Note that the width of the distribution for MZ twins is smaller than for DZ because the N is larger.
Figure 4
Figure 4
Plotted on the Y axis is the mean partial Pearson coefficient between DZ twins. Plotted on the X axis is the mean partial Pearson coefficient between MZ twins. Each cross represents a phenotype, clearly marked on the graph. The size of the cross’s line represents the the 2.5% and 97.5% estimates of the distribution. If the similarity on a phenotype within a twin pair is explained by shared environment alone than the mean coefficient should be the same for MZ twins and DZ twins. In such cases the cross should fall on the dotted line. If the similarity on a phenotype within a twin pair is also explained by genetics than the mean coefficient should be larger for MZ twins than DZ twins and fall near the dotted line. The closer the cross is to the bold line the greater the impact of heritability on the phenotype. The partial coefficient are calculated while controlling for all the other variables, as well as past experience and familiarity. Thus, each represents a heritability estimates for a specific factor independent of the rest.

References

    1. Bouchard TJ, McGue M. Familial studies of intelligence: A review. Science. 1981;212(4498):1055–1059. doi: 10.1126/science.7195071. - DOI - PubMed
    1. Bouchard TJ, Loehlin JC. Genes, evolution, and personality. Behav. Genet. 2001;31:243–273. doi: 10.1023/A:1012294324713. - DOI - PubMed
    1. De Neve JE, Christakis NA, Fowler JH, Frey BS. Genes, economics, and happiness. J. Neurosci. Psychol. Econ. 2012;5(4):193. doi: 10.1037/a0030292. - DOI - PMC - PubMed
    1. De Neve JE, Mikhaylov S, Dawes CT, Christakis NA, Fowler JH. Born to lead? A twin design and genetic association study of leadership role occupancy. Leadersh. Q. 2013;24(1):45–60. doi: 10.1016/j.leaqua.2012.08.001. - DOI - PMC - PubMed
    1. Heath AC, Berg K, Eaves LJ, Solaas MH, Corey LA, Sundet J, Nance WE. Education policy and the heritability of educational attainment. Nature. 1985;314(6013):734–736. doi: 10.1038/314734a0. - DOI - PubMed

Publication types