. 2022 Aug;19(8):944-956.
doi: 10.1038/s41423-022-00894-x. Epub 2022 Jul 11.

Glucose metabolism controls human γδ T-cell-mediated tumor immunosurveillance in diabetes

Affiliations

Glucose metabolism controls human γδ T-cell-mediated tumor immunosurveillance in diabetes

Xiaofeng Mu et al. Cell Mol Immunol. 2022 Aug.

Abstract

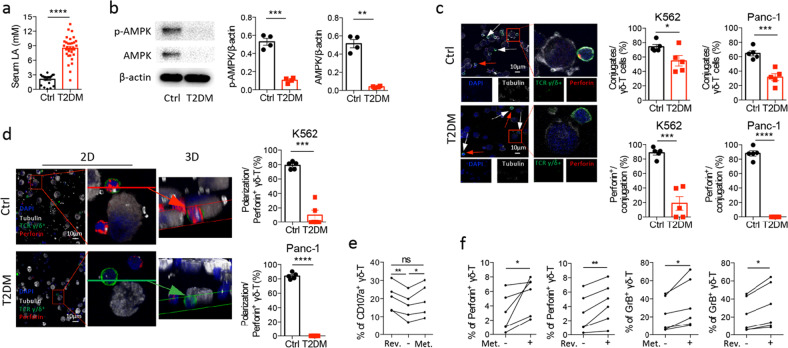
Patients with type 2 diabetes mellitus (T2DM) have an increased risk of cancer. The effect of glucose metabolism on γδ T cells and their impact on tumor surveillance remain unknown. Here, we showed that high glucose induced Warburg effect type of bioenergetic profile in Vγ9Vδ2 T cells, leading to excessive lactate accumulation, which further inhibited lytic granule secretion by impairing the trafficking of cytolytic machinery to the Vγ9Vδ2 T-cell-tumor synapse by suppressing AMPK activation and resulted in the loss of antitumor activity in vitro, in vivo and in patients. Strikingly, activating the AMPK pathway through glucose control or metformin treatment reversed the metabolic abnormalities and restored the antitumor activity of Vγ9Vδ2 T cells. These results suggest that the impaired antitumor activity of Vγ9Vδ2 T cells induced by dysregulated glucose metabolism may contribute to the increased cancer risk in T2DM patients and that metabolic reprogramming by targeting the AMPK pathway with metformin may improve tumor immunosurveillance.

Keywords: AMPK; Glucose metabolism; Lactate; T2DM; Tumor surveillance; γδ T cells.


Conflict of interest statement

The authors declare no competing interests.

Figures

Fig. 1
Fig. 1
High glucose impairs the antitumor activity of Vγ9Vδ2 T cells. a The frequencies and absolute numbers of Vγ9Vδ2 T cells in the peripheral blood of patients with T2DM (T2DM, n = 33) and age-matched healthy controls (Ctrl, n = 20). b The frequencies of CD107a+ Vγ9Vδ2 T cells in patients with T2DM and age-matched healthy controls after PBMCs were cocultured with K562 (n = 28 from T2DM; n = 20 from Ctrl) and Panc-1 target cells (n = 22 from T2DM; n = 20 from Ctrl) for 6 h. c, d PBMCs were isolated from healthy individuals and cultured with phosphoantigen (pamidronate) and IL-2 under normal glucose (NG: 5.5 mM) conditions (NG-Vγ9Vδ2 T cells) or high (HG: 22 mM) glucose conditions (HG-Vγ9Vδ2 T cells). After 14 days of culture, NG- and HG-Vγ9Vδ2 T cells were purified and then cocultured with different target cells for 6 h. Cells were stained with anti-CD3 mAbs to distinguish γδ T cells from target cells, and propidium iodide (PI) was used to identify dead cells. c (left) The percentages of dead K562 target cells (n = 15). c (right) The frequency of CD107a+ Vγ9Vδ2- T cells after coculture with K562 target cells for 6 h (n = 8). d The percentages of dead target cells after coculture with Vγ9Vδ2 T cells for 6 h (n = 8). The data are shown as the mean ± SEM. Statistical analysis was performed using unpaired or paired two-tailed Student’s t test. *p < 0.05; **p < 0.01; ***p < 0.001; ****p < 0.0001
Fig. 2
Fig. 2
High glucose prevents lytic granule secretion by depolarizing lytic granules and the MTOC. a The secretion of perforin, granzyme A/B, and granulysin by NG-Vγ9Vδ2 T cells and HG-Vγ9Vδ2 T cells after coculture with K562 target cells for 6 h (n = 5). b The frequencies of perforin+ and granzyme A/B+ (GrA/B+) Vγ9Vδ2- T cells after coculture with K562 target cells for 4 h (n = 4). cf NG- and HG-Vγ9Vδ2 T cells were cocultured with K562 target cells at an E/T ratio of 1:1 for 30–60 min and stained with anti-human TCR γ/δ mAbs (c and e green), anti-human perforin mAbs (c and e red), DAPI (c and e, blue), and phalloidin (c white) or α-tubulin (e white). Representative confocal images (c and e) and quantification of the conjugations between Vγ9Vδ2 T cells and target tumor cells (d) and perforin/MTOC polarization in Vγ9Vδ2 T-cell-tumor synapses (f) are shown. The dotted lines indicate cell boundaries in d (n = 8) and f (n = 4). The scale bar represents 10 µm. Quantitative data are shown as the mean ± SEM. Statistical analysis was performed using paired two-tailed Student’s t test. *p < 0.05, **p < 0.01, ***p < 0.001; ns, not significant
Fig. 3
Fig. 3
Glucose control restores the antitumor activity of HG-Vγ9Vδ2 T cells in vitro and in vivo. HG-Vγ9Vδ2 T cells were cultured with normal glucose for 12 h (HG→NG-Vγ9Vδ2 T cells), and then the cytotoxicity, secretion of lytic granules, and perforin/MTOC polarization in Vγ9Vδ2 T cells were examined. a The percentages of dead K562 target cells after coculture with NG-, HG- and HG→NG-Vγ9Vδ2 T cells for 6 h (n = 5). b The secretion of perforin, granzyme A/B (GrA/B+), and granulysin by NG-, HG-, HG→NG-Vγ9Vδ2 T cells after coculture with K562 target cells for 6 h (n = 4). c NG-, HG- and HG→NG-Vγ9Vδ2 T cells were cocultured with K562 target cells at an E/T ratio of 1:1 for 30 min and stained with anti-human TCR γ/δ mAbs (green), anti-human perforin mAbs (red), DAPI (blue), and α-tubulin (white). Representative confocal images (left) and quantification of perforin/MTOC polarization in Vγ9Vδ2 T-cell-tumor synapses (right) are shown. The dotted lines indicate cell boundaries (n = 4). The scale bar represents 10 µm. d Diagram of the experimental paradigm in eg. GFP+ A549 tumor cells (0.1 × 106 cells per mouse) were injected into Rag2−/−γc−/− mice subcutaneously (s.c.). The mice were fed normal or high glucose (10%) in drinking water during the experiment. NG-, HG- and HG→NG-Vγ9Vδ2 T cells (10 × 106 cells per mouse) were intravenously (i.v.) transferred into the mice at the indicated times. An equivalent volume of PBS was used in the control groups (n = 6 mice per group). e Whole-body fluorescence images (left) and total radiant efficiency of fluorescence intensity (right) of the mice were assessed after treatment with Vγ9Vδ2 T cells on day 30 after the inoculation of GFP+ A549 tumor cells. f, g Tumor volumes and survival curves were obtained at the indicated times. Quantitative data are shown as the mean ± SEM. In ae, multiple comparisons were analyzed using one-way ANOVA with Tukey’s correction; tumor volumes in f and g were evaluated using two-way ANOVA; survival in f and g was evaluated using a Kaplan–Meier log-rank test. *p < 0.05, **p < 0.01, ***p < 0.001. ns, not significant
Fig. 4
Fig. 4
High glucose enhances glycolysis but inhibits OXPHOS in Vγ9Vδ2 T cells. Real-time analysis of aerobic glycolysis (ECAR) and OXPHOS (OCR) in NG-, HG-, or HG→NG-Vγ9Vδ2 T cells was performed using a Seahorse XF metabolic flux analyzer. a, c ECAR curves (left) were assessed in the presence of metabolic inhibitors (oligomycin and 2-DG). Quantitative comparisons of glycolytic metabolism (right), including glycolysis, glycolytic capacity, and glycolytic reserve, are shown. b, d OCR curves (left) were assessed under basal conditions and after the addition of the indicated mitochondrial inhibitors (oligomycin, FCCP, and rotenone/antimycin A). Quantitative comparisons of mitochondrial functions (right), including basal respiration, maximum respiration, ATP production, and spare respiration capacity, are shown (n = 4). Quantitative data are shown as the mean ± SEM. Statistical analysis was performed using paired two-tailed Student’s t test or one-way ANOVA with Tukey’s correction. *p < 0.05, **p < 0.01. ns, not significant
Fig. 5
Fig. 5
High glucose-induced excessive lactate secretion inhibits AMPK activation and antitumor activity in Vγ9Vδ2 T cells. PBMCs were cultured with normal glucose (NG) and high glucose (HG) for 9 days. a The percentages (left) and absolute cell numbers (middle) of Vγ9Vδ2 T cells were examined. Fold changes in the absolute numbers (right) of HG-Vγ9Vδ2 T cells relative to NG-Vγ9Vδ2 T cells are also shown (n = 4). Representative graphs (left) and quantification (right) of the proliferative response and potential of NG- and HG-Vγ9Vδ2 T cells (n = 4) were further determined by CFSE staining on day 8 (b) and Ki67 staining on day 9 (c), respectively. d Vγ9Vδ2 T cells were cultured without IL-2 supplementation beginning on day 6. The percentages (left), absolute number (middle), and Annexin-V+/propidium iodide+ (AV+/PI+, right) of NG- and HG-Vγ9Vδ2 T cells on day 12 are shown (n = 4). e Representative immunoblot (left) and quantification (middle and right) of p-AMPK and total AMPK in NG-, HG- and HG→NG-Vγ9Vδ2 T cells. GAPDH was used as a loading control (n = 4). f The concentrations of lactate in the culture medium of NG-, HG-, and HG→NG-Vγ9Vδ2 T cells after 36 h of culture were measured (n = 4). g Representative immunoblot analysis of AMPK pathway activation in NG-, HG- and HG→NG-Vγ9Vδ2 T cells treated with different concentrations (from 2.5 to 30 mM) of lactic acid for 2 and 6 h are shown. β-actin was used as a loading control. h p-AMPK expression levels relative to AMPK and β-actin expression are shown (n = 5). i, j NG- and HG-Vγ9Vδ2 T cells were treated with or without GSK (20 µM) for 6 h, and AMPK pathway activation (i) and cytotoxicity against K562 target cells (j) were assessed (n = 4). β-actin was used as a loading control. Quantitative data are shown as the mean ± SEM. Statistical analysis was performed using paired two-tailed Student’s t test or one-way ANOVA with Tukey’s correction. *p < 0.05, **p < 0.01, ***p < 0.001. ns, not significant
Fig. 6
Fig. 6
Metformin restores the antitumor activity of Vγ9Vδ2 T cells by activating the AMPK pathway. a Representative immunoblot and the expression levels of p-AMPK AMPK, p-ACC, and ACC in NG-, HG- and HG→NG-Vγ9Vδ2 T cells after treatment with or without metformin (Met.) are shown. β-actin was used as a loading control (n = 4). b, c Representative confocal images and quantification of perforin/MTOC polarization in Vγ9Vδ2 T-cell-tumor synapses with or without metformin treatment (Met.) are shown. Dotted lines indicate cell boundaries (n = 4). The scale bar represents 10 µm. d The percentages of dead K562 target cells after coculture with NG-, HG- and HG→NG-Vγ9Vδ2 T cells with or without metformin treatment (Met.) for 12 h are shown (n = 5). e The secretion of perforin, granzyme A/B, and granulysin by NG-, HG-, HG→NG-Vγ9Vδ2 T cells after coculture with K562 target cells for 6 h with or without metformin treatment (Met.) (n = 4). fi NG- and HG-Vγ9Vδ2 T cells were treated with or without Compound C (CC, 20 µM, f and g) for 6 h or Compound 991 (991, 20 µM, h and i) for 2 h, and AMPK pathway activation (f and h) and cytotoxicity against K562 target cells (g and i) were assessed (n = 4~6). β-actin was used as a loading control. Quantitative data are shown as the mean ± SEM. Statistical analysis was performed using one-way ANOVA with Tukey’s correction. *p < 0.05, **p < 0.01, ***p < 0.001, ****p < 0.0001. ns, not significant
Fig. 7
Fig. 7
Patients with T2DM have elevated serum lactate and defective AMPK activity and antitumor activity in Vγ9Vδ2 T cells. a Serum lactic acid (LA) levels in patients with T2DM (T2DM, n = 33) and age-matched healthy controls (Ctrl, n = 20). b The expression of p-AMPK and total AMPK in Vγ9Vδ2 T cells purified from the PBMCs of patients with T2DM and healthy controls. β-actin was used as a loading control (n = 4). c, d Vγ9Vδ2 T cells purified from the PBMCs of patients with T2DM and healthy controls were cocultured with K562 or Panc-1 target cells for 30 min, and perforin+ Vγ9Vδ2 T cells, the conjugation between Vγ9Vδ2 T cells and target cells, and perforin/MTOC polarization in Vγ9Vδ2 T cells were examined. Representative confocal images (c left) and quantification of the conjugation between Vγ9Vδ2 T cells and target cells and the frequencies of perforin+Vγ9Vδ2 T cells in the conjugation (c right) are shown (n = 5). Red arrows show unconjugated Vγ9Vδ2 T cells. White arrows show Vγ9Vδ2 T cells without perforin expression. Human TCR γ/δ (green), human perforin (red), DAPI (blue), and α-tubulin (white). The scale bar represents 10 µm. Representative confocal 2D and 3D images (d left) and quantification (d right) of perforin/MTOC polarization in Vγ9Vδ2 T cells are shown (n = 5). e The frequencies of CD107a+ Vγ9Vδ2- T cells from patients with T2DM after metformin (Met.) treatment or glucose control by reversing high glucose to a normal glucose level (Rev.) were analyzed by flow cytometry (n = 5). f The frequencies of perforin+ and granzyme B+ Vγ9Vδ2- T cells from patients with T2DM after metformin (Met.) treatment or glucose control by reversing high glucose to normal glucose levels (Rev.) were analyzed by flow cytometry (n = 6). Quantitative data are shown as the mean ± SEM. The data in ad were evaluated using unpaired two-tailed Student’s t test. The data in e were evaluated using one-way ANOVA with Tukey’s correction. The data in f were evaluated using paired two-tailed Student’s t test. *p < 0.05, **p < 0.01, ***p < 0.001, ****p < 0.0001. ns, not significant

References

    1. Cho NH, Shawe JE, Karuranga S, Huang Y, da Rocha Fernandes JD, Ohlrogge AW. IDF Diabetes Atlas: global estimates of diabetes prevalence for 2017 and projections for 2045. Diabetes Res Clin Pract. 2018;138:271–81. doi: 10.1016/j.diabres.2018.02.023. - DOI - PubMed
    1. Holman N, Young B, Gadsby R. Current prevalence of Type 1 and Type 2 diabetes in adults and children in the UK. Diabet Med. 2015;32:1119–20. doi: 10.1111/dme.12791. - DOI - PubMed
    1. Bruno G, Runzo C, Cavallo-Perin P, Merlletti F, Rivetti M, Pinach S, et al. Incidence of type 1 and type 2 diabetes in adults aged 30-49 years: the population-based registry in the province of Turin, Italy. Diabetes Care. 2005;28:2613–9. doi: 10.2337/diacare.28.11.2613. - DOI - PubMed
    1. Olokoba AB, Obateru OA, Olokoba LB. Type 2 diabetes mellitus: a review of current trends. Oman Med J. 2012;27:269–73. doi: 10.5001/omj.2012.68. - DOI - PMC - PubMed
    1. Giovannucci E, Harlan DM, Archer MC, Bergenstalet RM, Gapstur SM, Habel LA, et al. Diabetes and cancer: a consensus report. CA Cancer J Clin. 2010;60:207–21. doi: 10.3322/caac.20078. - DOI - PubMed

Publication types