. 2022 Jul 12;12(1):11830.
doi: 10.1038/s41598-022-16005-9.

Multi-omics profiling of collagen-induced arthritis mouse model reveals early metabolic dysregulation via SIRT1 axis

Affiliations

Multi-omics profiling of collagen-induced arthritis mouse model reveals early metabolic dysregulation via SIRT1 axis

Lingzi Li et al. Sci Rep. .

Abstract

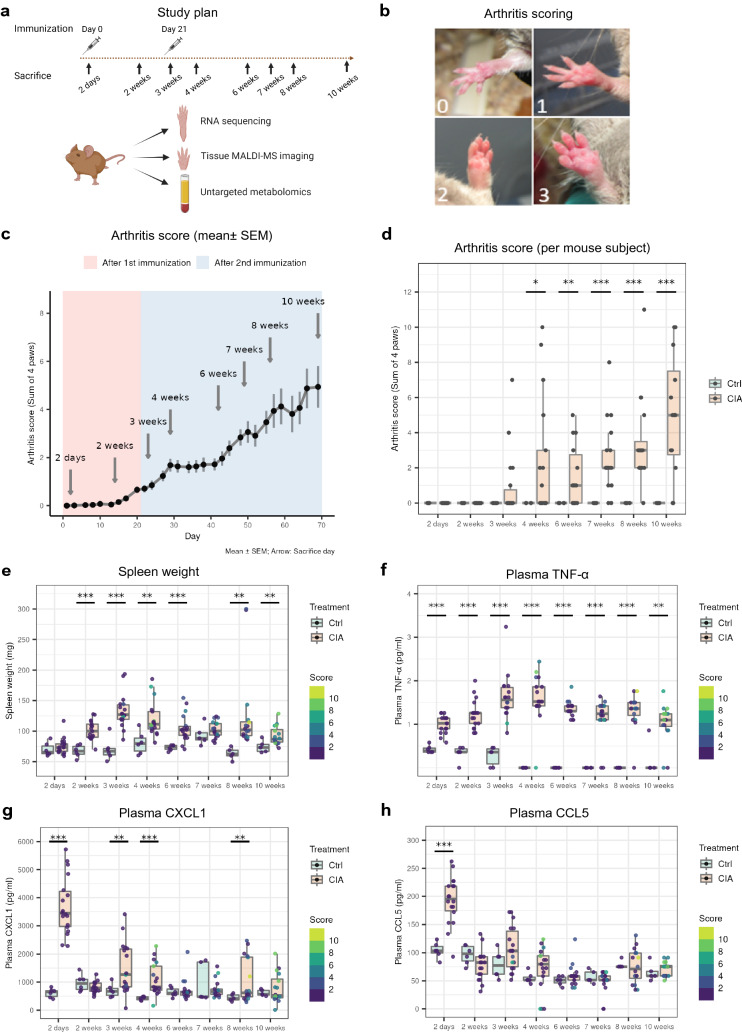
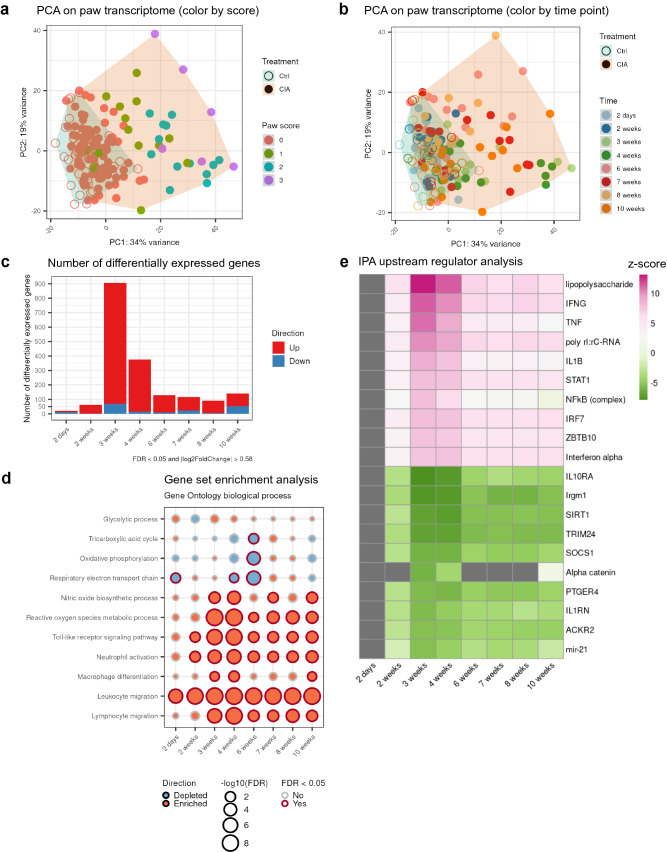
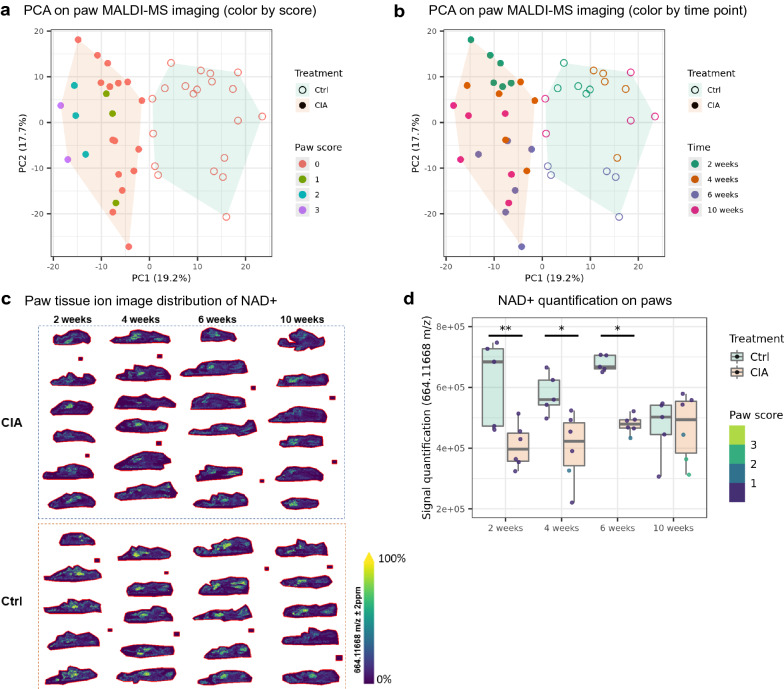
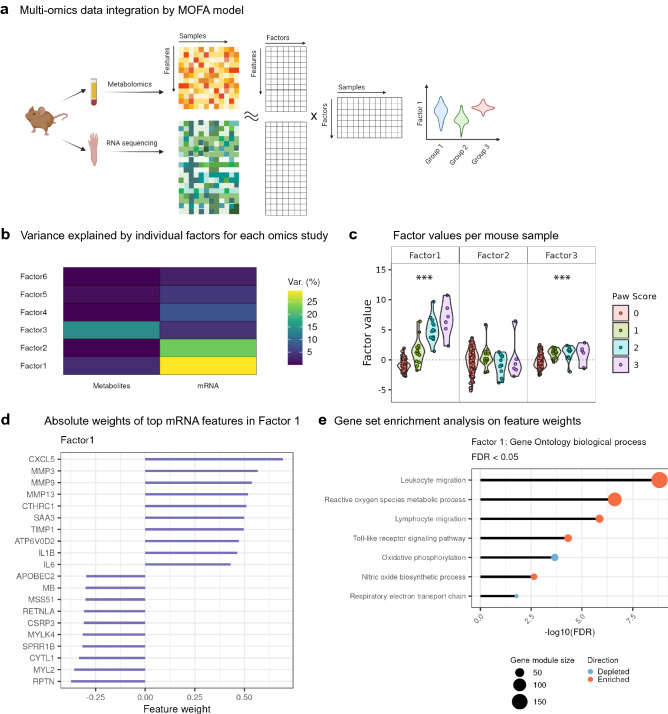
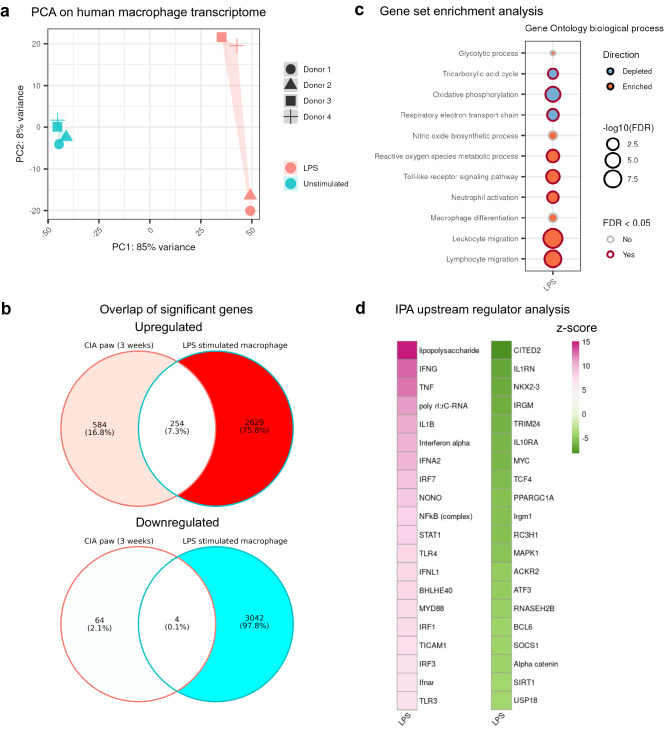
Rheumatoid arthritis (RA) is characterized by joint infiltration of immune cells and synovial inflammation which leads to progressive disability. Current treatments improve the disease outcome, but the unmet medical need is still high. New discoveries over the last decade have revealed the major impact of cellular metabolism on immune cell functions. So far, a comprehensive understanding of metabolic changes during disease development, especially in the diseased microenvironment, is still limited. Therefore, we studied the longitudinal metabolic changes during the development of murine arthritis by integrating metabolomics and transcriptomics data. We identified an early change in macrophage pathways which was accompanied by oxidative stress, a drop in NAD+ level and induction of glucose transporters. We discovered inhibition of SIRT1, a NAD-dependent histone deacetylase and confirmed its dysregulation in human macrophages and synovial tissues of RA patients. Mining this database should enable the discovery of novel metabolic targets and therapy opportunities in RA.


Conflict of interest statement

All authors are current or former employees of Sanofi and may hold shares and/or stock options in the company.

Figures

Figure 1
Figure 1
Arthritis progression in CIA mice. (a) Experimental scheme. (b) Representative mouse paws with corresponding arthritis scores. (c) Evolution of arthritis severity by scores (sum of 4 paws, plotted as mean ± SEM). (d) Arthritis severity at each sacrifice time point per mouse subject. (e) Spleen weight measured at each sacrifice time point. (f) Plasma TNF-α concentration. (g) Plasma CXCL1 concentration. (h) Plasma CCL5 concentration. The cytokines and chemokines were measured by mouse magnetic Luminex assays. The dots on the boxplots represent individual mouse samples. At each time point, the sample size for controls is ≥ 5 and the sample size for CIA is ≥ 16. The color of each dot represents the arthritis score of the mouse (sum of 4 paws). Two-tail Welch t tests were performed (p < 0.05*, p < 0.01**, p < 0.001***).
Figure 2
Figure 2
UPLC-MS/MS metabolomics revealed early metabolic alterations in plasma of CIA mice. UPLC-MS/MS metabolomics in total detected 929 metabolites. At each time point, the sample size for controls is ≥ 5 and the sample size for CIA is ≥ 16. (a) Principal component analysis (PCA) score plot with plasma samples projected onto the first 2 principal components. (b) Percentage of each metabolic group detected by UPLC-MS/MS. (c) Number of significant metabolites at each time point (CIA samples compared to the controls). Significance was decided by cutoffs of FDR < 0.05 and fold change > 1.5 in up or down direction. (d) Percentage of significant metabolites per metabolite group at each time point. Counts of significant metabolites were first normalized to the total number of detected metabolites per metabolite group, and then assembled into a percent stacked bar plot. (e) Percentage of upregulated and downregulated significant metabolites per group over time. (f,g) Fold changes and significances of peptides, energy metabolites and related cofactors that are significant at ≥ 2 time points (these 2 figures were plotted on the same scale). Two-way ANOVA was done with multiple testing correction using false discovery rate (FDR) method. Significance was decided by cutoffs of FDR < 0.05 and fold change > 1.5 in up or down direction.
Figure 3
Figure 3
Transcriptional profiling of CIA paws over disease progression revealed innate immune cell activation and metabolic adaptations. Bulk RNA-seq on right hind paws from control and CIA mice at different disease stages. At each time point, the sample size for controls is ≥ 5 and the sample size for CIA is ≥ 14. (a) PCA score plot with paw samples color-coded by their respective arthritis scores. (b) PCA score plot with paw samples color-coded by their respective sacrifice time points. (c) Number of differentially expressed genes at each time point (CIA samples compared to the controls). The likelihood ratio test (LRT) in DESeq2 was performed for statistical analysis. Significance was decided by cutoffs of FDR < 0.05 and fold change > 1.5 in up or down direction. (d) Enriched or depleted Gene Ontology biological process gene sets at each time point. Gene set enrichment analysis was carried out using the R package fgsea. (e) Top 10 activated and top 10 inhibited upstream regulators from analysis by IPA. Only upstream regulators with Benjamini–Hochberg (B–H) adjusted p-values < 0.05 were shown with z-scores on a color gradient (activated: pink, inhibited: green). For upstream regulators with B–H adjusted p-values ≥ 0.05, the z-scores were shown as grey.
Figure 4
Figure 4
Tissue MALDI-MS imaging showed reduction of NAD+ in CIA paws. Tissue MALDI-MS imaging on left front paws from control and CIA mice at different disease stages. At each time point, the sample size for controls is 5 and the sample size for CIA is 6. (a) PCA score plot with paw samples color-coded by their respective arthritis scores. (b) PCA score plot with paw samples color-coded by their respective sacrifice time points. (c) NAD+ distribution on paw tissue ion image per mouse. Cryosections of mouse paws were analyzed by MALDI-MS tissue imaging mass spectrometry. The mass to charge 664.11668 was assigned to NAD+ with a mass accuracy of 0.4 ppm and its TIC (T = Total Ion Count) normalized tissue distribution is shown at a spatial lateral resolution of 50 × 50 µm. The color legend reflects the relative intensity [Arb.U] distribution from 0 to 100%. (d) Image signal quantification of NAD+ on paws. Two-way ANOVA with Tukey multiple pairwise-comparisons was done (p adj < 0.05*, p adj < 0.01**, p adj < 0.001***).
Figure 5
Figure 5
Multi-omics data integration identifies ROS as disease-correlated factor. (a) Overview of MOFA model. MOFA is an unsupervised method for integrating multi-omics data. In this study, MOFA decomposes the data matrices of metabolomics and transcriptomics with co-occurrent samples into a weight matrix for each omics data and a matrix of factors for each sample. “Features” denote metabolites in metabolomics data, or mRNA in transcriptome data. Visualization of sample groups by factor values can identify factors associated with disease phenotypes. (b) Proportion of total variance (Var.) explained by individual factors for each omics experiment. (c) Visualization of samples using Factors 1, 2 and 3. The dots on violin plots represent mouse subjects. The colors denote the arthritis scores of the right hind paws. One-way ANOVA was used to assess if there is any significant difference among the subjects in the 4 score groups (p < 0.05*, p < 0.01**, p < 0.001***). (d) Absolute weights of the top features of Factors 1 in transcriptome data. (e) Gene set enrichment analysis on the feature weights of mRNA in Factor 1 (FDR < 0.05).
Figure 6
Figure 6
Transcriptional profiling of LPS-stimulated human macrophages partially overlaps to early transcript changes in mouse CIA. Bulk RNA-seq analysis of human monocyte-derived macrophages from four human donors. Stimulation was done with 50 ng/ml LPS for 24 h. (a) PCA score plot with four samples of human macrophages before and after LPS stimulation. (b) Overlap of significant differentially expressed genes between CIA paws at week 3 and LPS-stimulated macrophages. The Wald test in DESeq2 was performed for statistical analysis on macrophage dataset and LPS-stimulated samples were compared to the unstimulated. (c) Enriched or depleted Gene Ontology biological process gene sets. (d) Top 20 activated and top 20 inhibited upstream regulators from analysis by IPA. Only upstream regulators with Benjamini–Hochberg (B–H) adjusted p-values < 0.05 were shown with z-scores on a color gradient (activated: pink, inhibited: green).
Figure 7
Figure 7
Gene expression of human synovium over disease progression to RA showed similar changes in oxidative stress and innate immunity. Published RNA-seq dataset (GSE89408) contains synovium samples from healthy humans (n = 27) and patients with arthralgia (n = 10), undifferentiated arthritis (UA, n = 6) and early RA (n = 57). (a) Human RA progression from arthralgia, UA and early RA. (b) PCA score plot with patient samples color-coded by disease stage. (c) Number of significant differentially expressed genes at each disease stage. The Wald test in DESeq2 was performed for statistical analysis and the diseased samples (arthralgia, UA and early RA) were compared to the healthy. Significance was decided by cutoffs of FDR < 0.05 and fold change > 1.5 in up or down direction. (d) Overlap of significant differentially upregulated genes between CIA paws at week 3 and human synovium of different RA stages. (e) Enriched or depleted Gene Ontology biological process gene sets. (f) Top 10 activated and top 10 inhibited upstream regulators from analysis by IPA. Only upstream regulators with Benjamini–Hochberg (B–H) adjusted p-values < 0.05 were shown with z-scores on a color gradient (activated: pink, inhibited: green). For upstream regulators with B–H adjusted p-values ≥ 0.05, the z-scores were shown as grey.
Figure 8
Figure 8
Metabolic reprogramming in early RA. (a–c) Differential gene expression of major metabolic genes in the RNA-seq studies of CIA mouse paws, LPS-stimulated human macrophages, and human RA synovium biopsies. Significance was decided by cutoffs of FDR < 0.05 and fold change > 1.5 in up or down direction. (d) Schematic hypothesis showing that innate immune cells drive the metabolic changes by SIRT1 axis at the initial phase of RA.

References

    1. Smolen JS, et al. Rheumatoid arthritis. Nat. Rev. Dis. Primers. 2018;4(1):18001. - PubMed
    1. van der Woude D, van der Helm-van AH. Update on the epidemiology, risk factors, and disease outcomes of rheumatoid arthritis. Best Pract. Res. Clin. Rheumatol. 2018;32(2):174–187. - PubMed
    1. Lewis MJ, et al. Molecular portraits of early rheumatoid arthritis identify clinical and treatment response phenotypes. Cell Rep. 2019;28(9):2455–2470.e5. - PMC - PubMed
    1. Makowski L, Chaib M, Rathmell JC. Immunometabolism: From basic mechanisms to translation. Immunol. Rev. 2020;295(1):5–14. - PMC - PubMed
    1. Ganeshan K, Chawla A. Metabolic regulation of immune responses. Annu. Rev. Immunol. 2014;32(1):609–634. - PMC - PubMed