. 2023 Jan;55(1):141-150.
doi: 10.1007/s11255-022-03287-1. Epub 2022 Jul 11.

Iron absorption and phosphate-lowering effects of ferric citrate hydrate are not influenced by gastric acid secretion inhibitors in patients with chronic kidney disease: a retrospective post hoc analysis

Affiliations

Iron absorption and phosphate-lowering effects of ferric citrate hydrate are not influenced by gastric acid secretion inhibitors in patients with chronic kidney disease: a retrospective post hoc analysis

Kyoko Ito et al. Int Urol Nephrol. 2023 Jan.

Abstract

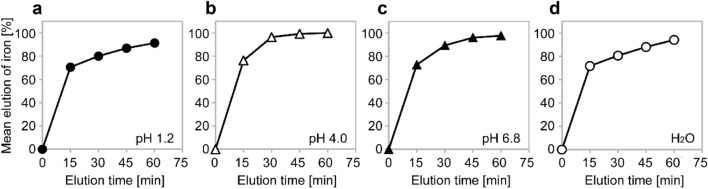
Background: Ferric citrate hydrate (FC), an oral iron product is approved as iron preparation for iron deficiency anemia and phosphate binder for chronic kidney disease (CKD). We investigated whether gastric acid secretion inhibitors (GASI) influenced on iron absorption and phosphate-lowering effects of FC.

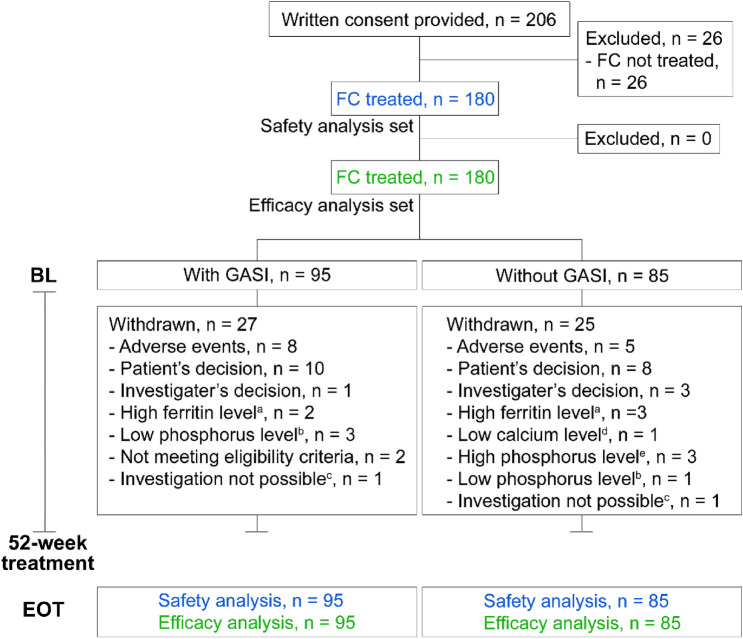
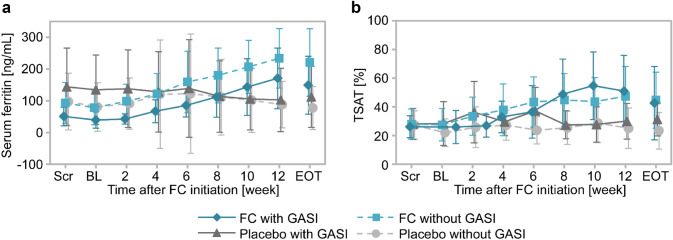
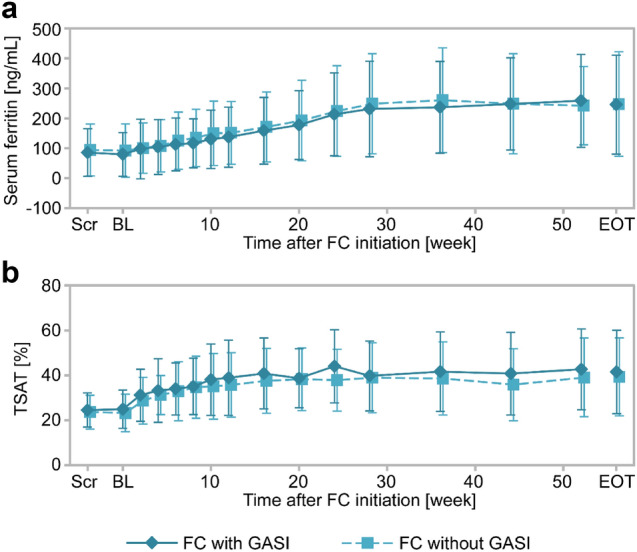
Methods: Two phase 3 studies of FC for treatment of hyperphosphatemia in CKD patients (non-dialysis-dependent, 12 weeks, and hemodialysis, 52 weeks), were retrospectively analyzed. Patients were divided into with or without concomitant GASI and levels of iron- and phosphate-related parameters were analyzed.

Results: In non-dialysis study (FC, 60 patients; placebo, 30 patients), 14 FC patients and 14 placebo patients used GASI. No significant differences were found between the FC and placebo groups for adjusted mean differences (95% CI) of changes from baseline to end of treatment (EOT) in serum ferritin [104.84 ng/mL (35.97, 173.71) with GASI vs 145.30 ng/mL (96.34, 194.25) without GASI, P = 0.34], and transferrin saturation (TSAT) [12.56% (- 0.83, 25.95) with GASI vs 18.56% (8.15, 28.98) without GASI, P = 0.49]. In hemodialysis study, 95/180 patients used GASI. Mean changes (SD) from baseline to EOT in serum ferritin were 166.32 ng/mL (153.70) with GASI and 155.16 ng/mL (139.47) without GASI, and for TSAT were 16.60% (19.44) with GASI and 16.02% (18.81) without GASI. In both studies, there were no differences in the changes from baseline to EOT in serum phosphate between with and without GASI cohorts.

Conclusion: GASI did not influence on the changes in serum ferritin, TSAT and serum phosphate by FC administration.

Keywords: Chronic kidney disease; Ferric citrate hydrate; Gastric acid secretion inhibitors; Histamine-2 receptor antagonist; Iron deficiency anemia; Proton pump inhibitor.


Conflict of interest statement

Kyoko Ito is an employee of Torii Pharmaceutical Co., Ltd. and Keitaro Yokoyama has received honoraria from Japan Tobacco Inc., Torii Pharmaceutical Co., Ltd., Ono Pharmaceutical Co., Ltd., and Kyowa Kirin Co., Ltd.

Figures

Fig. 1
Fig. 1
Patient flow in the GBA4-4 study. Flow of non-dialysis-dependent patients from the GBA4-4 study. a A patient may have multiple reasons to withdraw. b Serum phosphate level was < 2.5 mg/dL in two consecutive investigations after FC treatment initiation. BL baseline, EOT end of treatment, FC ferric citrate hydrate, GASI gastric acid secretion inhibitor
Fig. 2
Fig. 2
Patient flow in the GBA4-6 study. Flow of patients undergoing hemodialysis from the GBA4-6 study. a Ferritin level ≥ 800 ng/mL. b Serum phosphate level was < 3.0 mg/dL in two consecutive investigations. c Investigation was not possible for patient’s reason. d Serum corrected calcium level was < 7.5 mg/dL in two consecutive investigations. e Serum phosphate level was ≥ 10.0 mg/dL in two consecutive investigations. BL baseline, EOT end of treatment, FC ferric citrate hydrate, GASI gastric acid secretion inhibitor
Fig. 3
Fig. 3
Time-course changes in serum ferritin and TSAT in non-dialysis-dependent patients from the GBA4-4 study (safety analysis set). Time-course changes in serum ferritin (a) and TSAT (b). Blue lines, FC group; gray lines, placebo group; solid lines, with GASI cohort; broken lines, without GASI cohorts. Data are the mean ± standard deviation. BL baseline, EOT end of treatment, FC ferric citrate hydrate, GASI gastric acid secretion inhibitor, Scr screening, TSAT transferrin saturation
Fig. 4
Fig. 4
Time-course changes in serum phosphate in non-dialysis-dependent patients from the GBA4-4 study (efficacy analysis set). Time-course changes in serum phosphate. Blue lines, FC group; gray lines, placebo group; solid lines, with GASI cohort; broken lines, without GASI cohorts. Data are the mean ± standard deviation. BL baseline, EOT end of treatment, FC ferric citrate hydrate, GASI gastric acid secretion inhibitor, Scr screening
Fig. 5
Fig. 5
Time-course changes in serum ferritin and TSAT in patients undergoing hemodialysis from the GBA4-6 study (safety analysis set) Time-course changes in serum ferritin (a) and TSAT (b). Solid line, with GASI cohort; broken line, without GASI cohorts. Data are the mean ± standard deviation. BL baseline, EOT end of treatment, FC ferric citrate hydrate, GASI gastric acid secretion inhibitor, Scr screening, TSAT transferrin saturation
Fig. 6
Fig. 6
Time-course change in serum phosphate in patients undergoing hemodialysis from the GBA4-6 study (efficacy analysis set) Time-course changes in serum phosphate. Solid line, with GASI cohort; broken lines, without GASI cohorts. Data are the mean ± standard deviation. BL baseline, EOT end of treatment, FC ferric citrate hydrate, GASI gastric acid secretion inhibitor, Scr screening
Fig. 7
Fig. 7
Elution behavior of iron from ferric citrate hydrate (Riona®) under different pH conditions. The elution solution was filtered through a 0.45 µm membrane filter, followed by reduction using L-ascorbic acid. The iron concentration was determined by the 1,10-phenanthroline spectrometric method and the elution rate was calculated using an iron standard solution (1000 mg/L Japan Calibration Service System), which was used as a 100% elution solution. The mean elution ratio of solutions adjusted for pH 1.2 (a), pH 4.0 (b), pH 6.8 (c), and a water control (d) (n = 6 for each). Modified from Koyama et al. [19]

References

    1. Jacobs A, Miles PM. Role of gastric secretion in iron absorption. Gut. 1969;10:226–229. doi: 10.1136/gut.10.3.226. - DOI - PMC - PubMed
    1. Lam JR, Schneider JL, Quesenberry CP, Corley DA. Proton pump inhibitor and histamine-2 receptor antagonist use and iron deficiency. Gastroenterology. 2017;152:821–9.e1. doi: 10.1053/j.gastro.2016.11.023. - DOI - PubMed
    1. Geokas MC, McKenna RD. Iron-deficiency anemia after partial gastrectomy. Can Med Assoc J. 1967;96:411–417. - PMC - PubMed
    1. Sandvik J, Bjerkan KK, Græslie H, Hoff DAL, Johnsen G, Klöckner C, et al. Iron deficiency and anemia 10 years after Roux-en-Y gastric bypass for severe obesity. Front Endocrinol (Lausanne) 2021;12:679066. doi: 10.3389/fendo.2021.679066. - DOI - PMC - PubMed
    1. Iida A, Kemmochi Y, Kakimoto K, Tanimoto M, Mimura T, Shinozaki Y, et al. Ferric citrate hydrate, a new phosphate binder, prevents the complications of secondary hyperparathyroidism and vascular calcification. Am J Nephrol. 2013;37:346–358. doi: 10.1159/000348805. - DOI - PubMed