. 2022 Jul 11;13(1):4018.
doi: 10.1038/s41467-022-31772-9.

Single-cell analysis highlights differences in druggable pathways underlying adaptive or fibrotic kidney regeneration

Affiliations

Single-cell analysis highlights differences in druggable pathways underlying adaptive or fibrotic kidney regeneration

Michael S Balzer et al. Nat Commun. .

Abstract

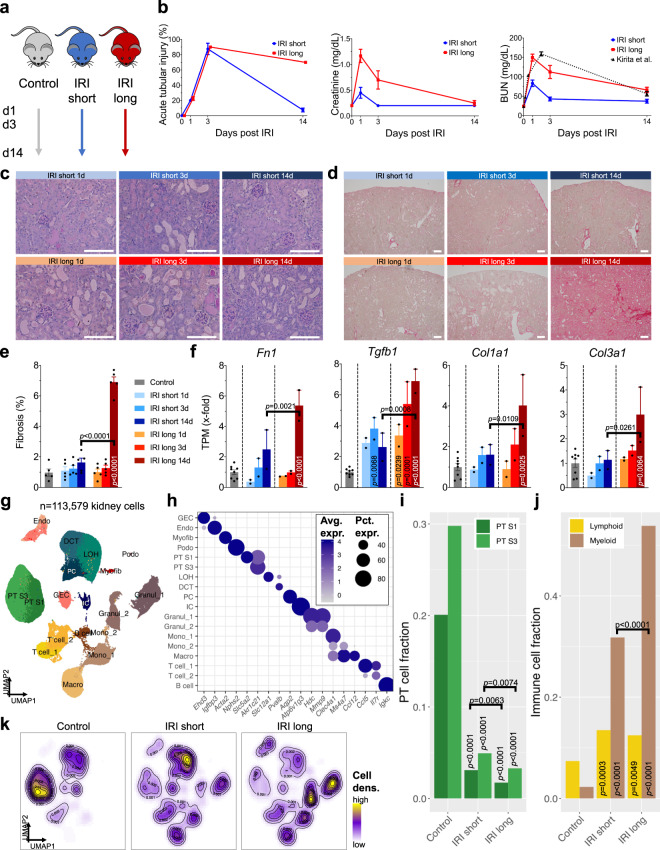
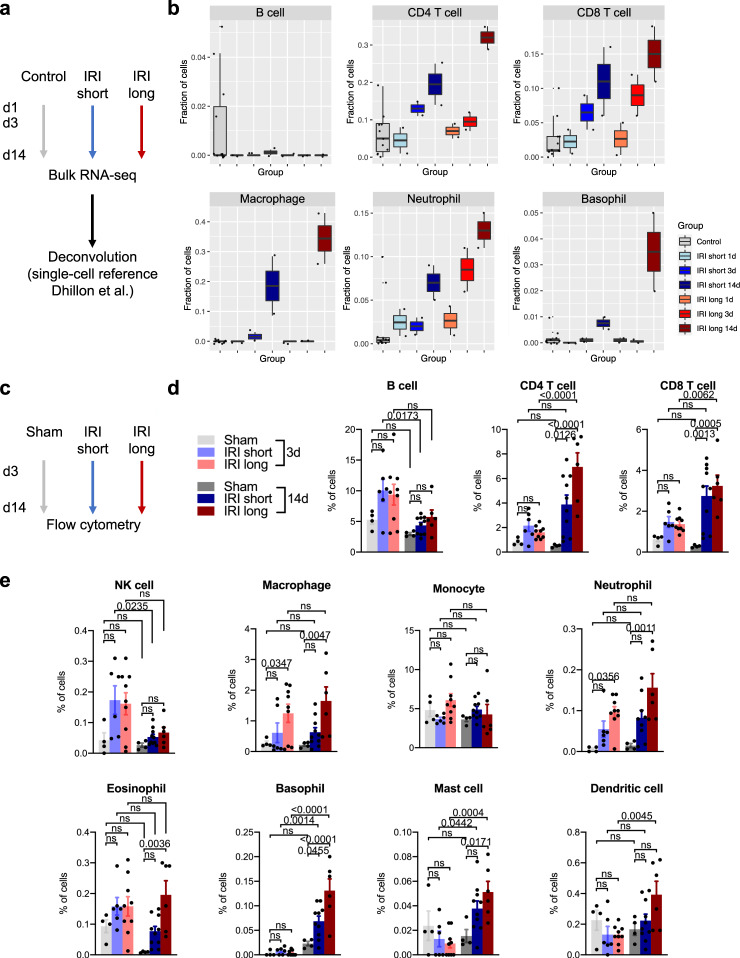
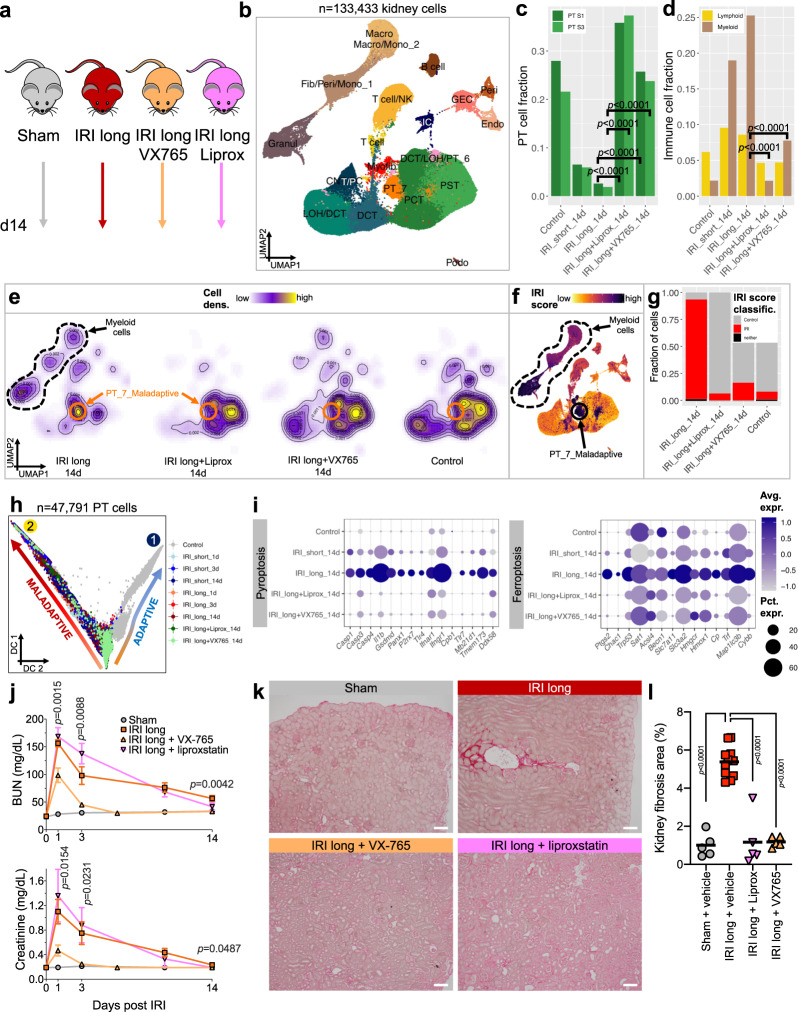
The kidney has tremendous capacity to repair after acute injury, however, pathways guiding adaptive and fibrotic repair are poorly understood. We developed a model of adaptive and fibrotic kidney regeneration by titrating ischemic injury dose. We performed detailed biochemical and histological analysis and profiled transcriptomic changes at bulk and single-cell level (> 110,000 cells) over time. Our analysis highlights kidney proximal tubule cells as key susceptible cells to injury. Adaptive proximal tubule repair correlated with fatty acid oxidation and oxidative phosphorylation. We identify a specific maladaptive/profibrotic proximal tubule cluster after long ischemia, which expresses proinflammatory and profibrotic cytokines and myeloid cell chemotactic factors. Druggability analysis highlights pyroptosis/ferroptosis as vulnerable pathways in these profibrotic cells. Pharmacological targeting of pyroptosis/ferroptosis in vivo pushed cells towards adaptive repair and ameliorates fibrosis. In summary, our single-cell analysis defines key differences in adaptive and fibrotic repair and identifies druggable pathways for pharmacological intervention to prevent kidney fibrosis.


Conflict of interest statement

The authors declare no competing interests.

Figures

Fig. 1
Fig. 1. Single-cell transcriptome dynamics of adaptive and maladaptive regeneration following bilateral renal ischemia.
a Experimental setup. Male C57BL/6 mice were subjected to short and long ischemia and followed for 1, 3 and 14 d (n = 12). Bulk and scRNA-seq was performed in n = 2 mice per condition and time point and compared to n = 6 controls; artwork own production and from https://smart.servier.com, license https://creativecommons.org/licenses/by-sa/3.0/). b Histopathological evidence of acute tubular injury (left panel), blood creatinine (middle panel) and BUN changes (right panel) 1, 3, and 14 d post-IRI. BUN of long IRI was comparable to previously published data (Kirita et al.); means ± SEM. Representative light microscopy of Periodic acid-Schiff (c) and Sirius red (d)-stained kidneys; scale bars = 50 µm. e Fibrosis quantification from (d); means ± SEM; p values are given for one-way ANOVA comparisons between Control and IRI groups and between short and long IRI groups, respectively. f Bulk RNA-seq analysis of fibrosis markers Fn1, Tgfb1, Col1a1, and Col3a1; means ± SEM; p values are given for one-way ANOVA comparisons between Control and IRI groups and between short and long IRI groups, respectively. g UMAP projection of 113,579 cells (n = 6 controls, n = 6 short, n = 6 long IRI samples) passing rigid quality control filtering (nFeatures > 200 and < 3000, mt% < 50, doublet removal) and after dataset integration with LIGER, yielding 18 cell clusters: GEC glomerular endothelial cell; Endo endothelial cell; Myofib myofibroblast; Podo podocyte; PT S1 proximal convoluted tubule; PT S3, proximal straight tubule; LOH, loop of Henle; DCT, distal convoluted tubule; PC, principal cell; IC, intercalated cell; Granul, granulocyte; Mono, monocyte; Macro, macrophage; T cell; B cell. h Cell type-specific expression of marker genes for manually annotated clusters. Dot size denotes percentage of cells expressing the marker. Color scale represents average gene expression values. i, j Fractions of PT (h) and immune cell (i) clusters stratified by treatment group (Control; IRI short; IRI long). Statistical significance for comparisons was derived using differential proportion analysis, with a mean error of 0.1 over 100,000 iterations; p values are given for comparisons between Control and IRI groups and between short and long IRI groups, respectively. k Changes in cell type proportions between treatment groups (Control; IRI short; IRI long), visualized as cell density.
Fig. 2
Fig. 2. Bulk deconvolution and flow cytometry confirm lymphoid and myeloid cell infiltration in maladapted kidneys.
a Kidney bulk RNA-seq data were in silico deconvoluted using a previously published kidney single cell reference that is known to be rich in heterogeneous immune cell populations (Dhillon et al.). b Quantification of cell fractions after bulk RNA-seq deconvolution, displayed as Tukey box plots. c Flow cytometry was performed in an independent set of experiments; the gating strategy is shown in Fig. S6. d, e Flow cytometry quantification of lymphoid (d) and myeloid (e) cells representing n = 4 independent experiments. Increasing doses of ischemic injury resulted in significant increases in lymphoid and myeloid cell infiltration; means ± SEM; p values for one-way ANOVA (Holm–Sidak corrected); light coloring in bar graphs denotes 3 d time points, full coloring denotes 14 d time points; NK, natural killer.
Fig. 3
Fig. 3. Profibrotic PT cells accumulate during maladaptive repair.
a UMAP projection of 28,385 PT cells, demonstrating 11 PT subclusters. Subclusters with a clear S1, S2, and S3 phenotype are annotated. b Corresponding dot plot showing PT subcluster-specific expression patterns of differentially expressed genes (DEGs). c Changes in cell type proportions of PT cells between different treatment groups (Control; IRI short; IRI long), visualized as cell density. Control and IRI short samples are dominated by healthy PT subclusters, IRI long samples by Maladaptive PT. d Fractions of Healthy, Maladaptive, and Injured PT cells stratified by ischemia dose and time post-IRI. Statistical significance for comparisons in n = 28,385 cells was derived using differential proportion analysis, with a mean error of 0.1 over 100,000 iterations; p values are given for comparisons between Control and IRI groups and between short and long IRI groups, respectively. e Fraction of cells annotated as Maladaptive PT after bulk kidney RNA-seq data cell type deconvolution using BisqueRNA, displayed as Tukey box plots. X-axis denotes the different treatment groups (Control, IRI short 1 d, IRI short 3 d, IRI short 14 d, IRI long 1 d, IRI long 3 d, IRI long 14 d). Corresponding results for the MuSiC deconvolution pipeline are shown in Fig. S8a. f Heatmap showing the expression of the top 100 differentially expressed genes (DEGs) from PT_7_Maladaptive in 16,267 PT cells from fibrotic mouse kidneys undergoing unilateral ureteric obstruction (UUO) highlights significant overlap with profibrotic (Profib) and immune phenotype clusters. Top DEGs are highlighted on the right. g Joint UMAP embedding after integration of all 113,579 kidney cells with the dataset from Kirita et al. (126,464 kidney cells). Labels and colors represent clustering as in Fig. 1f. Cells from Kirita et al. are labeled in gray. h Cells annotated as PT_7_Maladaptive are colored orange in the joint UMAP embedding. Note similar projection within the joint embedding space. Cluster labels as in Fig. 1f. i Heatmap showing the expression of the top 100 differentially expressed genes (DEGs) from PT_7_Maladaptive in 50,159 PT cells from Kirita et al. highlights significant overlap with injured clusters “NewPT1” and “NewPT2”. Top DEGs are highlighted on the right.
Fig. 4
Fig. 4. PT trajectories of adaptive and maladaptive repair.
a, b Slingshot-derived trajectories of 1,650 randomly sampled PT cells using Gaussian mixture modeling (GMM) yielded 5 clusters in 2 trajectories. GMM clusters (a) and treatment groups (b) demonstrated major overlap: Trajectory 1 represented adaptive repair of acutely injured cells 1 d post-ischemia (GMM4) towards endpoint clusters (GMM1&3) corresponding to control and short IRI 14 d samples. Trajectory 2 represented maladaptive repair of acutely injured cells (GMM4) towards fibroinflammation (GMM5). c RNA velocity analysis in the same 1650 PT cells recapitulated similar trajectories. Cells are colored by GMM clusters as in (a). d Steady IRI score increase along trajectory 2. e Heatmap showing generalized additive modeling (GAM)-derived differentially expressed genes (DEGs) along the 2 PT lineages following IRI. Rows represent DEGs, columns represent individual PT cells. Color legend at the top corresponds to GMM clusters from (a). The lineage 1 endpoint was exclusively from samples 14 d after short IRI and Controls, demonstrating increased expression of PT differentiation markers (e.g., Slc34a1, Acsm2). The lineage 2 endpoint was exclusively from samples 14 d after long IRI and showed increased inflammatory (e.g., Il1b, Cxcl2, S100a8, and S100a9) and stress marker (e.g., Junb, Fos) expression. f Heatmap of cell type-specific binarized regulon activity, as inferred by cis-regulatory network analysis using SCENIC. Rows represent regulon activity (binarized to “on” = black or “off” = white), columns represent individual PT cells. Color legend at the top displays GMM clusters. g Heatmap of PT subcluster-specific scaled regulon activity. Rows represent regulons, columns represent PT subclusters. h, i Gene expression and regulon activity of exemplary lineage-specific transcription factors (TFs) governing top specific regulons. h Pseudotime-dependent gene expression along the 2 PT lineages and corresponding feature plots. i Binarized regulon activity (blue = “on”, gray = “off”). Regulon activity and gene expression largely overlapped and demonstrated lineage-specific patterns. j Gene expression of Cebpb targets, as predicted by motif analysis, showed strong increases of proinflammatory genes such as Il1b and Nlrp3 along lineage 2. k tSNE reduction plot of GMM clusters showing good separation of trajectory-inferred clustering. l tSNE representation of regulon density as a surrogate for stability of regulon states.
Fig. 5
Fig. 5. Increase in pyroptosis and ferroptosis following sustained injury drives inflammation.
a Enrichment ratios of top enriched KEGG pathway terms, derived by overrepresentation analysis of DEGs in proximal tubule cells. The graph is split into subpanels by IRI degree (short and long, respectively) as well as by time point post ischemia (1, 3, and 14 d). b Dot plots showing experimental group-specific expression of genes in PT cells involved in regulated cell death pathways pyroptosis, ferroptosis, apoptosis, and necroptosis. Dot size denotes percentage of cells expressing the marker. Color scale represents average gene expression values.
Fig. 6
Fig. 6. WGCNA, in situ hybridization, and immunofluorescence confirm GSDMD as maladaptative repair-specific hub gene expressed in PT.
a UMAP visualizing PT cells colored by IRI degree and time post-ischemia. b UMAP visualizing PT metacells colored as in (a). c Hierarchical cluster tree showing gene co-expression modules identified by weighted correlation network analysis (WGCNA) in PT cells revealed 8 modules (color-coded). d Heatmap demonstrating high WGCNA module specificity among treatment groups stratified by IRI degree and time post-ischemia. e Module eigengene (ME) scores of black WGCNA module in n = 8777 metacells by IRI degree and time post-ischemia, displayed as Tukey box plots (outliers denoted as dots outside box plot whiskers). f Intramodular connectivity (kME) values for individual hub genes Gsdmd and Il1b show high specificity for black module. g, h kME values (g) and Gsdmd and Il1b expression (h) visualized in UMAP space. i In situ hybridization showing presence of Gsdmd mRNA in IRI long 14 d kidney tubules. j Immunofluorescence staining representative of n = 3 independent experiments of GSDMD (green) and PT marker SCL34A1 (red); scale bars = 50 µm.
Fig. 7
Fig. 7. Transcriptional atlas of immune cells in adaptive and maladaptive kidneys.
a Dot plots showing an increase of expression of genes corresponding to proinflammatory cell–cell interactions among myeloid cells after IRI. 14 d after long IRI, maladaptive PT adopts an immune cell phenotype. Dot size denotes percentage of cells expressing the marker. Color scale represents average gene expression values. Arrows indicate ligand–receptor pairs, as derived from CellPhoneDB. X denotes abrogated signaling. b Circos plots visualizing genes involved in ligand–receptor interaction between PT_7_Maladaptive and corresponding interaction partner cells (Granul_2). Color scale is proportional to interaction strength, as measured by CellPhoneDB interaction means of statistically significant interactions. Note that signaling is both between epithelium and myeloid cells as well as exclusively among epithelium. c UMAP projection of 45,327 immune cells. Clusters encompassed B cells, CD4 and CD8 T cells, regulatory and ɣδ T cells (Treg/gdT), natural killer T cells (NKT), natural killer (NK) cells, dendritic cells (DC), plasmacytoid DC (pDC), monocytes with high and low expression of Ly6C, respectively (Mono Ly6Clo, Mono Ly6Chi), PreT/proB precursor cells, macrophages (Macro), Granulocytes (Granul_1, Granul_2), a mixed phenotype cluster (Mixture), MHCII expressing stroma cells (Stroma MHCIIhi), and blood endothelial cells (Blood endo). d Dot plot showing cell type-specific expression patterns of marker genes. Dot size denotes percentage of cells expressing the marker. Color scale represents average gene expression values. e Changes in cell proportions of immune cell types between treatment groups are visualized as cell density. Cells from Control samples were most dense in T cell clusters, those from IRI short samples in Macro, Mono Ly6Chi, and Granul_1 clusters, and those from IRI long samples in the Granul_2 cluster. f Bar graph depicting the number of different immune cells (n = 45,327 total cells) according to treatment group (Control; IRI short; IRI long) and according to time point after ischemia (13, and 14 d). Statistical significance for comparisons between short and long IRI was derived using differential proportion analysis, with a mean error of 0.1 over 100,000 iterations; p values are given for time point comparisons between IRI short and long.
Fig. 8
Fig. 8. Druggability screen identifies pyroptosis and ferroptosis as key driver pathways for maladaptive repair.
a Experimental setup: Identifying candidate molecules for drug: Gene expression values were calculated from experiments in the LINCS database and used to select drugs that would up- or downregulate the genes identified as Maladaptive PT markers. b Gene set enrichment analysis (GSEA) plots of top 2 drug response patterns overlapping with pre-ranked maladaptive DEGs (“Methods”). c Corresponding leading edge analysis heatmap visualizing expression of core genes enriched in the respective top 24 drug response patterns overlapping with pre-ranked maladaptive DEGs. Il1b was among the genes upregulated most frequently and the drugs eliciting Il1b upregulation are listed in the corresponding table along with their target and whether they induce pyroptosis or not. d Correlation of pyroptosis (CASP1, NLRP3) and ferroptosis (ACSL4, CYBB) marker gene expression in microdissected human kidney tubules with fibrosis (top row) and eGFR (bottom row); error bands represent 95% confidence interval.
Fig. 9
Fig. 9. Pharmacological inhibition of pyroptosis and ferroptosis ameliorates maladaptive kidney response and fibrosis after severe IRI.
a Experimental setup. Male C57BL/6 mice were treated 30 min before and daily after long (30 min) bilateral renal ischemia with vehicle (IRI long), VX-765 (pyroptosis inhibition), or Liproxstatin (ferroptosis inhibition) for 14 d. Sham-operated animal served as controls; artwork own production and from https://smart.servier.com, license https://creativecommons.org/licenses/by-sa/3.0/). b UMAP projection of 133,433 cells of n = 6 controls, n = 6 IRI short, n = 6 IRI long, n = 1 IRI long+VX765, and n = 1 IRI long+Liprox samples passing rigid quality control filtering (nFeatures > 200 and < 3000, mt% < 50, doublet removal) and after dataset integration with LIGER. c, d Fractions of PT (c) and immune cell (d) clusters stratified by treatment. Statistical significance for comparisons was derived using differential proportion analysis, with a mean error of 0.1 over 100,000 iterations; p values are given for comparisons between inhibitor and vehicle-treated IRI long groups. e Highest cell densities in IRI long samples were among PT_7_Maladaptive and myeloid clusters, whereas inhibitor-treated and control samples showed highest cell densities in healthy PT clusters. f IRI scores were highest in myeloid and PT_7_Maladaptive clusters. g Fractions of IRI-classified cells were drastically reduced in inhibitor-treated and control samples. h Diffusion map dimensional reduction of Slingshot-derived cell trajectories of 47,791 PT cells using Gaussian mixture modeling (GMM) yielded 9 clusters in 2 trajectories. Trajectory 1 encompassed mostly IRI short and control samples, trajectory 2 encompassed long IRI samples. Inhibitor-treated samples were right at the junction between lineages 1 and 2. i Dot plots showing experimental group-specific expression of genes in PT cells involved in regulated cell death pathways pyroptosis and ferroptosis. Dot size denotes percentage of cells expressing the marker. Color scale represents average gene expression values. j Functional effects of pyroptosis and ferroptosis inhibition on long IRI. Blood urea nitrogen (BUN) and creatinine changes (right panel) 1, 3, and 14 d post-IRI; means ± SEM; p values are given for multiple t tests (Benjamini, Krieger, Yekuteli corrected) comparing IRI + VX-765 (n = 5) vs. IRI + vehicle (n = 11). IRI + Liprox (n = 5) vs. IRI + vehicle (n = 11) comparisons were non-significant; n = 3 independent experiments, n = 5 Sham samples. k Representative light microscopy of Sirius red-stained kidneys; scale bars = 50 µm. l Fibrosis quantification from (k); p values are given for one-way ANOVA (Holm–Sidak corrected).

References

    1. Jager KJ, et al. A single number for advocacy and communication-worldwide more than 850 million individuals have kidney diseases. Kidney Int. 2019;96:1048–1050. doi: 10.1016/j.kint.2019.07.012. - DOI - PubMed
    1. Chawla LS, Eggers PW, Star RA, Kimmel PL. Acute kidney injury and chronic kidney disease as interconnected syndromes. N. Engl. J. Med. 2014;371:58–66. doi: 10.1056/NEJMra1214243. - DOI - PMC - PubMed
    1. See EJ, et al. Long-term risk of adverse outcomes after acute kidney injury: A systematic review and meta-analysis of cohort studies using consensus definitions of exposure. Kidney Int. 2019;95:160–172. doi: 10.1016/j.kint.2018.08.036. - DOI - PubMed
    1. Sagrinati C, et al. Isolation and characterization of multipotent progenitor cells from the Bowman’s capsule of adult human kidneys. J. Am. Soc. Nephrol. 2006;17:2443–2456. doi: 10.1681/ASN.2006010089. - DOI - PubMed
    1. Oliver JA, et al. Proliferation and migration of label-retaining cells of the kidney papilla. J. Am. Soc. Nephrol. 2009;20:2315–2327. doi: 10.1681/ASN.2008111203. - DOI - PMC - PubMed

Publication types