. 2022 Oct;82(14):1389-1399.
doi: 10.1002/pros.24411. Epub 2022 Jul 12.

Increased cytokine gene expression and cognition risk associated with androgen deprivation therapy

Affiliations

Increased cytokine gene expression and cognition risk associated with androgen deprivation therapy

Shiv Verma et al. Prostate. 2022 Oct.

Abstract

Background: Androgen deprivation therapy (ADT) is a standard treatment modality for locally advanced, high-risk, and metastatic hormone-sensitive prostate cancer. Long-term ADT treatment likely develops side-effects that include changes in cognition or onset of dementia. However, the molecular understanding of this effect remains elusive. We attempt to establish a link between ADT and changes in cognitive function using patient databases and bioinformatics analyses.

Methods: Gene expression profiling was performed using RNA sequencing data from Alzheimer patient cohort and compared with the data from advanced-stage prostate cancer patients receiving neoadjuvant antiandrogen therapy. Differentially expressed genes (DEGs) were analyzed using the Ingenuity knowledge database.

Results: A total of 1952 DEGs in the Alzheimer patient cohort and 101 DEGs were identified in ADT treated prostate cancer patients. Comparing both data sets provided a subset of 33 commonly expressed genes involving cytokine-cytokine signaling with an over representation of cytokine-cytokine receptor interaction, inflammatory cytokines, signaling by interleukins together with alterations in the circulating lymphocyte repertoire, adaptive immune responses, regulation of cytokine production, and changes in T-cell subsets. Additionally, lipopolysaccharide, tumor necrosis factor, and toll-like receptors were identified as upstream transcriptional regulators of these pathways. The most commonly expressed genes viz. IL-17A, CCL2, IL-10, IL-6, IL-1RN, LIF/LIFR were further validated by quantitative RT-PCR exhibited higher expression in antiandrogen treated neuronal, glial, and androgen-responsive prostate cancer cells, compared to no-androgen antagonist treatment.

Conclusions: Our findings suggest that changes in cytokine signaling under the influence of ADT in prostate cancer patients may be linked with cognitive impairment presenting new avenues for diagnostic and therapeutic development in combating brain deficits.

Keywords: androgen deprivation therapy; antiandrogens; brain deficits; cognitive impairment; proinflammatory cytokines; prostate cancer.


Figures

Figure 1
Figure 1
Comparative analysis of RNA sequencing data. (A) IPA comparative module was explored to analyze the RNA sequencing data of differentially expressed genes of prostate cancer patients under ADT overlaid with Alzheimer/dementia patient database. (B) The identified 33 genes belong to the cytokines gene family along with growth factors genes differentially expressed and shared in both data sets. Data represented in log2 expression fold change. ADT, androgen deprivation therapy; IPA, ingenuity pathway analysis. [Color figure can be viewed at wileyonlinelibrary.com]
Figure 2
Figure 2
Quantitative real time‐PCR (qRT‐PCR) analysis of cytokines. qRT‐PCR was performed in cytokines which include LIFR, IL‐1RN, IL‐6, IL‐10, CCL2, LIF, and IL‐17A. (A) Prostate cancer cell lines C4‐2B and (B) LNCaP cells, and (C) brain glial M059K cells and (D) brain neural BT142 cells were treated with 20 µM enzalutamide for 24 h. X‐axis of the graph denotes relative expression values (log2) and Y‐axis denotes the cytokine's levels. Experiments were performed using three biological and three technical replicates. The expression of GAPDH and ACTB was used as internal control in the experiment. The error bars in the graph show standard deviation (+SD). ***p < 0.001, and **p < 0.05; ns, nonsignificant. [Color figure can be viewed at wileyonlinelibrary.com]
Figure 3
Figure 3
Cytokine gene expression in PRAD. Expression of cytokines LIFR, IL‐1RN, IL‐6, IL‐10, CCL2, LIF, and IL‐17A in aged (41−80 years) prostate cancer patients using UALCAN. Box‐whisker plots showing the expression of cytokines in prostate cancer patients (PRAD) in age‐wise manner. The expression of normal patients was compared to prostate cancer aged patients and analyzed statistically. The X‐axis represents patients' age and Y‐axis denoted gene expression value in transcript per million (TPM). ns, nonsignificant; PRAD, prostate adenocarcinoma. [Color figure can be viewed at wileyonlinelibrary.com]
Figure 4
Figure 4
The cBioPortal prostate cancer database. Cytokine expression in prostate cancer patients exposed to ADT. TCGA data—expression in log2 value of fragments per kilobase of exon per million (FPKM) mapped fragments of cytokines IL‐6, IL‐17A, IL‐17RA, CCL2, LIFR, IL‐10, IL‐1RN, and LIF in prostate cancer patient on ADT treatment. ADT, androgen deprivation therapy. [Color figure can be viewed at wileyonlinelibrary.com]
Figure 5
Figure 5
Heat map representation of cytokine gene expression in Alzheimer, dementia, and aging patients in different regions of brain which include frontal white matter and hypothalamus, temporal cortex, and parietal cortex. Z‐score was calculated and shown in colors, red color denotes high expression, blue color represents low level of expression, and white represent nil or zero expression. [Color figure can be viewed at wileyonlinelibrary.com]
Figure 6
Figure 6
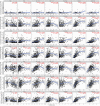
Cytokine and immune cell infiltration in PRAD (prostate adenocarcinoma); scatter plots were generated using with the tumor immune estimation resource gene module tool to identify the immune cell profiles associated with cytokines expression in PRAD. For each gene and respective immune cells correlation score was calculated along with p values. [Color figure can be viewed at wileyonlinelibrary.com]

References

    1. Crawford ED, Heidenreich A, Lawrentschuk N, et al. Androgen‐targeted therapy in men with prostate cancer: evolving practice and future considerations. Prostate Cancer Prostatic Dis. 2019;22(1):24‐38. - PMC - PubMed
    1. Gravis G, Boher JM, Joly F, et al. GETUG . Androgen deprivation therapy (ADT) plus docetaxel versus ADT alone in metastatic non castrate prostate cancer: impact of metastatic burden and long‐term survival analysis of the randomized phase 3 GETUG‐AFU15 trial. Eur Urol. 2016;70(2):256‐62. - PubMed
    1. Harris WP, Mostaghel EA, Nelson PS, Montgomery B. Androgen deprivation therapy: progress in understanding mechanisms of resistance and optimizing androgen depletion. Nat Clin Pract Urol. 2009;6(2):76‐85. - PMC - PubMed
    1. Joly F, Alibhai SM, Galica J, et al. Impact of androgen deprivation therapy on physical and cognitive function, as well as quality of life of patients with nonmetastatic prostate cancer. J Urol. 2006;176(6 pt 1):2443‐2447. - PubMed
    1. Cherrier MM, Cross DJ, Higano CS, Minoshima S. Changes in cerebral metabolic activity in men undergoing androgen deprivation therapy for non‐metastatic prostate cancer. Prostate Cancer Prostatic Dis. 2018;21(3):394‐402. - PMC - PubMed

Publication types