. 2022 Sep 7;30(9):3078-3094.
doi: 10.1016/j.ymthe.2022.07.007. Epub 2022 Jul 12.

mRNA-LNP vaccines tuned for systemic immunization induce strong antitumor immunity by engaging splenic immune cells

Affiliations

mRNA-LNP vaccines tuned for systemic immunization induce strong antitumor immunity by engaging splenic immune cells

Sanne Bevers et al. Mol Ther. .

Abstract

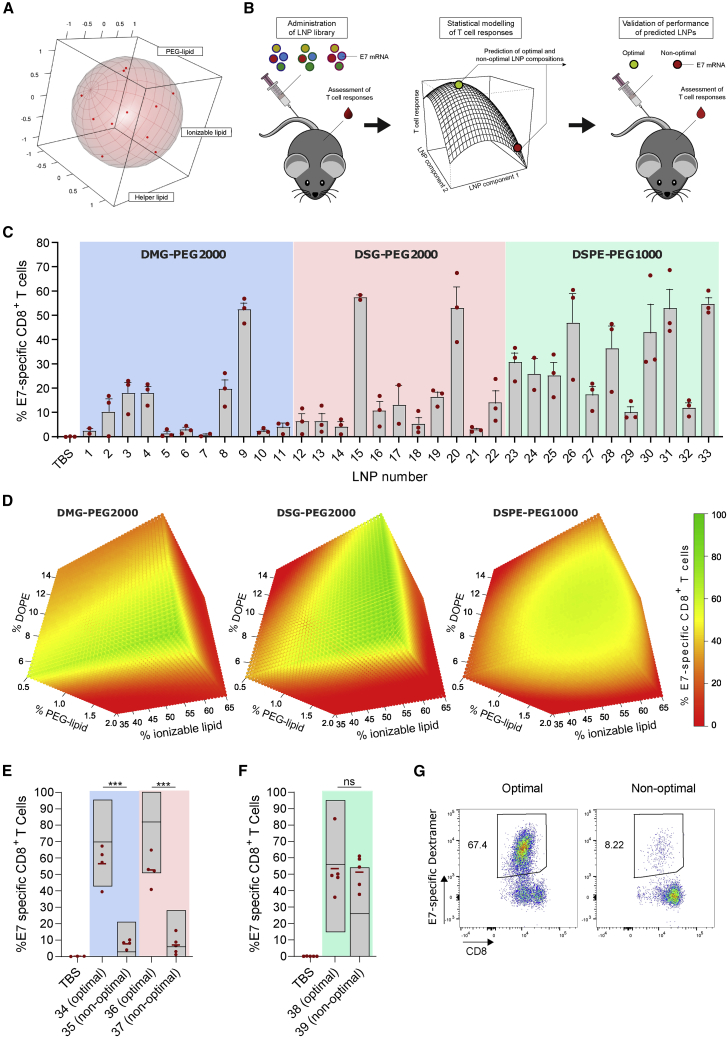
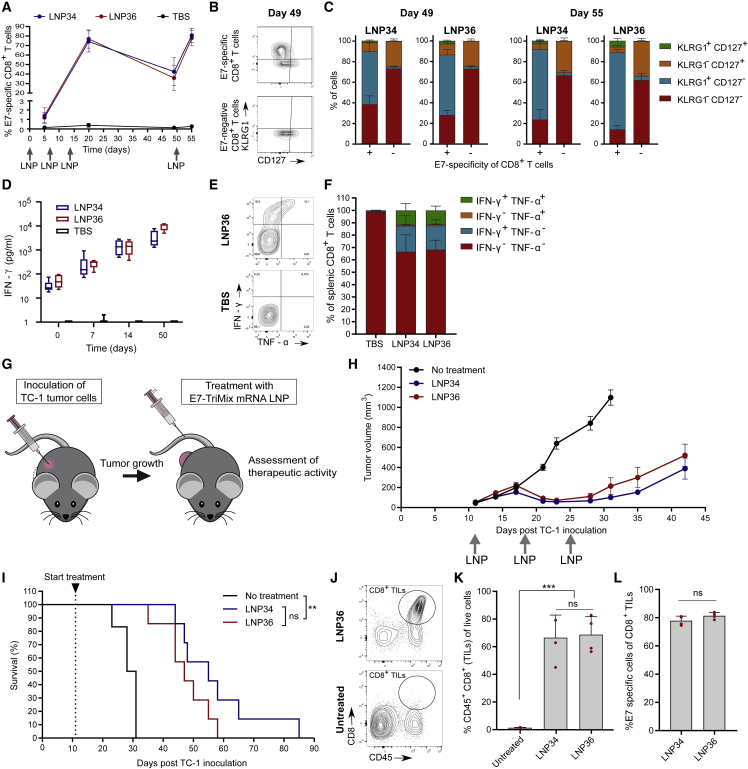
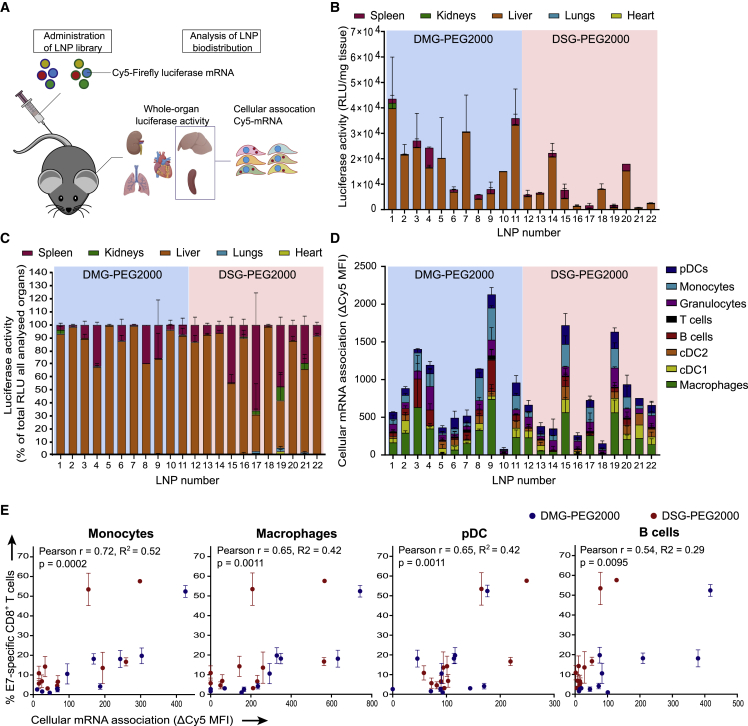
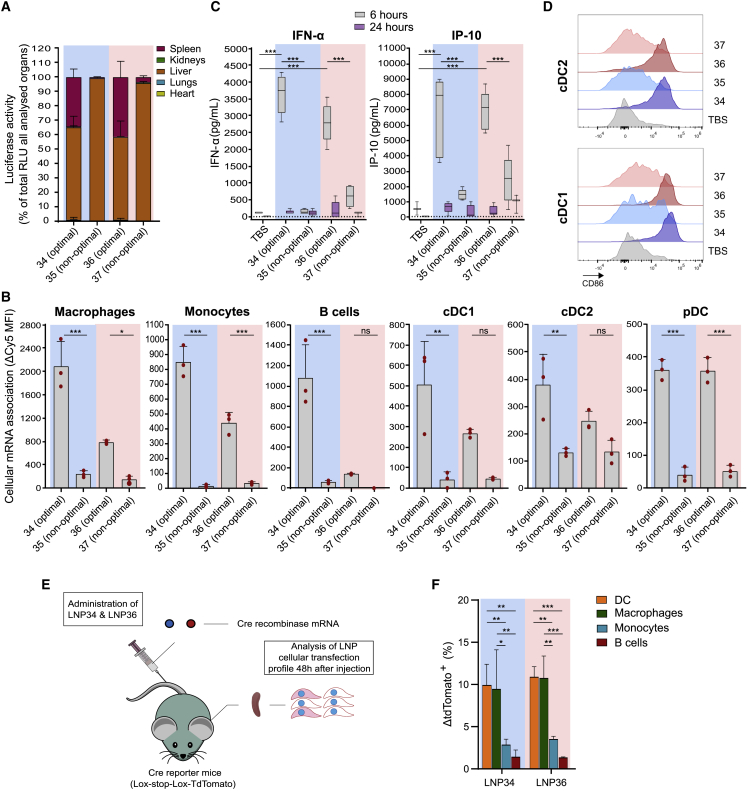
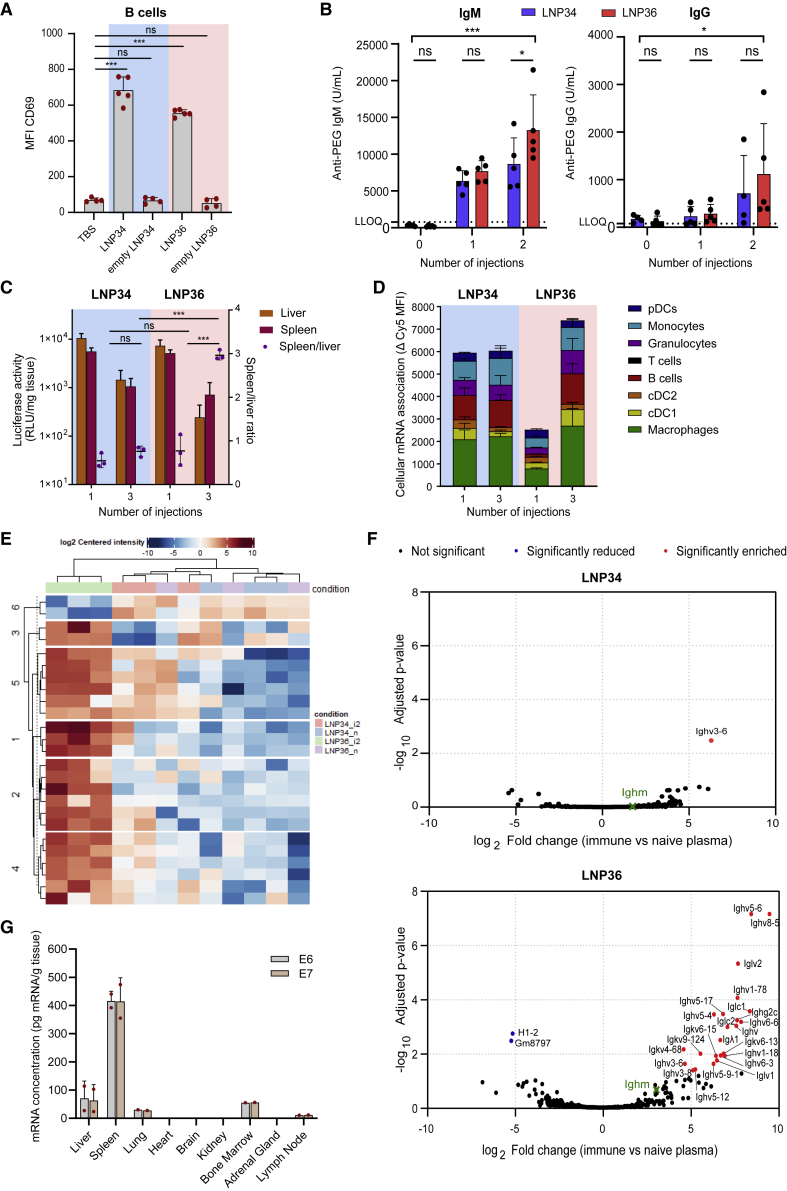
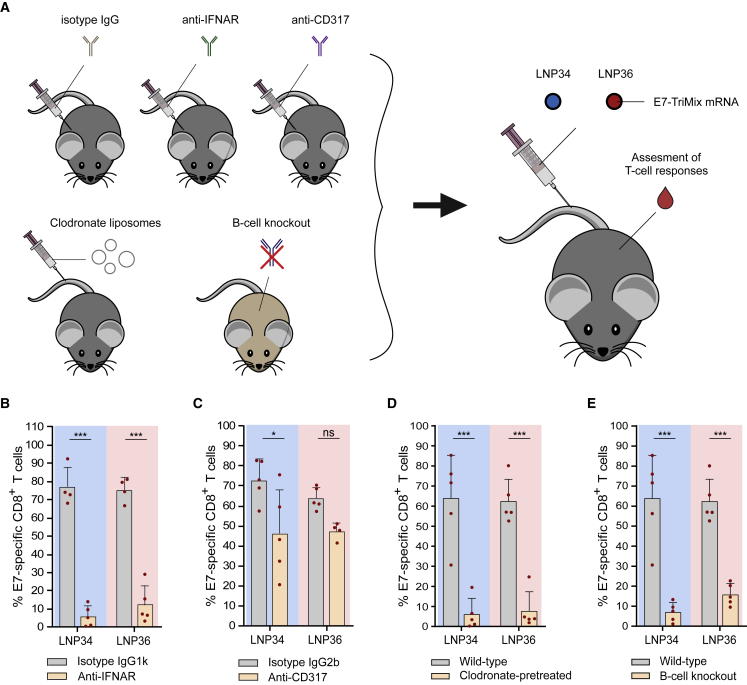
mRNA vaccines have recently proved to be highly effective against SARS-CoV-2. Key to their success is the lipid-based nanoparticle (LNP), which enables efficient mRNA expression and endows the vaccine with adjuvant properties that drive potent antibody responses. Effective cancer vaccines require long-lived, qualitative CD8 T cell responses instead of antibody responses. Systemic vaccination appears to be the most effective route, but necessitates adaptation of LNP composition to deliver mRNA to antigen-presenting cells. Using a design-of-experiments methodology, we tailored mRNA-LNP compositions to achieve high-magnitude tumor-specific CD8 T cell responses within a single round of optimization. Optimized LNP compositions resulted in enhanced mRNA uptake by multiple splenic immune cell populations. Type I interferon and phagocytes were found to be essential for the T cell response. Surprisingly, we also discovered a yet unidentified role of B cells in stimulating the vaccine-elicited CD8 T cell response. Optimized LNPs displayed a similar, spleen-centered biodistribution profile in non-human primates and did not trigger histopathological changes in liver and spleen, warranting their further assessment in clinical studies. Taken together, our study clarifies the relationship between nanoparticle composition and their T cell stimulatory capacity and provides novel insights into the underlying mechanisms of effective mRNA-LNP-based antitumor immunotherapy.

Keywords: LNP; cancer; design-of-experiments methodology; extrahepatic delivery; immunotherapy; mRNA; vaccination.


Conflict of interest statement

Declaration of interests S.B., E.V.d.V., S.S., M.M., D.V.H., and S.D.K. are employees of eTheRNA Immunotherapies NV. S.B., S.A.A.K., R.M.S., and S.D.K. have applied for patents related to this study.

Figures

Figure 1
Figure 1
LNP composition was optimized for maximal T cell responses using DOE methodology (A) Plot showing the uniform distribution of the 11 LNP compositions (with variable lipid ratios) over the experimental domain. An LNP library was prepared covering these 11 lipid ratios for three different PEG lipids (DMG-PEG2000, DSG-PEG2000, and DSPE-PEG1000), yielding a total of 33 LNPs. (B) Schematic representation of LNP optimization approach. (C) Percentage of E7-specific CD8 T cells in blood after three immunizations (weekly intervals, 10 μg of E7 mRNA) with the indicated mRNA-LNP compositions, as determined by MHC class I tetramer stain (n = 3). E7 mRNA was used as antigen of choice encoded by the mRNA. (D) Response surface plots modeled from the data in (C), showing LNP compositions with high (green) and low (red) predicted capacity to elicit CD8 T cell responses. (E and F) Percentage of E7-specific CD8 T cells in blood measured after three immunizations (weekly intervals, 10 μg of E7 mRNA) with predicted optimal and non-optimal DMG-PEG2000, DSG-PEG2000 (E), and DSPE-PEG1000 (F) LNPs. (G) Representative flow cytometry scatterplots of E7-specific CD8 T cells in blood after three immunizations (weekly intervals, 10 μg of E7 mRNA) with LNP34 (optimal) or LNP35 (non-optimal). In (C), (E), and (F), mean ± SD is shown with individual data points in red. In (E) and (F), statistics were assessed by one-way ANOVA with Sidak’s multiple comparison test. ∗∗∗p < 0.001; ns, not significant.
Figure 2
Figure 2
Optimal mRNA-LNPs induce qualitative T cell responses and strong antitumor efficacy (A) Mice were immunized with optimal LNPs encapsulating 5 μg of E7 and 5 μg of TriMix mRNA at days 0, 7, 14, and 50. Blood CD8 E7-specific T cell responses were determined at days 5, 20, 49, and 55. (B and C) Differential expression of KLRG1 and CD127 on blood E7-specific (+) and non-specific (−) CD8 T cells at day 49 and day 55. Representative contour plots (B, day 49) and quantification (C, mean ± SD [n = 4]) of KLRG1 and CD127 expression are shown. (D) IFN-γ levels in serum were measured 6 h after each immunization (n = 4–6). (E and F) IFN-γ and TNF-α expression by splenic CD8 T cells after three immunizations with TBS or mRNA-LNPs (weekly intervals, 10 μg of E7-TriMix). Representative contour plots (E) and quantification (F: mean ± SD [n = 3 for TBS, n = 5 for LNPs]) is shown. (G) When TC-1 tumors reached a mean volume of 52 mm3, mice were injected i.v. with 5 μg of E7-TriMix mRNA-LNPs (weekly intervals). (H) TC-1 growth curves in mice. Data are shown as mean ± SEM (n = 6–7). (I) Kaplan-Meier survival curves of TC-1-bearing mice. (J and K) Representative contour plots (J) and graph (K, mean ± SD [n = 4] with individual data points shown in red) quantifying the infiltration of CD8 T cells in TC-1 tumors. (L) E7 specificity of CD8 TILs in TC-1 tumors. Data are shown as mean ± SD with individual data points in red (n = 4). Statistical differences were assessed using a Mantel-Cox log-rank test with Bonferroni multiple testing correction (I), one-way ANOVA with Tukey post hoc test (J), or two-way Student’s t test (L).∗∗p < 0.01, ∗∗∗p < 0.001; ns, not significant.
Figure 3
Figure 3
LNP immunogenicity correlates with splenic immune cell association (A) A mixture of 5 μg Cy5-labeled (25% substituted Cy5-UTP, 75% substituted 5-methoxy UTP) and 5 μg unlabeled (and without nucleoside modifications) Fluc mRNA in LNPs was injected i.v. (n = 2–4). After 4 h, kidneys, lungs, heart, liver, and spleen were isolated. A part of spleens and livers was kept for immediate flow cytometry analysis to assess Cy5 association with multiple cell types. Remaining tissues were homogenized and assayed for luciferase activity. (B) Luciferase activity per mg of tissue. (C) Luciferase activity (expressed as percent of luciferase activity per mg in all assayed organs) was mainly localized in liver and spleen. (D) Association of Cy5-mRNA with immune cell types in the spleen, expressed as difference in Cy5 mean fluorescence intensity between cells of LNP-injected mice and vehicle-injected mice (ΔCy5 MFI). (E) Correlations of ΔCy5 MFI after first LNP administration with T cell response after three immunizations (Figure 1C) were strongest for monocytes, pDCs, macrophages, and B cells based on Pearson's correlation coefficients. In (B), (C), and (D), mean ± SD is shown. RLU, relative light unit.
Figure 4
Figure 4
Optimal LNPs show increased splenic immune cell transfection and activation compared with non-optimal LNPs (A) Fluc expression distribution over organs 4 h after injection of 10 μg of Fluc mRNA encapsulated in optimal (LNP34 and LNP36) or non-optimal LNPs (LNP35 and LNP37). Mean ± SD is shown (n = 3). (B) Association of optimal LNPs with various splenic immune cell subsets is stronger compared with non-optimal LNPs. Mean ± SD is shown with individual data points in red (n = 3). (C) Transient increases in IFN-α and IP-10 cytokine levels in serum were observed after injection of optimal, but not suboptimal LNPs (n = 5 for E7 LNPs [10 μg], n = 3 for TBS). (D) CD86 expression on splenic cDC1 and cDC2 is weakly upregulated by non-optimal LNPs and strongly upregulated by optimal LNPs (n = 5 for E7-TriMix LNPs [5 μg], n = 4 for TBS). (E) Cre mRNA (10 μg) in optimal LNPs was injected i.v. into transgenic Cre reporter mice (ROSA-loxP-STOP-loxP-tdTomato). After 48 h, spleens were isolated and assayed for tdTomato fluorescence in immune cell types. (F) In spleen, optimal LNPs mainly transfected DCs and macrophages, as indicated by the difference between the percentage of tdTomato-positive cells in LNP-injected mice and the average of TBS-injected mice for each cell population (ΔtdTomato+ (%)). Mean ± SD is shown (n = 3). In (B), (C), and (F) Statistics were assessed by one-way (B, C) or two-way (F) ANOVA with Sidak’s multiple comparison test. ∗p < 0.05, ∗∗p < 0.01, ∗∗∗p < 0.001; ns, not significant. RLU, relative light unit. Blue background: DMG-PEG2000-based LNPs, Pink background: DSG-PEG2000-based LNPs.
Figure 5
Figure 5
PEG-lipid chemistry differentially affects mRNA biodistribution upon repeated administration (A) mRNA-encapsulating LNPs (5 μg E7-TriMix), but not empty LNPs (equivalent lipids to hypothetical 5 μg mRNA), activate splenic B cells 4 h after a single administration, evidenced by upregulation of CD69. Mean ± SD is shown with individual data points in red (n = 4–5). Statistics were assessed by one-way ANOVA with Tukey’s multiple comparison test. (B) Mice were immunized with 10 μg of E7-TriMix on days 0 and 7. Anti-PEG IgM and IgG titers were determined in plasma collected 6 days after each injection. Both LNPs induce the generation of anti-PEG IgM (left) and IgG (right) upon systemic injection. Mean ± SD is shown (n = 5). (C) Overall luciferase expression decreases with repeated administration of LNP34 and LNP36 encapsulating 10 μg of Fluc mRNA. Mean ± SD is shown (n = 3). Statistics were assessed by one-way ANOVA with Tukey’s multiple comparison test. (D) Splenic cellular Cy5-mRNA association upon repeated administration (5 μg Fluc + 5 μg Cy5-Fluc) remains similar for LNP34, but increases in the case of LNP36. Mean ± SD is shown (n = 3). (E and F) Cluster analysis (E) and volcano plots (F) for differential enrichment (false discovery rate 5%, log2 fold change ≥1.5; padj < 0.05) of proteins in centrifuged pellets after incubation of LNP34 or LNP36 with plasma of naive mice or mice immunized twice with the respective LNP (10 μg E7-TriMix). LLOQ, lower limit of quantification. (G) After two immunizations with a 1:1 mixture of LNPs loaded with either E6 or E7 mRNA combined with TriMix (100 μg mRNA in total) in non-human primates, both mRNAs strongly accumulated in spleen. Mean ± SD is shown with individual data points in red (n = 2). Statistics in (D) were assessed by two-way ANOVA with Tukey’s multiple comparison test. ∗p < 0.05, ∗∗p < 0.01, ∗∗∗p < 0.001; ns, not significant.
Figure 6
Figure 6
CD8 T cell responses are dependent on IFNAR signaling, phagocytes, and B cells (A) Mice were pretreated with isotype antibodies, anti-CD317 pDC depleting antibody, anti-IFNAR blocking antibody, or clodronate liposomes. μMT mice were used as B cell knockout model. After two or three i.v. immunizations with 10 μg of E7-TriMix mRNA-LNP (weekly intervals), CD8 T cell responses were assessed in blood. (B) IFNAR blocking by i.p. administration of anti-IFNAR antibodies abrogated the E7-specific CD8 T cell response in blood after three immunizations. (C) Depletion of pDCs by i.p. administration of anti-CD317 antibodies had minor negative impact on the percentage of E7-specific CD8 T cells in blood after three immunizations. (D and E) Absence of phagocytes (clodronate-pretreated) (D) or B cells (knockout) (E) strongly reduced the percentage of E7-specific CD8 T cells in blood after two immunizations. In (B), (C), (D), and (E), mean ± SD is shown (n = 4–5). Statistics were assessed by two-way ANOVA with Sidak’s multiple comparison test. ∗p < 0.05, ∗∗∗p < 0.001; ns, not significant.

References

    1. Alameh M.-G.G., Tombácz I., Bettini E., Lederer K., Sittplangkoon C., Wilmore J.R., Gaudette B.T., Soliman O.Y., Pine M., Hicks P., et al. Lipid nanoparticles enhance the efficacy of mRNA and protein subunit vaccines by inducing robust T follicular helper cell and humoral responses. Immunity. 2021;54:2877–2892.e7. - PMC - PubMed
    1. Reichmuth A.M., Oberli M.A., Jeklenec A., Langer R., Blankschtein D. mRNA vaccine delivery using lipid nanoparticles. Ther. Deliv. 2016;7:319–334. - PMC - PubMed
    1. Cafri G., Gartner J.J., Zaks T., Hopson K., Levin N., Paria B.C., Parkhurst M.R., Yossef R., Lowery F.J., Jafferji M.S., et al. mRNA vaccine–induced neoantigen-specific T cell immunity in patients with gastrointestinal cancer. J. Clin. Invest. 2020;130:5976–5988. - PMC - PubMed
    1. Oberli M.A., Reichmuth A.M., Dorkin J.R., Mitchell M.J., Fenton O.S., Jaklenec A., Anderson D.G., Langer R., Blankschtein D. Lipid nanoparticle assisted mRNA delivery for potent cancer immunotherapy. Nano Lett. 2017;17:1326–1335. - PMC - PubMed
    1. Kranz L.M., Diken M., Haas H., Kreiter S., Loquai C., Reuter K.C., Meng M., Fritz D., Vascotto F., Hefesha H., et al. Systemic RNA delivery to dendritic cells exploits antiviral defence for cancer immunotherapy. Nature. 2016;534:396–401. - PubMed

Publication types