

A Randomized Controlled Clinical Trial in Healthy Older Adults to Determine Efficacy of Glycine and N-Acetylcysteine Supplementation on Glutathione Redox Status and Oxidative Damage
- PMID: 35821844
- PMCID: PMC9261343
- DOI: 10.3389/fragi.2022.852569
A Randomized Controlled Clinical Trial in Healthy Older Adults to Determine Efficacy of Glycine and N-Acetylcysteine Supplementation on Glutathione Redox Status and Oxidative Damage
Abstract
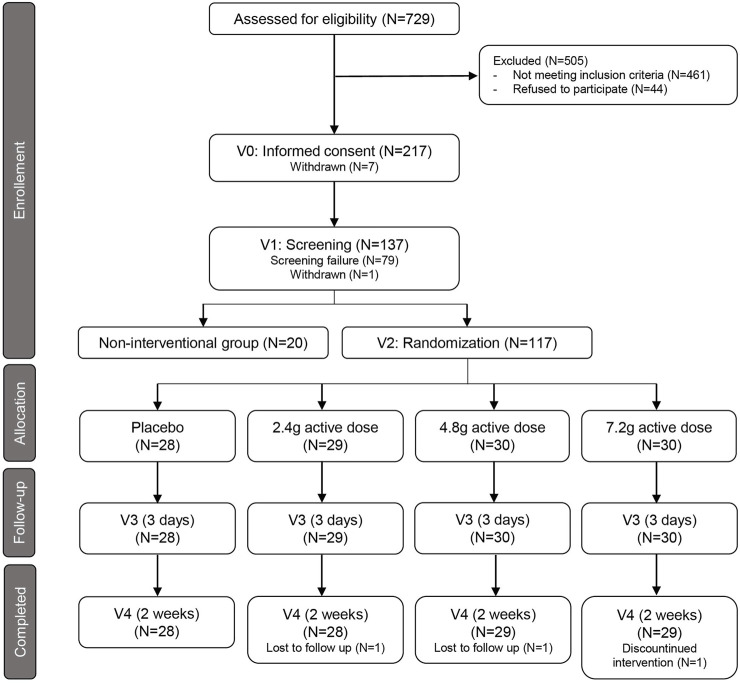
Glycine and cysteine are non-essential amino acids that are required to generate glutathione, an intracellular tripeptide that neutralizes reactive oxygen species and prevents tissue damage. During aging glutathione demand is thought to increase, but whether additional dietary intake of glycine and cysteine contributes towards the generation of glutathione in healthy older adults is not well understood. We investigated supplementation with glycine and n-acetylcysteine (GlyNAC) at three different daily doses for 2 weeks (low dose: 2.4 g, medium dose: 4.8 g, or high dose: 7.2 g/day, 1:1 ratio) in a randomized, controlled clinical trial in 114 healthy volunteers. Despite representing a cohort of healthy older adults (age mean = 65 years), we found significantly higher baseline levels of markers of oxidative stress, including that of malondialdehyde (MDA, 0.158 vs. 0.136 µmol/L, p < 0.0001), total cysteine (Cysteine-T, 314.8 vs. 276 µM, p < 0.0001), oxidized glutathione (GSSG, 174.5 vs. 132.3 µmol/L, p < 0.0001), and a lower ratio of reduced to oxidized glutathione (GSH-F:GSSG) (11.78 vs. 15.26, p = 0.0018) compared to a young reference group (age mean = 31.7 years, n = 20). GlyNAC supplementation was safe and well tolerated by the subjects, but did not increase levels of GSH-F:GSSG (end of study, placebo = 12.49 vs. 7.2 g = 12.65, p-value = 0.739) or that of total glutathione (GSH-T) (end of study, placebo = 903.5 vs. 7.2 g = 959.6 mg/L, p-value = 0.278), the primary endpoint of the study. Post-hoc analyses revealed that a subset of subjects characterized by high oxidative stress (above the median for MDA) and low baseline GSH-T status (below the median), who received the medium and high doses of GlyNAC, presented increased glutathione generation (end of study, placebo = 819.7 vs. 4.8g/7.2 g = 905.4 mg/L, p-value = 0.016). In summary GlyNAC supplementation is safe, well tolerated, and may increase glutathione levels in older adults with high glutathione demand. Clinical Trial Registration: https://clinicaltrials.gov/ct2/show/NCT05041179, NCT05041179.
Keywords: cardiometabolic diseases; glutathione; glycine; healthy aging; n-acetylcysteine; nutrition; oxidative stress; total cysteine.
Copyright © 2022 Lizzo, Migliavacca, Lamers, Frézal, Corthesy, Vinyes-Parès, Bosco, Karagounis, Hövelmann, Heise, von Eynatten and Gut.
Conflict of interest statement
GL, EM, AF, JC, NB, and PG are employees of Nestlé Institute of Health Sciences, Nestlé Research, Societé des Produits de Nestlé. GV-P, LK, and ME are employees of Nestlé Health Sciences, a subsidiary of Nestlé. Nestlé Health Sciences holds patents and licenses to patents and markets products for the use of glycine and n-acetylcysteine in conditions related to impaired mitochondrial functions. DL and UH are employees and TH is an employee and shareholder of Profil Institute for Metabolic Research GmbH, which has received research funding from Nestlé Health Sciences.
Figures


References
-
- Cruz M., Maldonado-Bernal C., Mondragón-Gonzalez R., Sanchez-Barrera R., Wacher N. H., Carvajal-Sandoval G., et al. (2008). Glycine Treatment Decreases Proinflammatory Cytokines and Increases Interferon-γ in Patients with Type 2 Diabetes. J. Endocrinol. Invest. 31, 694–699. 10.1007/bf03346417 - DOI - PubMed
Associated data
LinkOut - more resources
Full Text Sources
Medical