. 2021 Oct 27:2:708918.
doi: 10.3389/fragi.2021.708918. eCollection 2021.

Skeletal Muscle Adaptations to Exercise Training in Young and Aged Horses

Affiliations

Skeletal Muscle Adaptations to Exercise Training in Young and Aged Horses

Christine M Latham et al. Front Aging. .

Abstract

In aged humans, low-intensity exercise increases mitochondrial density, function and oxidative capacity, decreases the prevalence of hybrid fibers, and increases lean muscle mass, but these adaptations have not been studied in aged horses. Effects of age and exercise training on muscle fiber type and size, satellite cell abundance, and mitochondrial volume density (citrate synthase activity; CS), function (cytochrome c oxidase activity; CCO), and integrative (per mg tissue) and intrinsic (per unit CS) oxidative capacities were evaluated in skeletal muscle from aged (n = 9; 22 ± 5 yr) and yearling (n = 8; 9.7 ± 0.7 mo) horses. Muscle was collected from the gluteus medius (GM) and triceps brachii at wk 0, 8, and 12 of exercise training. Data were analyzed using linear models with age, training, muscle, and all interactions as fixed effects. At wk 0, aged horses exhibited a lower percentage of type IIx (p = 0.0006) and greater percentage of hybrid IIa/x fibers (p = 0.002) in the GM, less satellite cells per type II fiber (p = 0.03), lesser integrative and intrinsic (p 0.04) CCO activities, lesser integrative oxidative phosphorylation capacity with complex I (PCI; p = 0.02) and maximal electron transfer system capacity (ECI+II; p = 0.06), and greater intrinsic PCI, ECI+II, and electron transfer system capacity with complex II (ECII; p 0.05) than young horses. The percentage of type IIx fibers increased (p < 0.0001) and of type IIa/x fibers decreased (p = 0.001) in the GM, and the number of satellite cells per type II fiber increased (p = 0.0006) in aged horses following exercise training. Conversely, the percentage of type IIa/x fibers increased (p ≤ 0.01) and of type IIx fibers decreased (p ≤ 0.002) in young horses. Integrative maximal oxidative capacity (p ≤ 0.02), ECI+II (p ≤ 0.07), and ECII (p = 0.0003) increased for both age groups from wk 0 to 12. Following exercise training, aged horses had a greater percentage of IIx (p ≤ 0.002) and lesser percentage of IIa/x fibers (p ≤ 0.07), and more satellite cells per type II fiber (p = 0.08) than young horses, but sustained lesser integrative and intrinsic CCO activities (p 0.04) and greater intrinsic PCI, ECI+II, and ECII (p 0.05). Exercise improved mitochondrial measures in young and aged horses; however, aged horses showed impaired mitochondrial function and differences in adaptation to exercise training.

Keywords: aging; exercise; fiber type; horse; mitochondria; satellite cell.


Conflict of interest statement

The authors declare that the research was conducted in the absence of any commercial or financial relationships that could be construed as a potential conflict of interest.

Figures

FIGURE 1
FIGURE 1
Representative images of fluorescent staining of horse gluteus medius (GM) and triceps brachii (TB) myosin heavy chain (MyHC) type I using primary antibodies BA-D5 (A,G) and MAB1628 (E,K), MyHC type IIa using the primary antibody SC-71 (B,H), MyHC type IIx using the primary antibody 6H1 (C,I), a merged image of concurrently stained BA-D5, SC-71, and 6H1 (D,J), and MyHC type IIa and IIx using the primary antibody MHCf (F,L). Within a column, arrows point to the same fiber. Arrow, MyHC type I (pink); large arrowhead, MyHC IIa (green); asterisks indicate type IIa/x hybrid fibers. No pure MyHC IIx (yellow) fibers were noted in these sections. Scale bar, 100 µm.
FIGURE 2
FIGURE 2
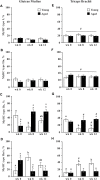
Gluteus medius and triceps brachii myosin heavy chain (MyHC) type I (A,E), type IIa (B,F), type IIx (C,G), and hybrid type IIa/x (D,H) percentage before (wk 0), and after 8 (wk 8) and 12 (wk 12) weeks of submaximal exercise training in aged (22 ± 4.5 yr; n = 10) and young (9.7 ± 0.7 mo; n = 8) horses. Overall effect of age (p = 0.3; p = 0.8; p = 0.0005; p = 0.02), training (p = 0.7; p = 0.99; p = 0.4; p = 0.12), muscle group (p < 0.0001; p < 0.0001; p = 0.001; p = 0.01), age × training (p = 0.5; p = 0.9; p < 0.0001; p < 0.0001), age × muscle group (p = 0.6; p = 0.12; p = 0.8; p = 0.4), training × muscle group (p = 0.32; p = 0.9; p = 0.02; p = 0.03), and age × training × muscle group (p = 0.5; p = 0.3; p = 0.02; p = 0.01) for MyHC type I, type IIa, type IIx, and type IIa/x, respectively. * Within a muscle group and week, aged differs from young (p < 0.05). # Within a week and age group, GM differs from TB (p < 0.05). a,b Within young horses and muscle group, time points with different letters differ (p < 0.05). x,y Within aged horses and muscle group, time points with different letters differ (p < 0.05).
FIGURE 3
FIGURE 3
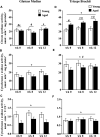
Gluteus medius and triceps brachii satellite cells per type I fiber (A), satellite cells per type II fiber (B), and percent of Pax7-positive nuclei (C) before (wk 0), and after 8 (wk 8) and 12 (wk 12) weeks of submaximal exercise training in aged (22 ± 4.5 yr; n = 10) and young (9.7 ± 0.7 mo; n = 8) horses. Owing to lack of effect of muscle group, muscle groups have been combined. Overall effect of age (p = 0.0009; p = 0.3; p = 0.8), training (p = 0.3; p = 0.4; p = 0.056), muscle group (p = 0.1; p = 0.6; p = 0.8), age × training (p = 0.2; p = 0.0007; p = 0.003), age × muscle group (p = 0.9; p = 0.9; p = 0.6), training × muscle group (p = 0.96; p = 0.6; p = 0.4), and age × training × muscle group (p = 0.14; p = 0.6; p = 0.5) for satellite cells per type I fiber, satellite cells per type II fiber, and percent of Pax7-positive nuclei, respectively. * Within time point, aged differs from young (p < 0.05). x,y Within aged horses, time points with different letters differ (p < 0.05).
FIGURE 4
FIGURE 4
Gluteus medius and triceps brachii citrate synthase (CS) activity (A,D), and integrative (per mg protein; B,E) and intrinsic (per unit CS; C,F) cytochrome c oxidase (CCO) activities before (wk 0), and after 8 (wk 8) and 12 (wk 12) weeks of submaximal exercise training in aged (22 ± 4.5 yr; n = 10) and young (9.7 ± 0.7 mo; n = 8) horses. Overall effect of age (p = 0.3; p = 0.04; p = 0.02), training (p = 0.01; p = 0.09; p = 0.13), muscle group (p = 0.0008; p < 0.0001; p = 0.93), age × training (p = 0.06; p = 0.3; p = 0.4), age × muscle group (p = 0.0007; p = 0.2; p = 0.14), training × muscle group (p = 0.02; p = 0.4; p = 0.6), and age × training × muscle group (p = 0.11; p = 0.96; p = 0.99) for CS activity, integrative CCO activity, and intrinsic CCO activity, respectively. * Within muscle group, aged differs from young (p < 0.05). # Within week, GM differs from TB (p < 0.05). d,e Within muscle group, time points with different letters differ (p < 0.05).
FIGURE 5
FIGURE 5
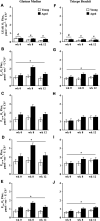
Integrative (mass-specific) mitochondrial respiration of permeabilized fibers from the gluteus medius and triceps brachii analyzed via high-resolution respirometry. LEAK respiration (LEAK; A,F), complex I-supported oxidative phosphorylation capacity (PCI; B,G), complex I and II-supported P (PCI+II; C,H), maximal noncoupled electron transfer system capacity (ECI+II; D,I), and complex II-supported E (ECII; E,J) were measured before (wk 0), and after 8 (wk 8) and 12 (wk 12) weeks of submaximal exercise training in aged (22 ± 4.5 yr; n = 10) and young (9.7 ± 0.7 mo; n = 8) horses. Overall effect of age (p = 0.0.002; p = 0.2; p = 0.2; p = 0.3; p = 0.6), training (p < 0.0001; p = 0.01; p = 0.003; p = 0.004; p = 0.0009), muscle group (p < 0.0001; p < 0.0001; p < 0.0001; p < 0.0001; p < 0.0001), age × training (p < 0.0001; p = 0.03; p = 0.10; p = 0.03; p = 0.13), age × muscle group (p = 0.01; p = 0.2; p = 0.2; p = 0.3; p = 0.2), training × muscle group (p = 0.13; p = 0.16; p = 0.6; p = 0.4; p = 0.8), and age × training × muscle group (p = 0.17; p = 0.19; p = 0.2; p = 0.2; p = 0.2) for LEAK, PCI, PCI+II, ECI+II, and ECII, respectively. * Within a muscle group and week, aged differs from young (p < 0.05). # GM differs from TB (p < 0.05). a,b Within young horses, time points with different letters differ (p < 0.05). x,y Within aged horses, time points with different letters differ (p < 0.05). d,e Within muscle group, time points with different letters differ (p < 0.05).
FIGURE 6
FIGURE 6
Intrinsic (normalized to CS activity) mitochondrial respiration of permeabilized fibers from the gluteus medius and triceps brachii analyzed via high-resolution respirometry. LEAK respiration (LEAK; A,F), complex I-supported oxidative phosphorylation capacity (PCI; B,G), complex I and II-supported P (PCI+II; C,H), maximal noncoupled electron transfer system capacity (ECI+II; D,I), and complex II-supported E (ECII; E,J) were measured before (wk 0), and after 8 (wk 8) and 12 (wk 12) weeks of submaximal exercise training in aged (22 ± 4.5 yr; n = 10) and young (9.7 ± 0.7 mo; n = 8) horses. Overall effect of age (p = 0.15; p = 0.05; p = 0.05; p = 0.04; p = 0.04), training (p = 0.0005; p = 0.056; p = 0.12; p = 0.10; p = 0.12), muscle group (p = 0.2; p = 0.5; p = 0.5; p = 0.3; p = 0.3), age × training (p = 0.06; p = 0.11; p = 0.2; p = 0.14; p = 0.2), age × muscle group (p = 0.7; p = 0.9; p = 0.99; p = 0.9; p = 0.8), training × muscle group (p = 0.3; p = 0.6; p = 0.5; p = 0.5; p = 0.4), and age × training × muscle group (p = 0.8; p = 0.9; p = 0.9; p = 0.9; p = 0.97) for LEAK, PCI, PCI+II, ECI+II, and ECII, respectively. * Aged differs from young (p < 0.05). d,e Time points with different letters differ (p < 0.05).
FIGURE 7
FIGURE 7
Flux control ratio (FCR) of permeabilized fibers from the gluteus medius and triceps brachii before (wk 0), and after 8 (wk 8) and 12 (wk 12) weeks of submaximal exercise training in aged (22 ± 4.5 yr; n = 10) and young (9.7 ± 0.7 mo; n = 8) horses. Contribution of LEAK respiration (LEAK; A,E), complex I-supported oxidative phosphorylation capacity (PCI; B,F), complex I and II-supported P (PCI+II; C,G), and complex II-supported electron transfer capacity (ECII; D,H) to maximal noncoupled E (ECI+II). Overall effect of age (p = 0.15; p = 0.05; p = 0.05; p = 0.04; p = 0.04), training (p = 0.0005; p = 0.056; p = 0.12; p = 0.10; p = 0.12), muscle group (p = 0.2; p = 0.5; p = 0.5; p = 0.3; p = 0.3), age × training (p = 0.06; p = 0.11; p = 0.2; p = 0.14; p = 0.2), age × muscle group (p = 0.7; p = 0.9; p = 0.99; p = 0.9; p = 0.8), training × muscle group (p = 0.3; p = 0.6; p = 0.5; p = 0.5; p = 0.4), and age × training × muscle group (p = 0.8; p = 0.9; p = 0.9; p = 0.9; p = 0.97) for FCRLEAK, FCRPCI, FCRPCI+II, and FCRECII, respectively. * Within week, aged differs from young (p < 0.05). # Within week, GM differs from TB (p < 0.05). a,b Within young horses, time points with different letters differ (p < 0.05). x,y Within aged horses, time points with different letters differ (p < 0.05). d,e Within muscle group, time points with different letters differ (p < 0.05).

Similar articles

Cited by

References

    1. Aagaard P., Suetta C., Caserotti P., Magnusson S. P., Kjaer M. (2010). Role of the Nervous System in Sarcopenia and Muscle Atrophy with Aging: Strength Training as a Countermeasure. Scand. J. Med. Sci. Sports 20, 49–64. 10.1111/j.1600-0838.2009.01084.x - DOI - PubMed
    1. Abreu P., Mendes S. V. D., Ceccatto V. M., Hirabara S. M. (2017). Satellite Cell Activation Induced by Aerobic Muscle Adaptation in Response to Endurance Exercise in Humans and Rodents. Life Sci. 170, 33–40. 10.1016/j.lfs.2016.11.016 - DOI - PubMed
    1. Adams G. R. (2006). Satellite Cell Proliferation and Skeletal Muscle Hypertrophy. Appl. Physiol. Nutr. Metab. 31, 782–790. 10.1139/h06-053 - DOI - PubMed
    1. Barrey E., Valette J. P., Jouglin M. (1998). Analyse de la composition en chaînes lourdes de myosine chez le cheval : application la sélection du cheval de course. INRA Prod. Anim. 11, 160–163. 10.20870/productions-animales.1998.11.2.3933 - DOI
    1. Bechtel P., Kline K. (1987). “Muscle Fiber Type Changes in the Middle Gluteal of Quarter and Standardbred Horses from Birth through One Year of Age,” in Proc. Int. Conf. Equine Exer. Phys., San Diego, CA, August 7–11, 1986 (Davis, CA: ICEEP Publications, 1987; ), 265–270.