

Genetically modified macrophages accelerate myelin repair
- PMID: 35822550
- PMCID: PMC9358396
- DOI: 10.15252/emmm.202114759
Genetically modified macrophages accelerate myelin repair
Abstract
Preventing neurodegeneration-associated disability progression in patients with multiple sclerosis (MS) remains an unmet therapeutic need. As remyelination prevents axonal degeneration, promoting this process in patients might enhance neuroprotection. In demyelinating mouse lesions, local overexpression of semaphorin 3F (Sema3F), an oligodendrocyte progenitor cell (OPC) attractant, increases remyelination. However, molecular targeting to MS lesions is a challenge. A clinically relevant paradigm for delivering Sema3F to demyelinating lesions could be to use blood-derived macrophages as vehicles. Thus, we chose transplantation of genetically modified hematopoietic stem cells (HSCs) as means of obtaining chimeric mice with circulating Sema3F-overexpressing monocytes. We demonstrated that Sema3F-transduced HSCs stimulate OPC migration in a neuropilin 2 (Nrp2, Sema3F receptor)-dependent fashion, which was conserved in middle-aged OPCs. While demyelinating lesions induced in mice with Sema3F-expressing blood cells showed no changes in inflammation and OPC survival, OPC recruitment was enhanced which accelerated the onset of remyelination. Our results provide a proof of concept that blood cells, particularly monocytes/macrophages, can be used to deliver pro-remyelinating agents "at the right time and place," suggesting novel means for remyelination-promoting strategies in MS.
Keywords: gene therapy; multiple sclerosis; oligodendrocyte progenitor cells; remyelination; semaphorin 3F.
© 2022 The Authors. Published under the terms of the CC BY 4.0 license.
Figures
- A
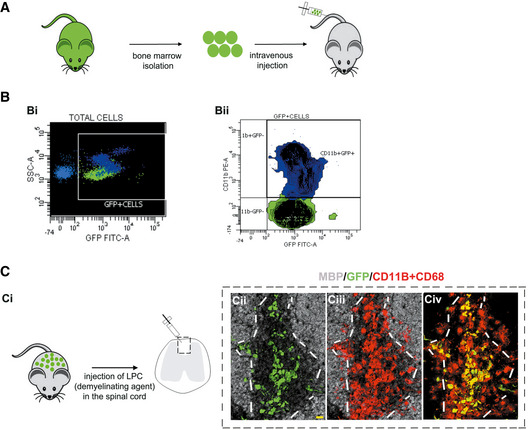
Bone marrow isolated from actin‐GFP mice was transplanted into preconditioned recipients.
- B
Flow cytometry analyses of recipient blood 2 months post‐transplant. (Bi) Transplanted cells detected by GFP fluorescence. (Bii) CD11b labeling shows a large proportion of monocytes expressing GFP.
- C
Demyelinating lesions in chimeric mice at 3 dpl. (Ci) Demyelination was induced by injecting LPC in the spinal cord white matter. (Cii–Civ) Co‐immunolabeling for GFP, MBP, and a mixture of CD11b/CD68, showing graft‐derived macrophages in the lesion (identified by lack of MBP staining). White lines indicate lesion borders. Scale bar 20 μm. MBP—myelin basic protein; GFP—green fluorescent protein.
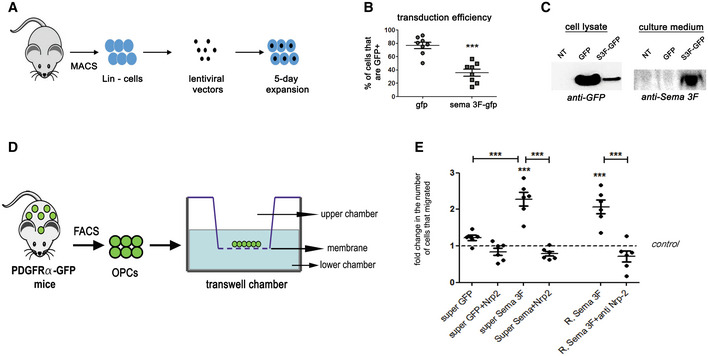
- A–C
Transduction of HSCs. (A) Mouse bone marrow was isolated and differentiated cells (Lin+) were removed using MACS. Non‐differentiated cells were transduced and expanded for 5 days. (B) Lower numbers of GFP+ cells, verified using flow cytometry, after transduction with Sema3F vector, ***P < 0.0001, Student's t‐test, n = 8 independent experiments. Mean ± SEM. (C) Western blot showing GFP expression in cells transduced with both vectors and Sema3F expression in the supernatant of Sema3F‐transduced cells only.
- D
OPCs isolated from adult PDGFRα‐GFP mice using FACS were subjected to transwell‐chamber migration assay in response to supernatants from non‐transduced (NT), GFP‐transduced (GFP), or Sema3F‐transduced (Sema3f‐GFP) HSCs.
- E
Fold increase in cells that crossed the membrane insert compared to NT. ***P < 0.0001. One‐way ANOVA followed by Bonferroni's multiple‐comparison test. n = 1–2 normalized replicates from 3 to 5 independent experiments. Mean ± SEM. ***P < 0.0001. R. = recombinant. Super = supernatant. Anti‐Nrp2 = Neuropilin2 function‐blocking antibody.
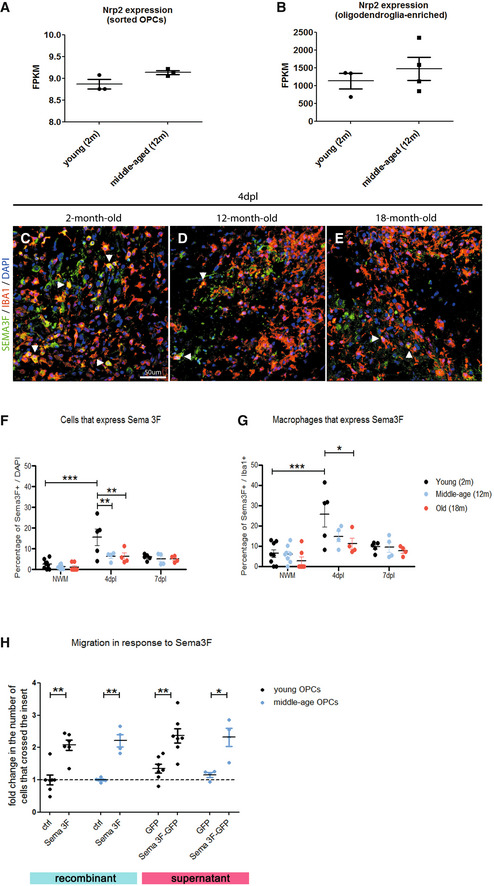
- A, B
Expression of Nrp2 gene by OPCs is maintained in middle‐age (12‐month (m)‐old) mice. (A) Microarray analyses results for Nrp2 expression by OPCs purified using FACS from the brains of 2‐month versus 12‐month‐old PDGFRα–GFP mice (n = 3–4 independent experiments). (B) RNA‐sequencing results for Nrp2 expression by oligodendroglia‐enriched preparations isolated from the spinal cords of 2‐month versus 12‐month old mice. (n = 3–4 independent experiments). Mean ± SEM.
- C–G
Sema3F expression in demyelinating lesions at 4 dpl (onset of OPC recruitment) is decreased in middle‐aged (12‐m‐old) and old (18‐m‐old) mice compared to young (2‐m‐old) mice. (C–E) Co‐labelings for Sema3F and Iba1 (macrophage marker) in demyelinating lesions at 4 dpl in 2‐m (C), 12‐m (D), and 18‐m‐old mice (E). Arrowheads point to double‐labeled cells. (F) Quantification of Sema3F‐expressing cells in the lesion. (G) Percentage of Iba1+ cells positive for Sema3F. NWM—normal white matter. Dpl—days post‐lesion. n = 4–8 mice/group. Mean ± SEM two‐way ANOVA followed by Tukey's multiple‐comparison test. *P < 0.05, **P < 0.01, ***P < 0.0001.
- H
Transwell chamber assay was used to evaluate migration of young versus middle‐age OPCs in response to recombinant Sema3F and supernatant from PGK‐GFP‐T2A‐Sema3F‐transduced cells. OPCs of both ages migrate in response to recombinant Sema3F‐ and PGK‐GFP‐T2A‐Sema3F‐transduced cell supernatant. n = 1–2 normalized replicates from 2 to 5 independent experiments. Mean ± SEM. One‐way ANOVA followed by Bonferroni's multiple‐comparison test. *P < 0.05, **P < 0.01. Scale bar 50 μm.
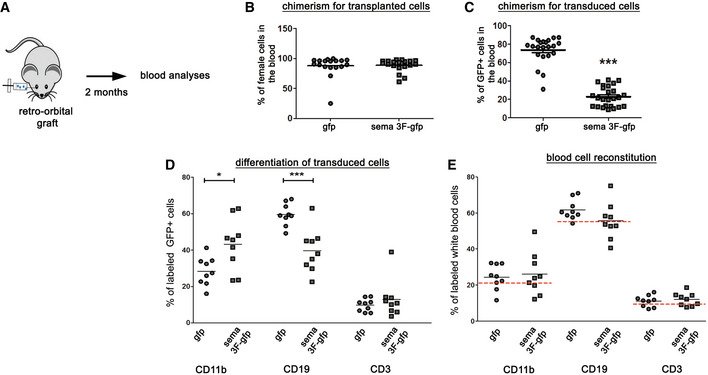
- A
Transduced female HSCs were injected retro‐orbitally into preconditioned male mice. Blood was analyzed 2 months post‐transplant.
- B
Percentage of transplanted (female) cells in the blood. n = 18–19 mice/group. Mean ± SEM.
- C
Percentage of transduced (GFP+) cells in the blood. Mean ± SEM. ***P < 0.0001. n = 22–25 mice/group.
- D
Percentages of GFP+ cells labeled with CD11b, CD19, and CD3. The proportion of GFP+ cells labeled with CD11b is increased in Sema3F mice (P = 0.01), while that of CD19‐labeled cells is decreased (P = 0.0003). Mean ± SEM. Unpaired Student's t‐test. n = 9 mice/group. *P < 0.05, ***P < 0.001.
- E
Percentages of total blood cells expressing CD11b, CD19, and CD3. Red dashed lines indicate the percentage expression of these antigens in blood cells of control mice. n = 9 mice/group. Mean ± SEM.
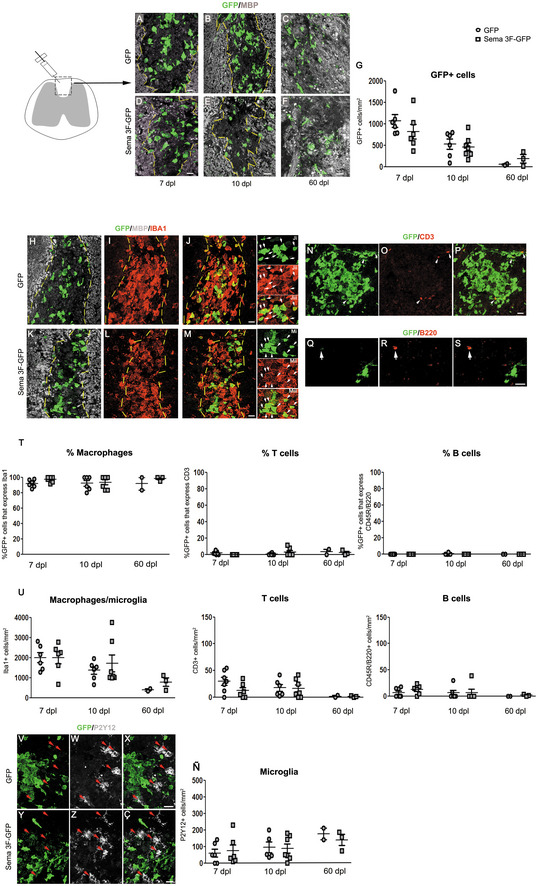
- A–F
Co‐labeling for GFP and MBP on spinal cord sections of GFP (A–C) and Sema3F‐GFP chimeras (D–F) sacrificed at 7 (A, D), 10 (B, E), and 60 (C, F) days post‐lesion (dpl). The absence of MBP labeling in A–B and D–E indicates the lesion (delimited by yellow lines). Areas faintly labeled with MBP in C–F likely represent remyelinated areas.
- G
Quantification of GFP+ cells. Kruskal–Wallis test P = 0.02. No significant differences between GFP and Sema3F at any of the time points (Dunn's post‐test; Mann–Whitney test). Decrease in GFP+ cells between 7 and 60 dpl for both GFP and Sema3F mice 2 m.
- H–M
Co‐labeling for GFP/MBP/Iba1 (macrophage/microglia marker) shows co‐localization of GFP with Iba1. Arrows indicate double‐labeled cells.
- N–P
Co‐labeling for GFP and T‐cell marker CD3. Arrows indicate CD3‐labeled cells.
- Q–S
Co‐labeling for GFP and B‐cell marker CD45R/B220. Arrows indicate CD45R/B220‐labeled cells.
- T
Percentages of GFP+ cells that are Iba1+, CD3+, and CD45R/B220+. The absolute majority of GFP+ cells are Iba1+.
- U
Quantification of Iba1+, CD3+, and B220+ cells. For all three populations, no significant differences in cell numbers were observed between GFP and Sema3F mice, and a general decrease was observed at 60 dpl compared to earlier time points.
- V–Ç
Co‐labeling for GFP and microglial marker P2Y12. Red arrows indicate P2Y12+ cells. Exclusion between the two markers is obvious in both groups.
- Ñ
Quantification of P2Y12+ cells. No significant changes are observed between the groups or across the time.
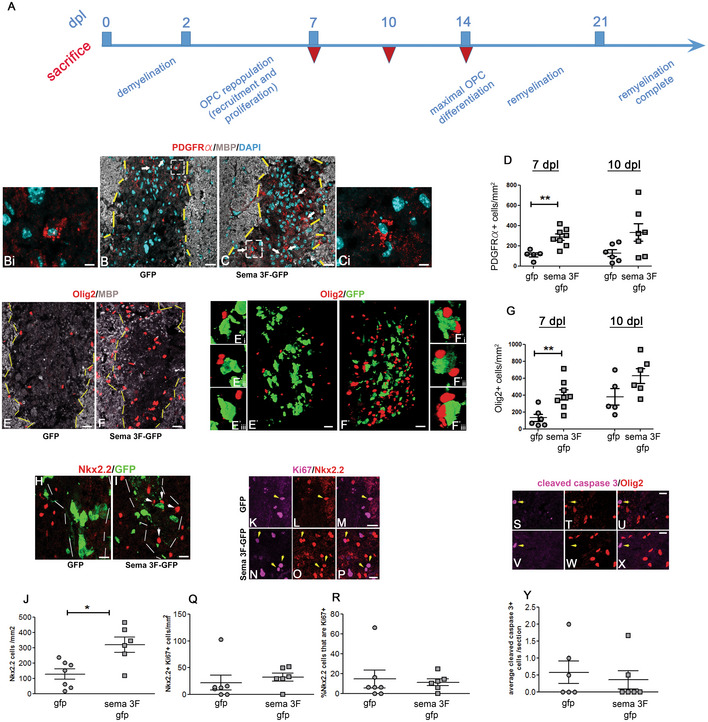
- A
Temporal sequence of events in LPC lesion. Dpl days post‐lesion. Red inverted triangles indicate sacrifice.
- B–G
Lesions at 7 dpl in GFP (B, E) and Sema3F (C, F) mice. (B–C) Co‐labeling for PDGFRα, MBP, and DAPI. Arrows indicate OPCs in the lesion. Bi and Ci insets of white dotted squares in (B and C). (D) Higher numbers of PDGFRα+ (OPCs) cells in Sema3F mice at 7 dpl (Mann Whitney test: P = 0.0031, n = 6–8 mice/group). (E, F) Co‐labeling for Olig2 and MBP. (E′–F′) Co‐labeling for Olig2 and GFP of the lesions shown in (E–F). 3D reconstructions. Proximity of OPCs and Sema3F‐carrying cells. E'i‐E'iii and F'i‐F'iii insets of E′–F′. (G) Higher numbers of Olig2+ (oligodendroglial) cells in Sema3F‐GFP mice at 7 dpl (Mann–Whitney test: P = 0.0047, n = 5–8 mice/group). **P < 0.01.
- H, I
Immunolabeling for activated OPC marker Nkx2.2.
- J
Numbers of Nkx2.2+ cells are increased in lesions of Sema3F‐GFP mice at 7dpl (Mann–Whitney test: P = 0.014, n = 6–7 mice/group). Arrows indicate Nkx2.2+ cells in close proximity to GFP+ cells. Mean ± SEM. *P < 0.05.
- K–P
Co‐labeling for Nkx2.2 and proliferation marker Ki67. Arrows indicate double‐labeled cells. Q. Numbers of Nkx2.2+Ki67+ cells are increased at 7 dpl in Sema3F‐GFP mice. Mean ± SEM. n = 6–7 mice/group.
- R
The proportion of Nkx2.2+ cells co‐expressing Ki67 is unchanged. Mean ± SEM. n = 6–7 mice/group.
- S–X
Co‐labeling for Olig2 and cleaved caspase 3; marker of apoptosis indicates occasional apoptotic cells in both groups of mice that are Olig2 − . Arrows indicate cleaved caspase 3+ cells.
- Y
Numbers of cleaved caspase 3+ cells are the same in the two groups. Mean ± SEM. n = 6 mice/group.
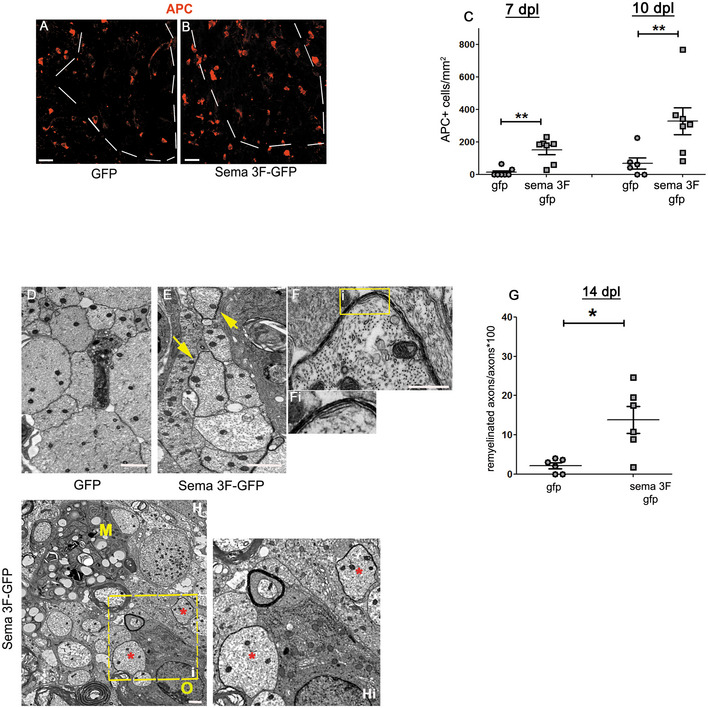
- A, B
Labeling for APC/CC1, a marker of oligodendrocytes. Dotted lines indicate the lesion border. APC+ cells are scarce in the lesions of GFP mice (A). B. APC+ cells in the lesion of Sema3F mice.
- C
Quantification of APC+ cells (Mann–Whitney test; P = 0.0061 for 7 dpl, P = 0.0081 for 10 dpl; n = 6–7 mice/group). *P < 0.01.
- D, E
EM images of the lesion in GFP (D) and Sema3F (E) chimeras at 14 dpl. Thin myelin sheaths in Sema3F mice (yellow arrows).
- F
Higher power image of a new myelin sheath in a Sema3F mouse. Fi. Inset of yellow square in (F).
- G
Quantification of remyelinated axons (Mann–Whitney test: P = 0.03, n = 6 mice/group). *P < 0.05.
- H
In Sema3F mice, oligodendroglial cells (O) and early remyelination (*) are frequently observed in macrophage (M) vicinity. Hi. Inset of yellow dashed square in (H).
References
-
- Biffi A, De Palma M, Quattrini A, Del Carro U, Amadio S, Visigalli I, Sessa M, Fasano S, Brambilla R, Marchesini S et al (2004) Correction of metachromatic leukodystrophy in the mouse model by transplantation of genetically modified hematopoietic stem cells. J Clin Invest 113: 1118–1129 - PMC - PubMed
-
- Biffi A, Montini E, Lorioli L, Cesani M, Fumagalli F, Plati T, Baldoli C, Martino S, Calabria A, Canale S et al (2013) Lentiviral hematopoietic stem cell gene therapy benefits metachromatic leukodystrophy. Science 341: 1233158 - PubMed
Publication types
MeSH terms
Associated data
- Actions
LinkOut - more resources
Full Text Sources
Medical
Molecular Biology Databases
Research Materials
Miscellaneous
