. 2022 Nov 28;190(4):2671-2687.
doi: 10.1093/plphys/kiac336.

KARRIKIN UPREGULATED F-BOX 1 negatively regulates drought tolerance in Arabidopsis

Affiliations

KARRIKIN UPREGULATED F-BOX 1 negatively regulates drought tolerance in Arabidopsis

Hongtao Tian et al. Plant Physiol. .

Abstract

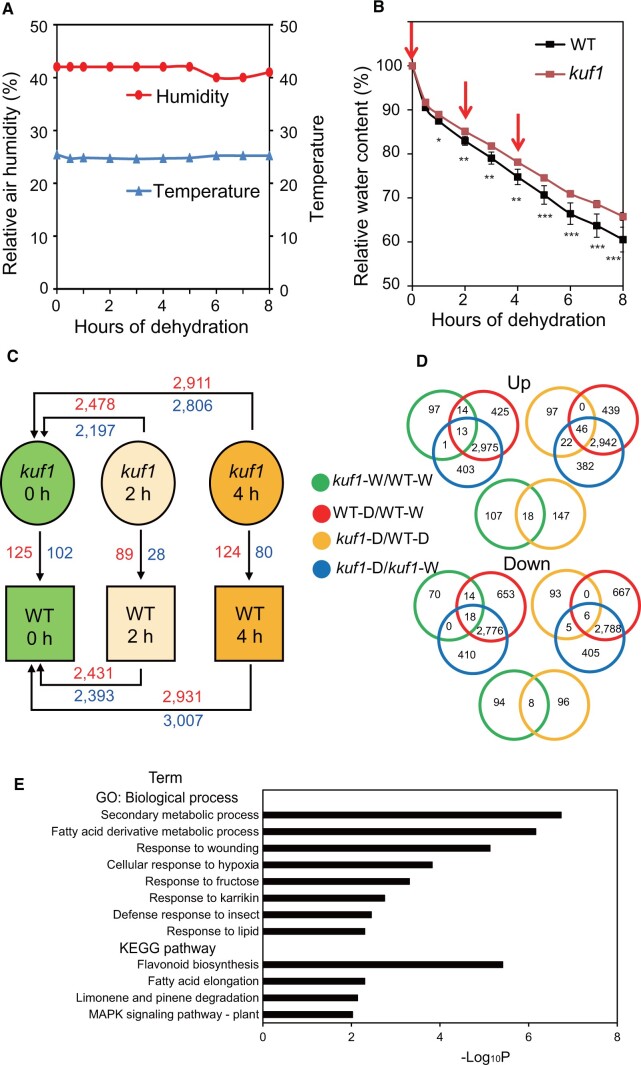
The karrikin (KAR) receptor and several related signaling components have been identified by forward genetic screening, but only a few studies have reported on upstream and downstream KAR signaling components and their roles in drought tolerance. Here, we characterized the functions of KAR UPREGULATED F-BOX 1 (KUF1) in drought tolerance using a reverse genetics approach in Arabidopsis (Arabidopsis thaliana). We observed that kuf1 mutant plants were more tolerant to drought stress than wild-type (WT) plants. To clarify the mechanisms by which KUF1 negatively regulates drought tolerance, we performed physiological, transcriptome, and morphological analyses. We found that kuf1 plants limited leaf water loss by reducing stomatal aperture and cuticular permeability. In addition, kuf1 plants showed increased sensitivity of stomatal closure, seed germination, primary root growth, and leaf senescence to abscisic acid (ABA). Genome-wide transcriptome comparisons of kuf1 and WT rosette leaves before and after dehydration showed that the differences in various drought tolerance-related traits were accompanied by differences in the expression of genes associated with stomatal closure (e.g. OPEN STOMATA 1), lipid and fatty acid metabolism (e.g. WAX ESTER SYNTHASE), and ABA responsiveness (e.g. ABA-RESPONSIVE ELEMENT 3). The kuf1 mutant plants had higher root/shoot ratios and root hair densities than WT plants, suggesting that they could absorb more water than WT plants. Together, these results demonstrate that KUF1 negatively regulates drought tolerance by modulating various physiological traits, morphological adjustments, and ABA responses and that the genetic manipulation of KUF1 in crops is a potential means of enhancing their drought tolerance.


Figures

Figure 1
Figure 1
Drought tolerance of different genotypes under severe and moderate drought stresses. A, Survival rates of WT and kuf1 plants under severe drought were assessed by the “same tray method.” WT and kuf1 plants were grown in pairs for 3 weeks under well-watered conditions (Before drought), and water was then withheld until visible differences in wilting of stem bases were observed between the genotypes (Drought + re-watered). Well-watered control plants were grown at the same time (Well-watered). Survival rates of the tested genotypes after drought and re-watering are shown at right. Data are means ± SDs of three independent experiments (n =3, 30 plants/genotype/experiment). Asterisks indicate significant differences between the two genotypes (***P <0.001; Student’s t test). B, Pot weights of WT, kuf1, and two complementation lines under moderate drought (n =12 biological replicates). C and D, Biomass accumulation (C) and biomass reduction percentages (D) of WT, kuf1, and two complementation lines (KUF1 8-5 and KUF1 19-8) under moderate drought and well-watered conditions were measured by the “gravimetric method.” Data are means ± SDs (n =15 biological replicates). Different alphabet letters indicate significant differences among the genotypes (P <0.05; Tukey’s honestly significant difference test).
Figure 2
Figure 2
Leaf surface temperatures and stomatal apertures of WT and kuf1 plants. A, Leaf surface temperatures of 24-d-old, soil-grown WT and kuf1 plants (24 plants/genotype) grown in well-watered soil. Optical (Left) and thermal imaging (Right) pictures were taken at the same time. B and C, Stomatal aperture sizes of leaves from WT and kuf1 plants under well-watered conditions. Representative guard cell pictures taken within 5 min after the epidermal strips being peeled from leaves and incubated in water (B), and stomatal aperture size data (C) from the abaxial side of rosette leaves of WT and kuf1 plants. Data are means ± SDs (n =10, average stomatal aperture from each of 10 leaves was determined using 20 randomly selected stomata from each leaf). Asterisks indicate significant differences between the genotypes (**P <0.01; Student’s t test). D and E, Stomatal closure response of WT and kuf1 plants to ABA. Representative guard cell pictures taken within 2 h after the peeled epidermal strips being incubated in buffer solution containing 0 (H2O) or 30 μM of ABA (D), and stomatal aperture size data (E) from the abaxial side of rosette leaves of WT and kuf1 plants (D). Data are means ± SDs (n =10, average stomatal aperture from each of 10 leaves was determined using 20 randomly selected stomata from each leaf). Different alphabet letters indicate significant differences between the two genotypes in all treatments (P <0.05; Tukey’s honestly significant difference test).
Figure 3
Figure 3
Seed germination, primary root length, and chlorophyll levels of WT and kuf1 plants in response to ABA. A, Seed germination percentages for WT and kuf1 mutant in the absence (0 μM) and presence (0.5, 1, and 2 μM) of ABA. Data are mean ± SDs (n =3, 50 seeds/genotype/experiment). Asterisks indicate significant differences between the genotypes (*P <0.05; **P <0.01; ***P <0.001; Student’s t test). B, Primary root length of 11-d-old WT and kuf1 mutant seedlings grown in media containing 0 and 1 μM ABA for 7 d. Data are means ± SDs (n =8). C and D, Chlorophyll levels (C) and relative chlorophyll levels (D) of 19-d-old shoots from WT and kuf1 mutant seedlings grown in media containing 0 and 1 μM ABA for 15 d. Data are means ± SDs (n =5). Different alphabet letters indicate significant differences between the genotypes in all treatments (P <0.05; Tukey’s honestly significant difference test).
Figure 4
Figure 4
Comparative transcriptome analysis of kuf1 and WT plants under well-watered and dehydrated conditions. A, Room temperature and relative air humidity during the dehydration treatment. B, Relative water contents of leaves from 24-d-old WT and kuf1 plants. Data are means ± SDs (n =4 plants/genotype). Asterisks indicate significant differences between the genotypes (*P <0.05; **P <0.01; ***P <0.001; Student’s t test). Red arrows indicate sampling time points. C, Summary of differential gene expression data for kuf1 versus WT plants before and after dehydration treatments. Shoot tissues were used in the transcriptome analysis. Numbers indicate the numbers of DEGs for different comparisons; red indicates upregulation, and blue indicates downregulation. D, Venn diagrams showing the common and unique DEGs from different comparisons. kuf1-W/WT-W, kuf1 well-watered 0 h versus WT well-watered 0 h; WT-D/WT-W, WT dehydrated 2 h and/or 4 h versus WT well-watered 0 h; kuf1-D/WT-D, kuf1 dehydrated 2 h versus WT dehydrated 2 h and/or kuf1 dehydrated 4 h versus WT dehydrated 4 h; kuf1-D/kuf1-W, kuf1 dehydrated 2 h and/or 4 h versus kuf1 well-watered 0 h. E, Top 12 enriched terms/pathways of the DEGs identified from kuf1-D/WT-D. The DEGs were classified based on enrichment analysis of GO biological process terms and KEGG pathways. The horizontal axis shows the cumulative hypergeometric P-values of genes mapped to the terms/pathways and represents the abundance of the GO terms and KEGG pathways.
Figure 5
Figure 5
Cuticle permeability of rosette leaves and epicuticular wax accumulation on stems and siliques of WT and kuf1 plants grown under low humidity (40%–50%). A and B, Rosette leaves of plants grown in soil for 24 d were stained with toluidine blue for 4 h. C, Chlorophyll leaching percentages from rosette leaves of plants grown in soil for 24 d and measured at different time points. Data are means ± SDs (n =5 plants/genotype). Asterisks indicate significant differences between WT and kuf1 mutant plants (*P <0.05, **P <0.01; Student’s t test). D, Scanning electron micrographs of epicuticular wax on the surface of the stems (2 cm from the top when the stem was > 15 cm) and siliques (4 d after flowering) of 35-d-old, soil-grown plants after water had been withheld for 10 d.
Figure 6
Figure 6
Root/shoot ratios, cell sizes of different tissues, and root hairs of WT and kuf1 plants. A, Representative picture of 14-d-old WT and kuf1 mutant seedlings. B, Root/shoot ratios of 14-d-old WT and kuf1 mutant seedlings. Data are means ± SDs (n =12 seedlings/genotype). C, The sizes of palisade mesophyll cells from cotyledons of 7-d-old agar-grown WT and kuf1 seedlings. Data are means ± SDs (n =4 seedlings/genotype, 12 cells/seedling). D, The sizes of cortex cells from hypocotyls of 7-d-old agar-grown WT and kuf1 seedlings. Data are means ± SDs (n =4 seedlings/genotype, 12 cells/seedling). E, The sizes of palisade mesophyll cells from the fifth leaf of 21-d-old soil-grown WT and kuf1 plants. Data are means ± SDs (n =4 seedlings/genotype, 12 cells/seedling). F, Representative pictures of 8-d-old root hairs of the WT and kuf1 mutant plants. G, Root hair densities of WT and kuf1 mutant plants. Data are means ± SDs (n =25 roots/genotype). H, Root hair lengths of WT and kuf1 mutant plants. Data are means ± SDs (n =10 roots/genotype, 21 root hairs/root). Asterisks indicate significant differences between the genotypes for all statistical analyses in this figure (**P <0.01; ***P <0.001; Student’s t test).
Figure 7
Figure 7
Comparison of the roles of KUF1 and KAI2 and a model of the mechanisms by which KUF1 functions in Arabidopsis drought tolerance. A, KUF1 inhibits stomatal closure and cuticle formation and decreases the ABA response, whereas KAI2 functions in opposite ways, as supported by both phenotypic analyses and gene expression under drought stress. Both KUF1 and KAI2 promote anthocyanin biosynthesis and accumulation under drought stress. Transcriptome data demonstrate that KUF1 may inhibit brassinosteroid (BR) biosynthesis and gibberellin (GA) biosynthesis, and may promote JA and GLS biosyntheses. KAI2 may promote JA, GA, and GLS biosyntheses, as well as KAR signaling. In addition, KAI2 may be activated by an endogenous ligand (KL), and activated KAI2 induces the expression of KUF1 (long black arrow). KUF1 may interact with an SCF-type E3 ubiquitin ligase complex to target an unknown protein(s) (question mark) for polyubiquitination and proteasomal degradation. This unknown protein(s) may participate in KL biosynthesis. Arrows indicate promotion, and blunt bars indicate inhibition. Blue arrows and blunt bars represent the various roles of KUF1, and red arrows and blunt bars represent the various roles of KAI2. Dotted bars and arrows indicate possible regulation. Components of the E3 ubiquitin ligase complex other than Arabidopsis S-phase Kinase-associated protein 1 (ASK1) are not shown. B, KUF1 inhibits ABA responsiveness, stomatal closure, cuticle formation, root/shoot ratios, root hair densities, and root hair development, thereby negatively regulating drought tolerance through increasing shoot water loss and reducing root water absorption. Black blunt bars indicate inhibition by KUF1, and black arrows indicate promotion of processes associated with drought tolerance.

References

    1. Abdelrahman M, Jogaiah S, Burritt DJ, Tran LP (2018) Legume genetic resources and transcriptome dynamics under abiotic stress conditions. Plant Cell Environ 41: 1972–1983 - PubMed
    1. Acharya BR, Jeon BW, Zhang W, Assmann SM (2013) Open Stomata 1 (OST1) is limiting in abscisic acid responses of Arabidopsis guard cells. New Phytol 200: 1049–1063 - PubMed
    1. Bailey-Serres J, Parker JE, Ainsworth EA, Oldroyd GED, Schroeder JI (2019) Genetic strategies for improving crop yields. Nature 575: 109–118 - PMC - PubMed
    1. Bu Q, Lv T, Shen H, Luong P, Wang J, Wang Z, Huang Z, Xiao L, Engineer C, Kim TH, et al. (2014) Regulation of drought tolerance by the F-box protein MAX2 in Arabidopsis. Plant Physiol 164: 424–439 - PMC - PubMed
    1. Buckley TN (2019) How do stomata respond to water status? New Phytol 224: 21–36 - PubMed

Publication types

MeSH terms

LinkOut - more resources