

Finite element analysis of bone mechanical properties using MRI-derived bound and pore water concentration maps
- PMID: 35822868
- PMCID: PMC9837311
- DOI: 10.1080/10255842.2022.2098016
Finite element analysis of bone mechanical properties using MRI-derived bound and pore water concentration maps
Abstract
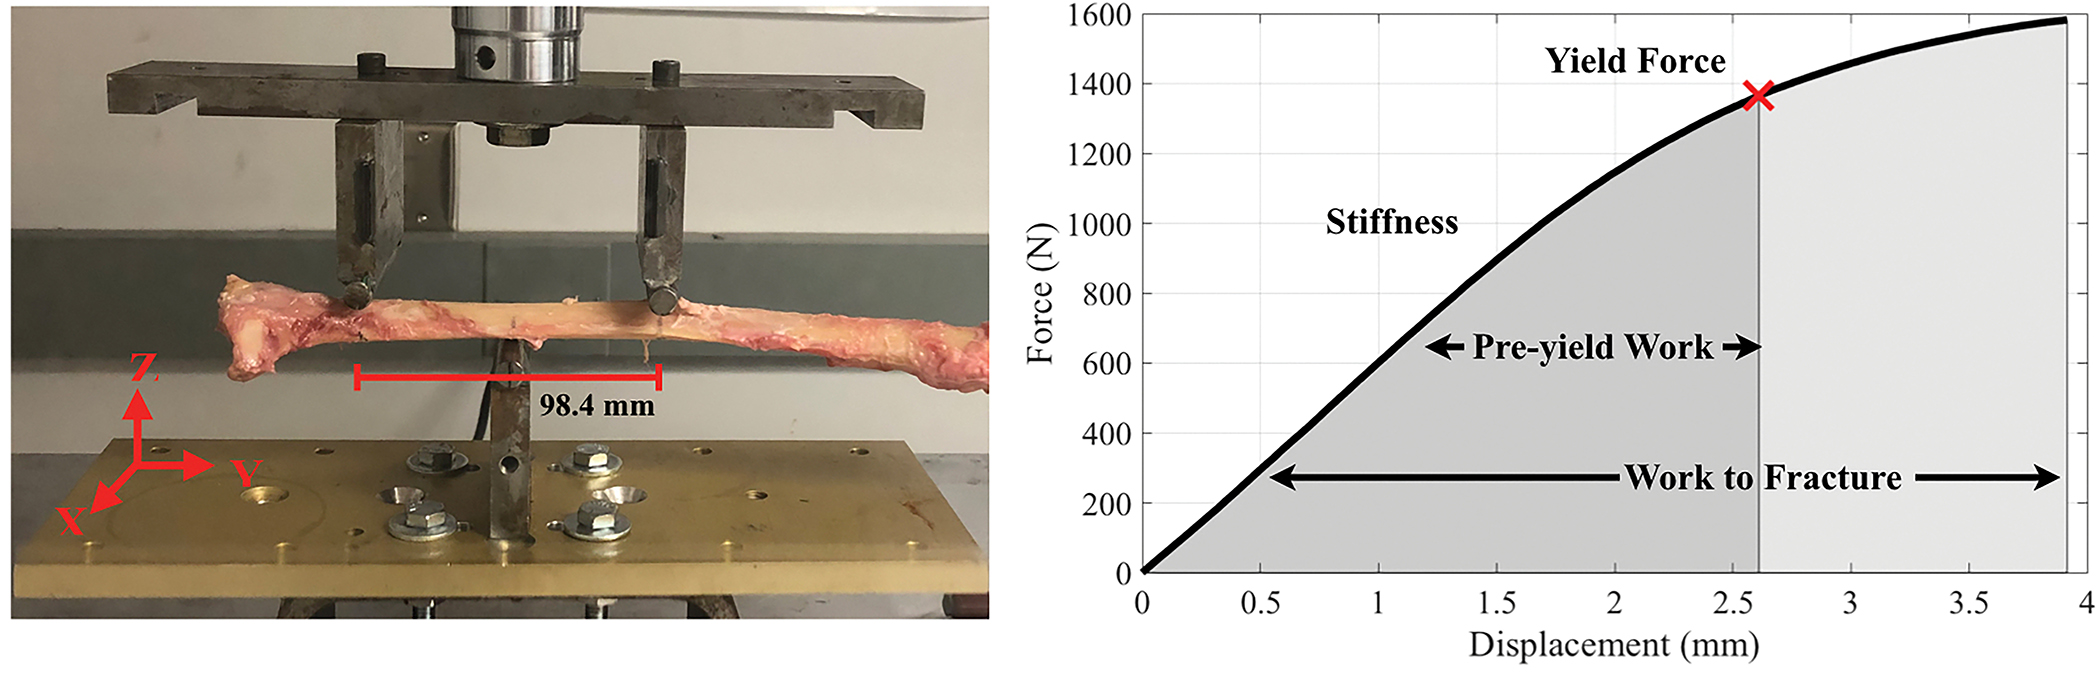
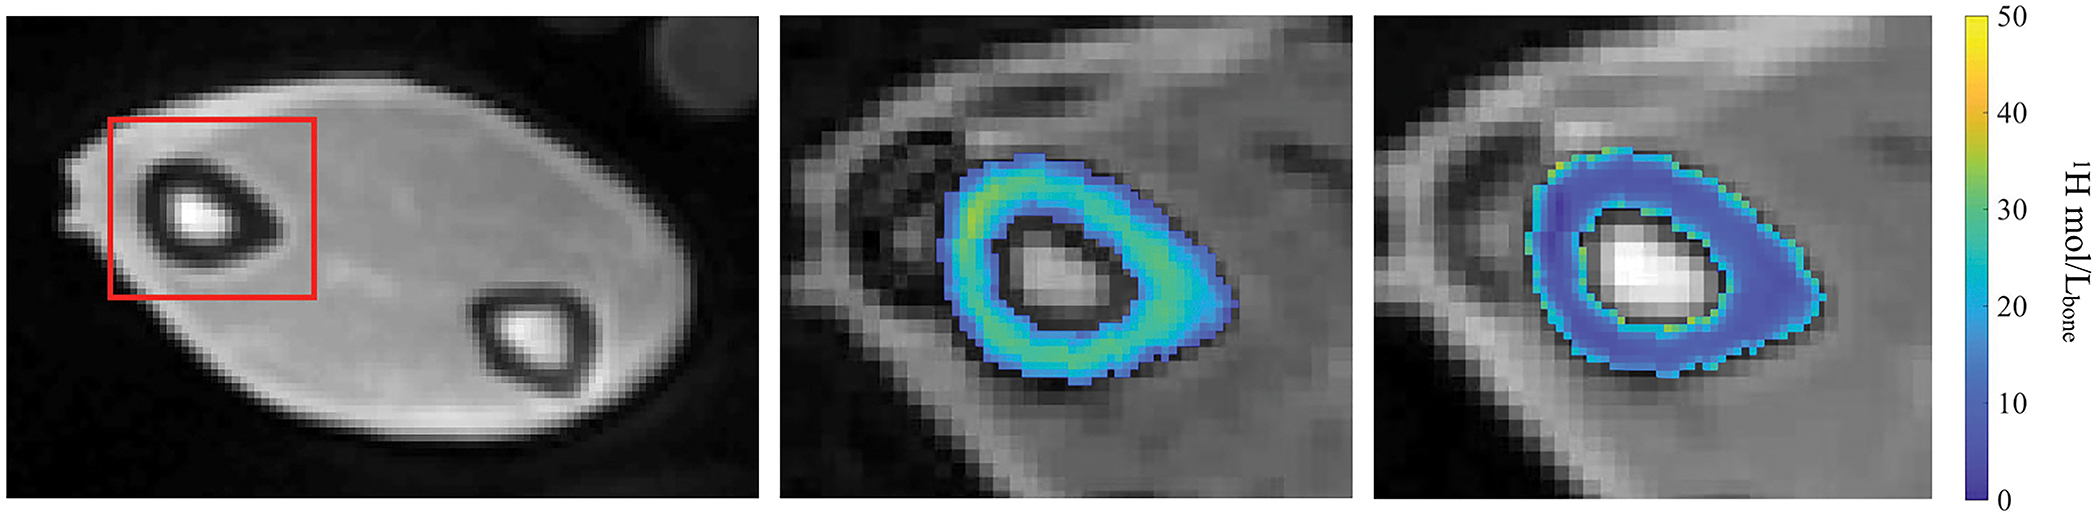
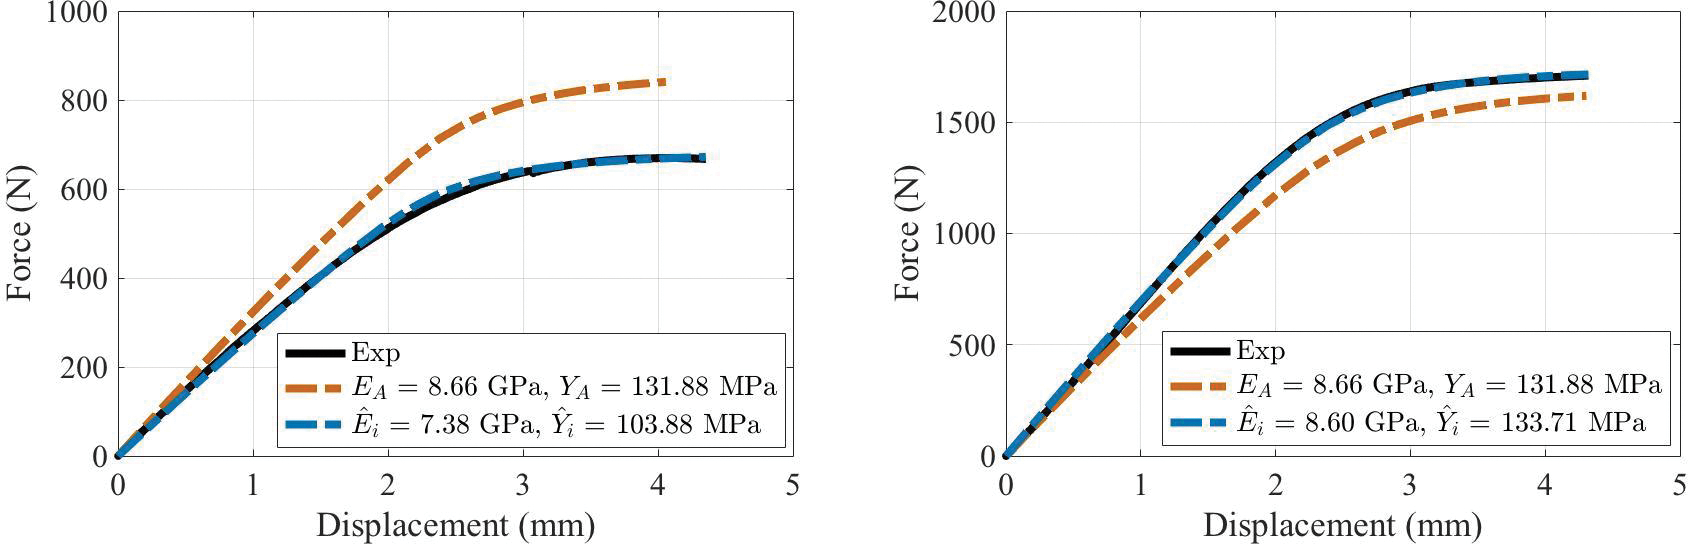
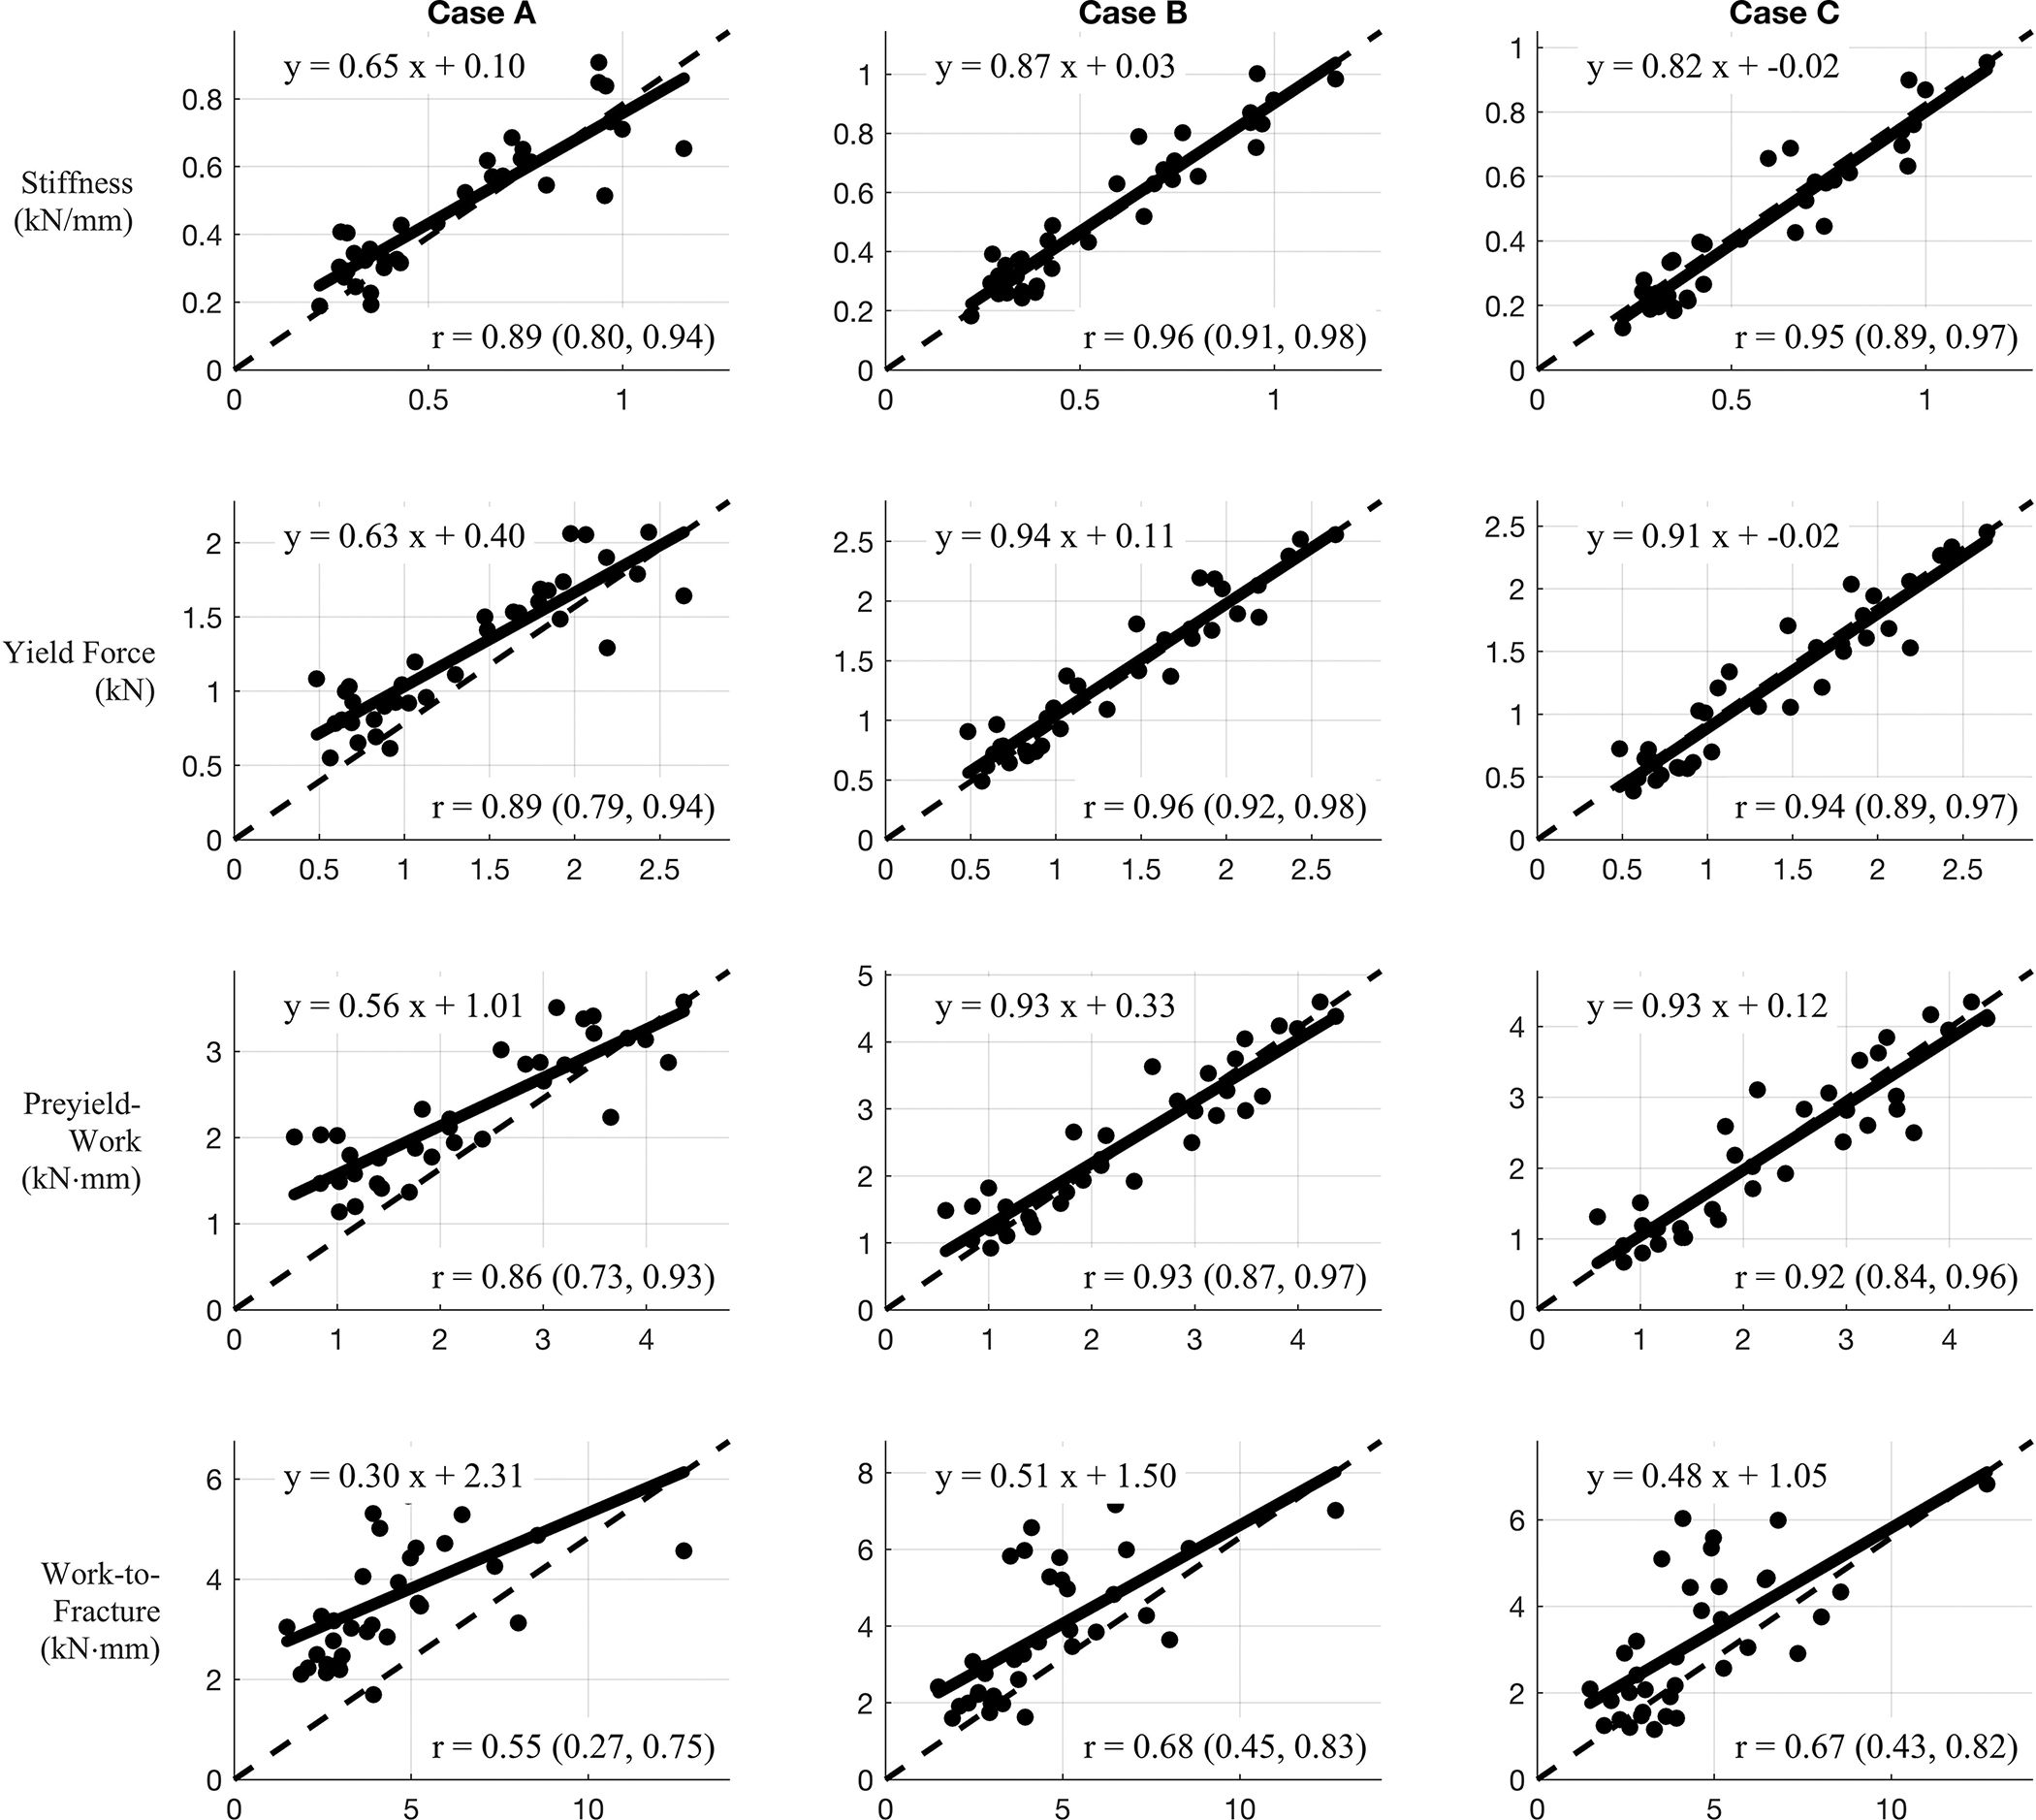
Ultrashort echo time (UTE) MRI techniques can be used to image the concentration of water in bones. Particularly, quantitative MRI imaging of collagen-bound water concentration (Cbw) and pore water concentration (Cpw) in cortical bone have been shown as potential biomarkers for bone fracture risk. To investigate the effect of Cbw and Cpw on the evaluation of bone mechanical properties, MRI-based finite element models of cadaver radii were generated with tissue material properties derived from 3 D maps of Cbw and Cpw measurements. Three-point bending tests were simulated by means of the finite element method to predict bending properties of the bone and the results were compared with those from direct mechanical testing. The study results demonstrate that these MRI-derived measures of Cbw and Cpw improve the prediction of bone mechanical properties in cadaver radii and have the potential to be useful in assessing patient-specific bone fragility risk.
Keywords: MRI; bone; bound water; finite element analysis; pore water.
Conflict of interest statement
Disclosure statement
The authors declare that there are no conflicts of interest in the present study.
Figures


Similar articles
-
Toward the use of MRI measurements of bound and pore water in fracture risk assessment.Bone. 2023 Nov;176:116863. doi: 10.1016/j.bone.2023.116863. Epub 2023 Jul 30. Bone. 2023. PMID: 37527697 Free PMC article.
-
MRI-derived bound and pore water concentrations as predictors of fracture resistance.Bone. 2016 Jun;87:1-10. doi: 10.1016/j.bone.2016.03.007. Epub 2016 Mar 16. Bone. 2016. PMID: 26993059 Free PMC article.
-
Evaluation of bound and pore water in cortical bone using ultrashort-TE MRI.NMR Biomed. 2015 Dec;28(12):1754-1762. doi: 10.1002/nbm.3436. Epub 2015 Nov 3. NMR Biomed. 2015. PMID: 26527298 Free PMC article.
-
Solid-State Quantitative (1)H and (31)P MRI of Cortical Bone in Humans.Curr Osteoporos Rep. 2016 Jun;14(3):77-86. doi: 10.1007/s11914-016-0307-2. Curr Osteoporos Rep. 2016. PMID: 27048472 Free PMC article. Review.
-
The Role of Water Compartments in the Material Properties of Cortical Bone.Calcif Tissue Int. 2015 Sep;97(3):292-307. doi: 10.1007/s00223-015-9977-5. Epub 2015 Mar 18. Calcif Tissue Int. 2015. PMID: 25783011 Free PMC article. Review.
Cited by
-
Toward the use of MRI measurements of bound and pore water in fracture risk assessment.Bone. 2023 Nov;176:116863. doi: 10.1016/j.bone.2023.116863. Epub 2023 Jul 30. Bone. 2023. PMID: 37527697 Free PMC article.
References
-
- Chang G, Honig S, Brown R, Deniz CM, Egol KA, Babb JS, Regatte RR, Rajapakse CS. 2014. Finite element analysis applied to 3-T MR imaging of proximal femur microarchitecture: Lower bone strength in patients with fragility fractures compared with control subjects. Radiology. 272(2):464–474. - PMC - PubMed
-
- Currey J 1990. Physical characteristics affecting the tensile failure properties of compact bone. J Biomech. 23(8):837–844. - PubMed
-
- Duyn JH, Yang Y, Frank JA, Van der Veen JW. 1998. Simple correction method fork-space trajectory deviations in MRI. J Magn Reson. 132(1):150–153. - PubMed
MeSH terms
Substances
Grants and funding
LinkOut - more resources
Full Text Sources
Medical