. 2022 Jul 13:11:e77469.
doi: 10.7554/eLife.77469.

Cryo-EM structures reveal that RFC recognizes both the 3'- and 5'-DNA ends to load PCNA onto gaps for DNA repair

Affiliations

Cryo-EM structures reveal that RFC recognizes both the 3'- and 5'-DNA ends to load PCNA onto gaps for DNA repair

Fengwei Zheng et al. Elife. .

Abstract

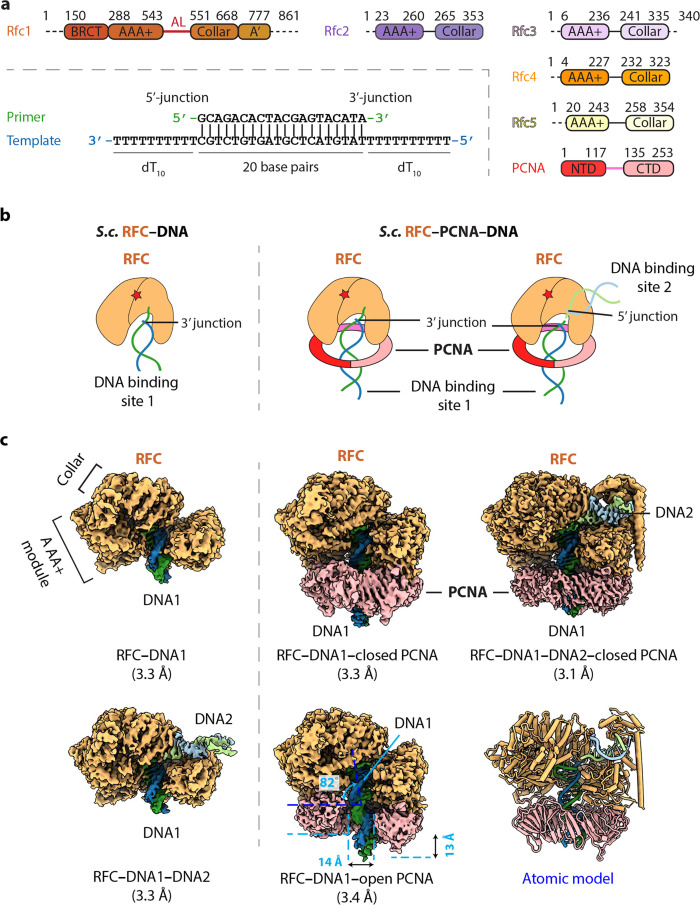
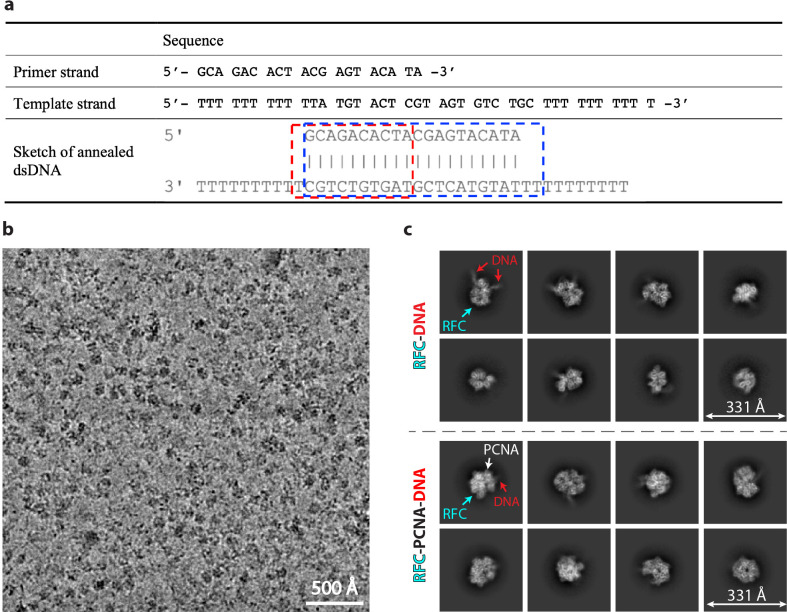
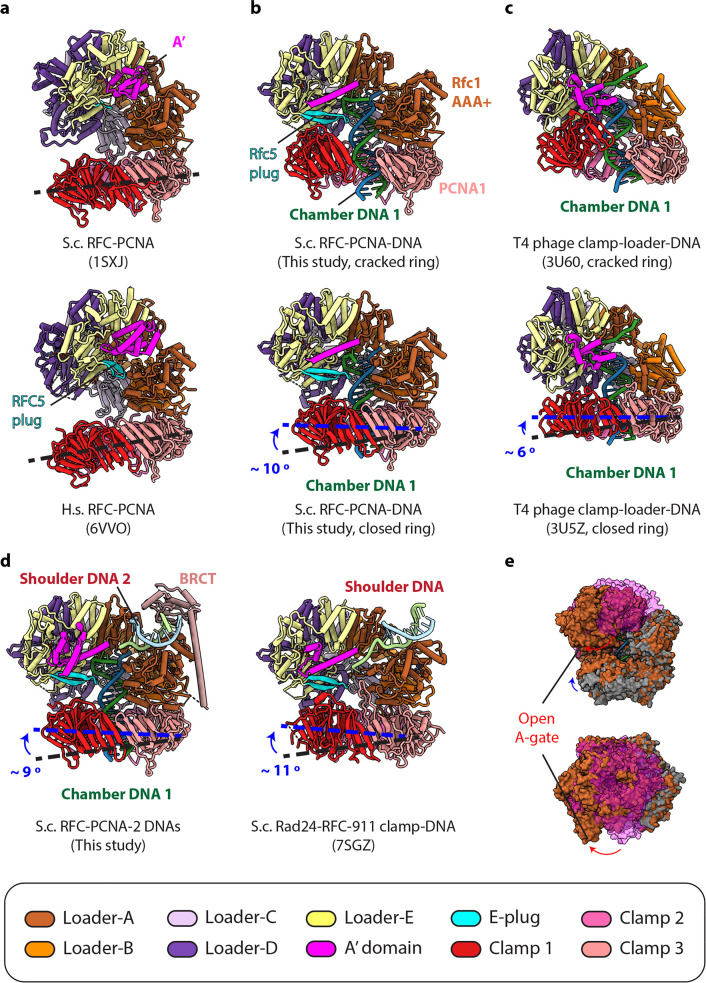
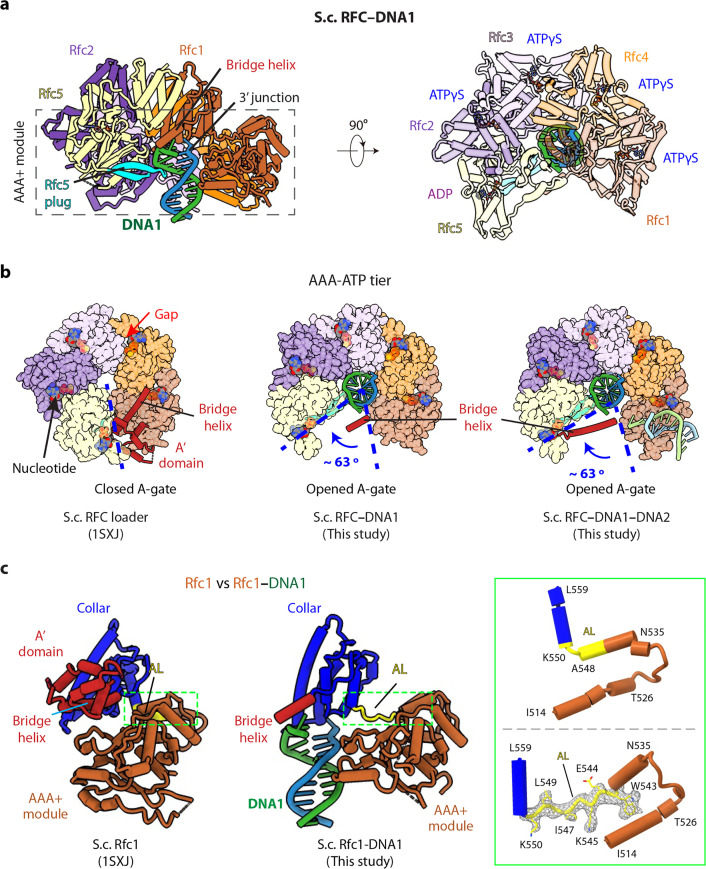
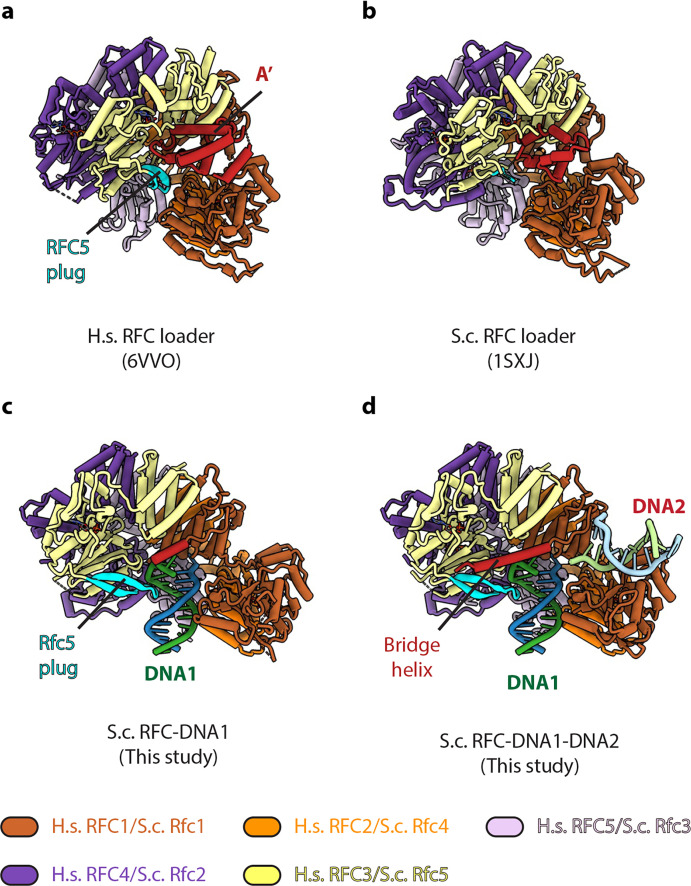
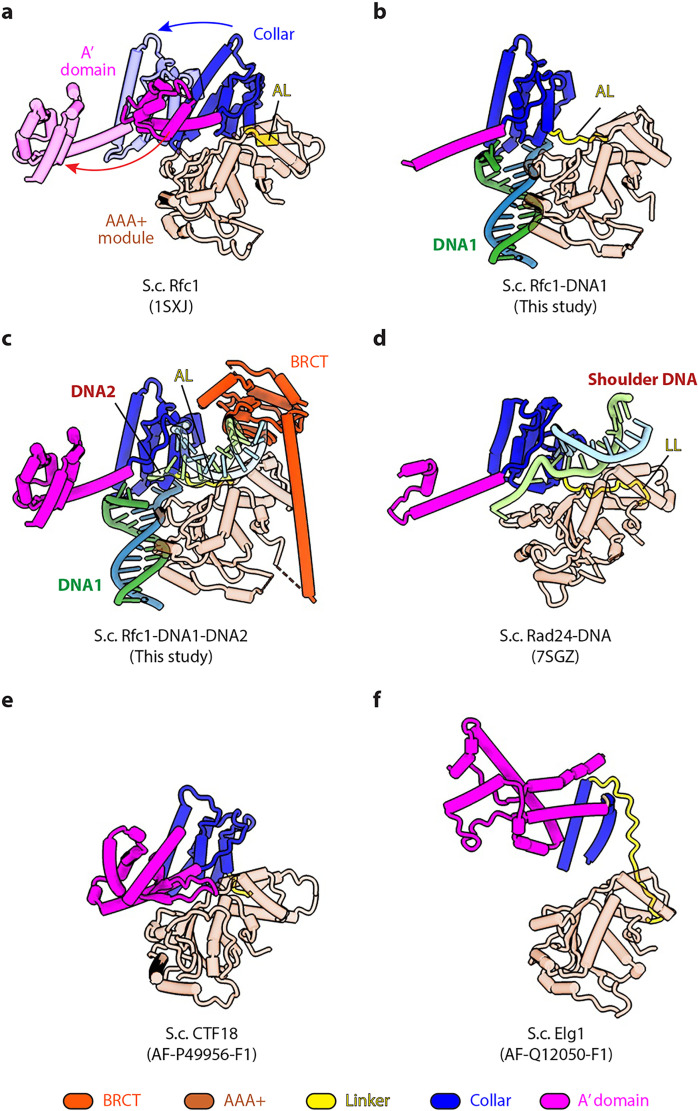
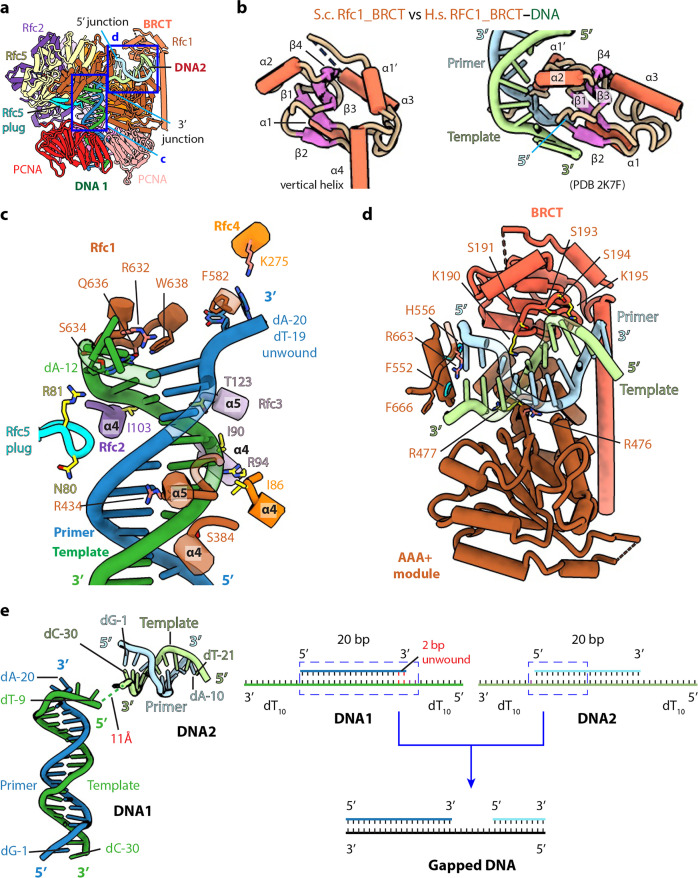
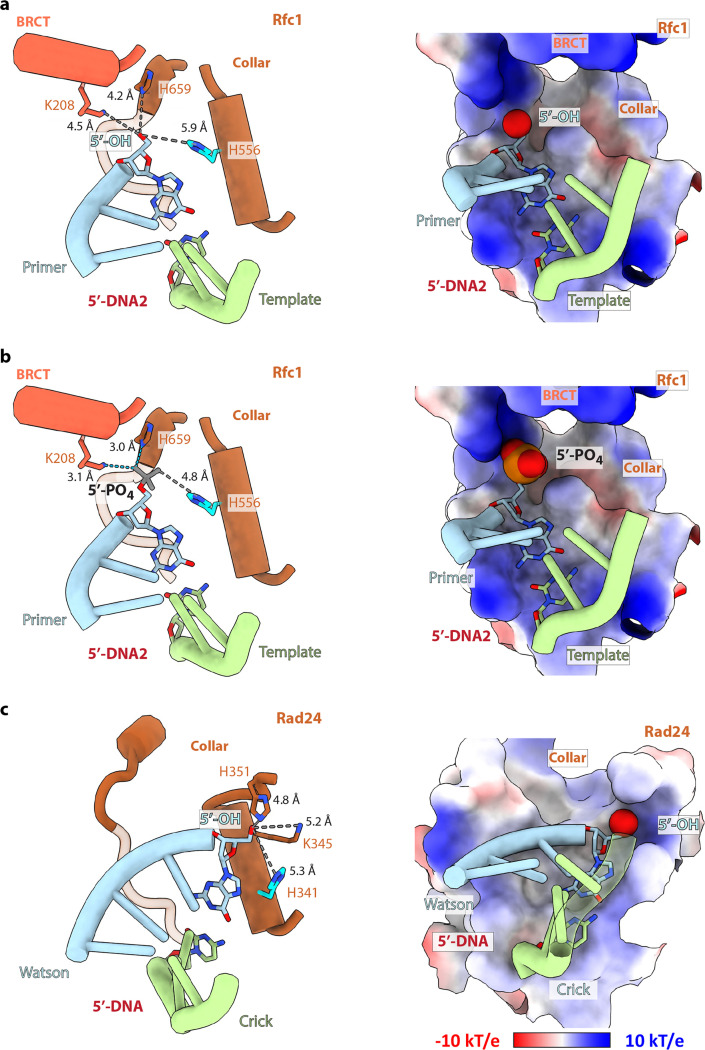
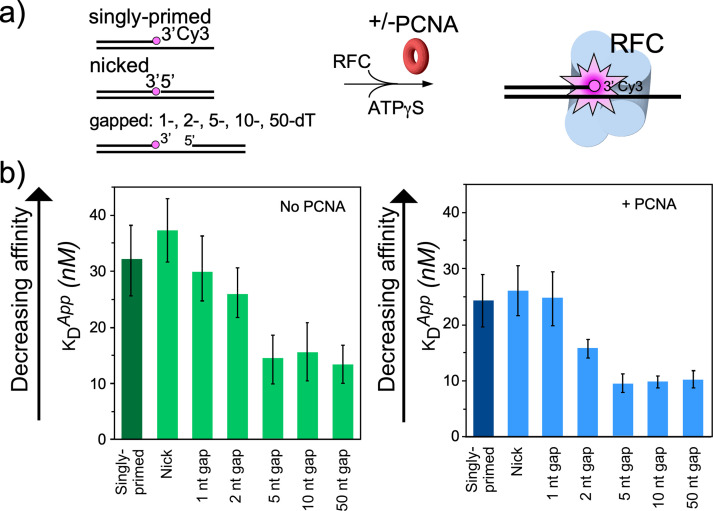
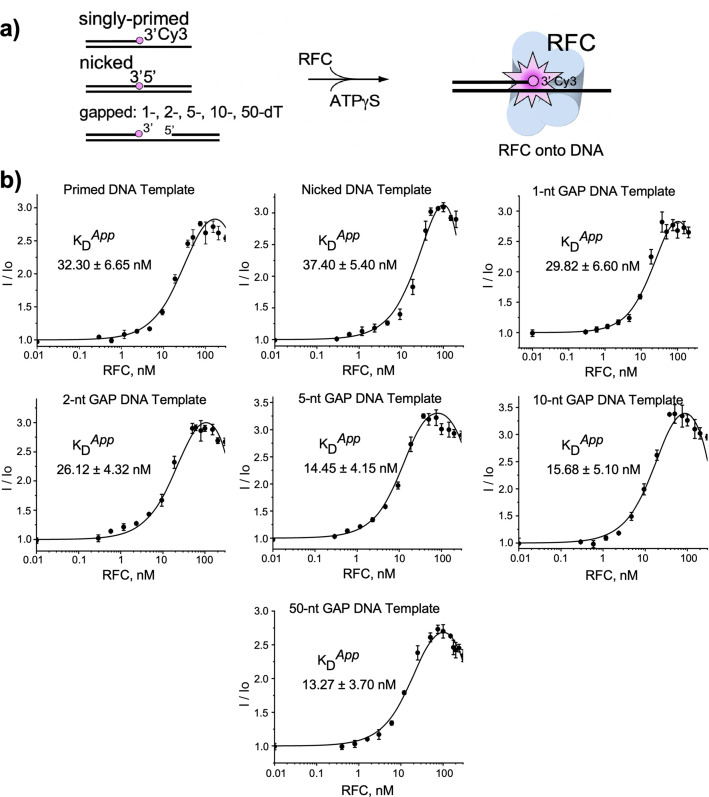
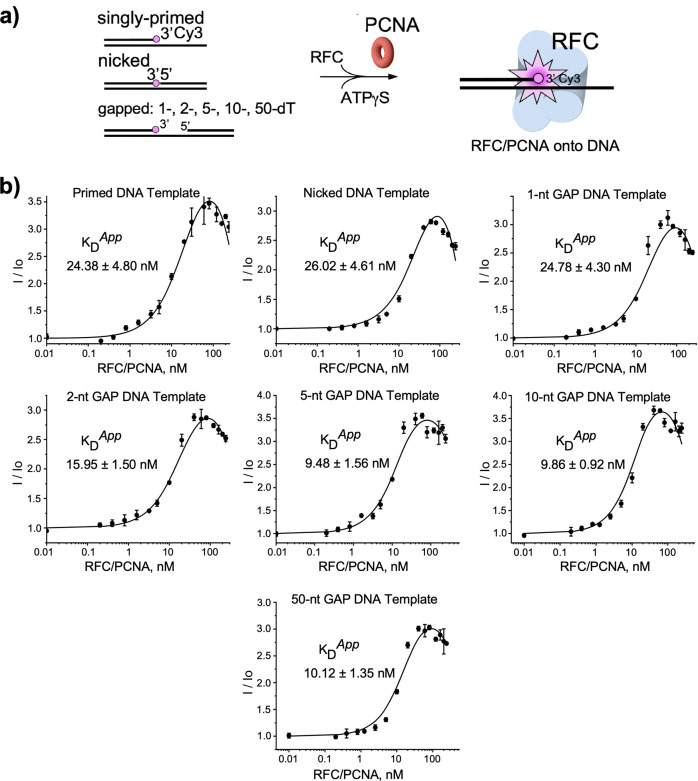
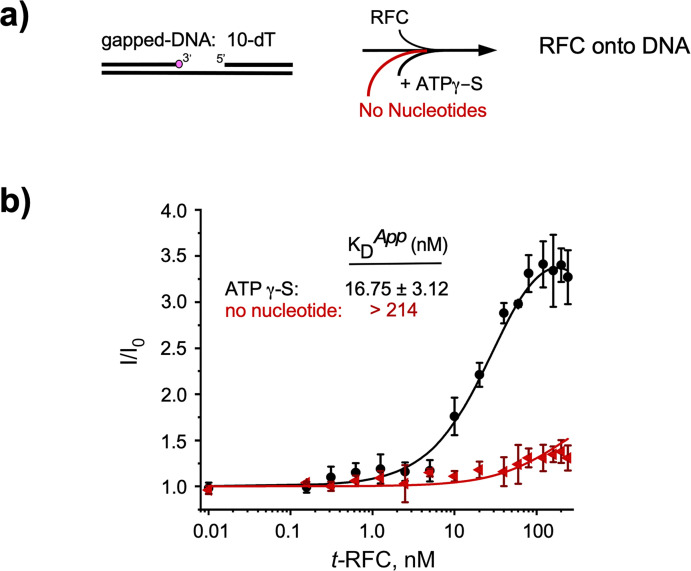
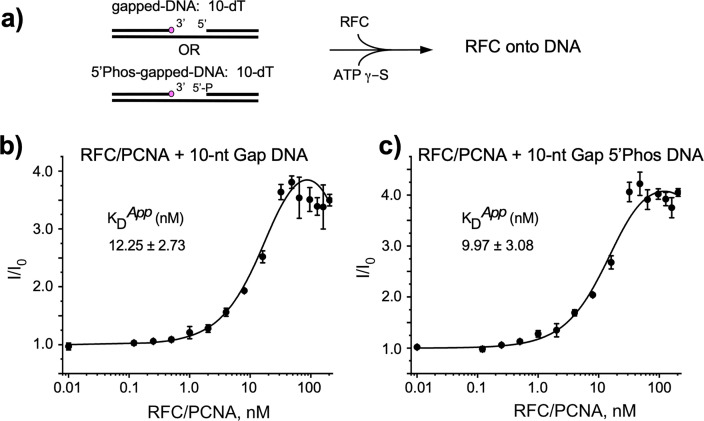
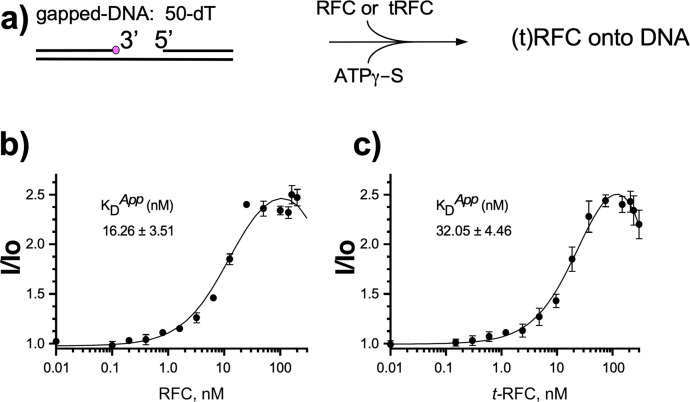
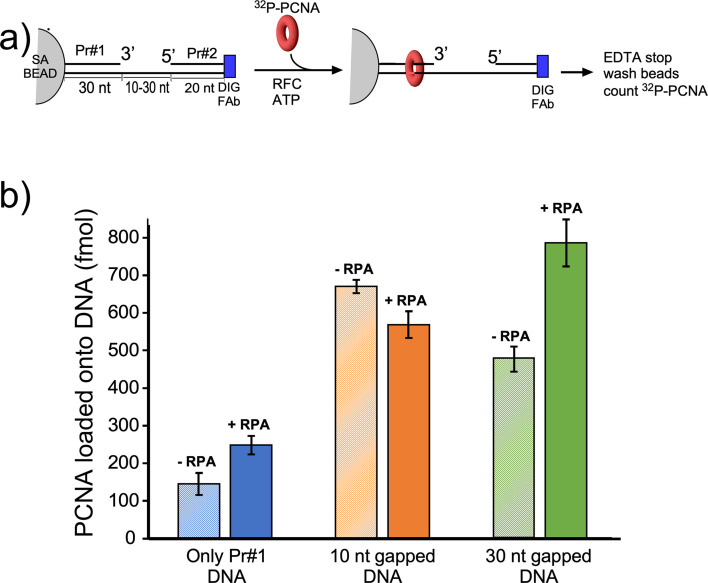
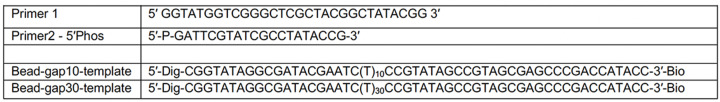
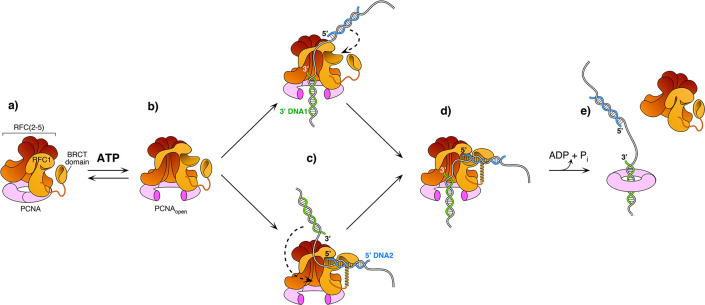
RFC uses ATP to assemble PCNA onto primed sites for replicative DNA polymerases δ and ε. The RFC pentamer forms a central chamber that binds 3' ss/ds DNA junctions to load PCNA onto DNA during replication. We show here five structures that identify a second DNA binding site in RFC that binds a 5' duplex. This 5' DNA site is located between the N-terminal BRCT domain and AAA+ module of the large Rfc1 subunit. Our structures reveal ideal binding to a 7-nt gap, which includes 2 bp unwound by the clamp loader. Biochemical studies show enhanced binding to 5 and 10 nt gaps, consistent with the structural results. Because both 3' and 5' ends are present at a ssDNA gap, we propose that the 5' site facilitates RFC's PCNA loading activity at a DNA damage-induced gap to recruit gap-filling polymerases. These findings are consistent with genetic studies showing that base excision repair of gaps greater than 1 base requires PCNA and involves the 5' DNA binding domain of Rfc1. We further observe that a 5' end facilitates PCNA loading at an RPA coated 30-nt gap, suggesting a potential role of the RFC 5'-DNA site in lagging strand DNA synthesis.

Keywords: DNA damage; DNA repair; DNA replication; PCNA; RFC; S. cerevisiae; biochemistry; chemical biology; sliding clamp.


Conflict of interest statement

FZ, NY, HL, MO The authors declare no competing interests, RG No competing interests declared

Figures

Figure 1.
Figure 1.. Cryo-EM captured multiple S.c. RFC–(PCNA)–DNA complexes.
(a) Domain architecture of RFC, PCNA, and the template/primer DNA. Dashed lines indicate unsolved regions. AL is the alternative linker between Rfc1 AAA+ and collar domain. Pink line between PCNA NTD and CTD represents the inter-domain connecting loop (IDCL). DNA used in this study harbors both 5′-DNA and 3′-DNA junctions. (b) Sketch illustrating the previously established DNA1 binding site recognizing the 3′-DNA junction in the RFC central chamber (left) and the novel 5′-DNA2 site recognizing the 5′-DNA junction on Rfc1 shoulder. (c) 3D maps of the five loading intermediates: RFC–3′-DNA1 and RFC–3′-DNA1–5′-DNA2 (left), RFC–3′-DNA1–PCNA in closed and open spiral form (middle), and RFC–3′-DNA1–5′-DNA2–PCNA (right). These maps are displayed at the same threshold (0.2). RFC is in orange, PCNA pink. DNA strands are individually colored.
Figure 1—figure supplement 1.
Figure 1—figure supplement 1.. Cryo-EM of in vitro assembled S. cerevisiae RFC–PCNA–DNA complexes.
(a) The double-tailed substrate used for the in vitro assembly of RFC–PCNA–DNA complex. The stably bound and modeled regions of DNA1 and DNA2 in the quaternary RFC–DNA1–DNA-2–PCNA complex are marked by a dashed blue and red box, respectively. (b,c) Cryo-EM of in vitro assembled S. cerevisiae RFC–PCNA–DNA complexes. (b) A typical raw micrograph of the mixture of RFC with PCNA and DNA. (c) Selected 2D class averages with different views. Upper panel shows 2D averages of particles derived from mixture of RFC and DNA. Lower panel shows 2D averages of particles derived from mixture of RFC, DNA, and PCNA.
Figure 1—figure supplement 2.
Figure 1—figure supplement 2.. Cryo-EM image processing workflow.
CryoSPARC Live v3.2 was used to monitor the data collection and to process data in real time. We first used blob particle picking, then the machine learning-based Topaz to pick out additional particles. 3D variability analysis (3DVA) was performed to segregate different structures, resulting in the five final 3D maps. Focused refinement on Rfc1_BRCT-AAA+module−5′-DNA2 region improved the EM density of BRCT domain, which was combined with the RFC−3′-DNA1−5′-DNA2−PCNA map in Chimera to obtain the composite map.
Figure 1—figure supplement 3.
Figure 1—figure supplement 3.. Resolution estimation of the six 3D EM maps of the RFC loading complexes.
(a–f) Color-coded local resolution maps of the six 3D EM maps are shown on top, with the dimensions for each structure as labeled. The lower panels show the gold standard Fourier shell correlation (GSFSC) of the corresponding maps. (g) Fitting of the structural model (cartoon with side chains in sticks) with the EM density (gray meshes) is shown (as an example) for Rfc1 α-helix (aa 514–526) in each of the five full 3D maps.
Figure 1—figure supplement 4.
Figure 1—figure supplement 4.. Comparison of the PCNA poses in various RFC−(DNA)−PCNA structures.
(a) PCNA is tilted away from RFC in the yeast (upper) and human (lower) RFC−PCNA structures in the absence of DNA. (b–c) The PCNA clamp is either cracked open (upper) or closed (lower) when bound to the RFC−3′-DNA1 (b), resembling the two T4 phage clamp conformations (c). (d) The 5′-DNA2 binding site in Rfc1 (left) resembles the DNA binding site in Rad24 of the 911 clamp loader Rad24-RFC (right). (e) Superimposition of RFC−PCNA (grey surface) with RFC−3′-DNA1−Closed ring PCNA (brown surface) in a front side (upper) and top view (lower). Rfc2, 3, 5 along with the entire collar ring that will move upon DNA binding are shown in magenta. The relative movement that opens the A-gate is indicated by curved arrows. The structures are aligned by superimposing the clamp loader subunits at A and B positions.
Figure 2.
Figure 2.. 3′-DNA1 binding induces conformation changes and formation of the 5′-DNA2 site.
(a) Structure of RFC–3′-DNA1 complex colored by individual subunits and DNA strands (template in green and primer in steel blue) in a side (left) and a top view (right). The Rfc5 plug inserted into the DNA major groove is cyan. The four ATPγS and one ADP (only at the Rfc5:1 interface) are in sticks. (b) Comparison of the five AAA+ domains of RFC in the RFC–PCNA structure in the absence of DNA (left) or bound to 3′-DNA1 (middle) or bound to 3′-DNA1 and 5′-DNA2 (right) (the AAA-Lid domains are omitted for clarity). (c) Rfc1 in the absence of DNA (PDB entry 1SXJ) is superimposed with the AAA+ module with Rfc1 in the presence of 3′-DNA1 (this study), revealing large scale leftward movements of the collar and A’ domains (along with the 3′-DNA1). The region in the dashed green box is enlarged in the right panels showing the conformational changes of the alternative linker (AL), the EM density of the changed AL is shown in meshes. The structures in panels b-c are aligned by superimposing Rfc1 and Rfc4.
Figure 2—figure supplement 1.
Figure 2—figure supplement 1.. Structural comparison of the RFC loaders in different functional states.
(a–b) The reported human RFC (a) and yeast RFC (b) structures in the absence of DNA. (c–d) The structure of RFC bound to 3′-DNA1 (c) or to 3′-DNA1 and 5′-DNA2 (d). The RFC structures without DNA are extracted from published RFC−PCNA structures. 5′-DNA2 binding does not markedly change the RFC structure. The structures are aligned by superimposing Rfc1 and Rfc4.
Figure 2—figure supplement 2.
Figure 2—figure supplement 2.. 3′-DNA1 binding induces major conformation changes in Rfc1 to form the 5′-DNA2-binding groove.
(a) Rfc1 from the S.c. RFC–PCNA crystal structure in the absence of DNA (PDB ID 1SXJ) is superimposed to that from the RFC–3′-DNA1–5′-DNA2–PCNA quaternary complex, revealing large scale leftward movements of the two domains (indicated by the two curved arrows), similar with that described in Figure 2c. (b) 3′-DNA1 binding is sufficient to induce the formation of the 5′-DNA2 binding groove as observed in the RFC–3′-DNA1 structure even without the binding of PCNA. The same 5′-DNA2-binding groove is formed in the RFC–3′-DNA1–PCNA (closed ring) and RFC–3′-DNA1–PCNA (cracked open ring) structure. (c) Rfc1 binding to 3′-DNA1 and 5′-DNA2 simultaneously in RFC–3′-DNA1–5′-DNA2–PCNA complex. The Rfc1 BRCT domain is in dark orange. (d) Rad24-RFC binds 5′ DNA (PDB ID 7SGZ) at a site equivalent to the Rfc1 5′-DNA2 binding site. The Rad24 long linker LL is equivalent to the Rfc1 alternative linker AL. Panels containing superimpositions are aligned by the AAA+ module of Rfc1 or Rad24. (e–f) AlphaFold predicts Ctf18 (e) and Elg1 (f) structures appear to be compatible with 5′-DNA binding at the shoulder. Some loop regions (with low predicting confidence) by AlphaFold are omitted for clarity.
Figure 3.
Figure 3.. The BRCT domain of Rfc1 stabilizes 5′-DNA2 in the quaternary RFC–3′-DNA1–5′-DNA2–PCNA complex.
(a) The atomic model of the quaternary RFC–3′-DNA1–5′-DNA2–PCNA complex. The Rfc1 BRCT domain caps 5′-DNA2. Regions in the two blue boxes are enlarged in (c) and (d). (b) Structure of the yeast Rfc1 BRCT domain in the context of the full RFC complex bound to DNA (DNA not shown) compared with the human RFC1 BRCT domain (aa 375–480; PDB entry 2K7F). The human RFC1 BRCT was computationally modeled to recognize the 5′-junction of dsDNA by the end region of β1–2. (c) Enlarged view showing interactions between RFC and 3′-DNA1. Helices α4 and α5 of the AAA-ATP domain of Rfc1, 4, 3 and 2 wrap around the template strand. DNA is shown as stubs with the separated base pair (dA-12:dT-19) and base dA-20 in primer strand shown in sticks. Residues Arg-632 and Gln-636 (from Rfc1), Lys-275 (from Rfc4) contacting the bases of DNA are in salmon sticks. Residues H-bonding with DNAs are in yellow. The main chain nitrogen atoms of Ile-86, Ile-90, and Ile-103 in the α4 helices of Rfc4, 3 and 2 form H-bonds with template DNA. (d) Enlarged view of the 5′-DNA2 binding region. The positively charged Rfc1 BRCT domain on top and positively charged AAA+ module from the bottom stabilize the 5′-DNA2. Key residues surrounding 5′-DNA2 are labelled. The α-helix of Rfc1 collar domain harboring Phe-552 and His-556 (cyan sticks) blocks the 5′-DNA2 5′-junction. The “separation pin” residue Phe-666 located at the DNA2 5′-junction, Arg-476 and Arg-663 (salmon sticks) insert into the DNA minor groove, while Arg-477 (yellow stick) point to the DNA major groove. For clarity, only partial protein secondary structures are shown. Unless noted otherwise, the same color and rendering scheme is used in all figures. (e) The arrangement of 3′-DNA1 and 5′-DNA2 in RFC (left) resembles a gapped DNA (right).
Figure 3—figure supplement 1.
Figure 3—figure supplement 1.. The binding cavity for the 5′-recessed end of the shoulder DNA2.
(a–b) Three basic residues − Lys208 in the BRCT domain and His556 and His659 in the Rfc1 collar domain − surround the DNA2 5′-end (5′-OH in a) and computationally modeled 5′-P in (b) in the RFC−PCNA−DNA1−DNA2 structure. The distances between the 5′ moiety and the surrounding residues are labelled and shown as dashed lines. The cavity is larger than necessary for binding the OH group but fits the phosphate snuggly with two H-bonds (dashed cyan lines). (c) The cavity for the 5′ moiety of the shoulder DNA in Rad24 is also lined by three basic residues – His341, His351, and Lys 345. The two DNA strands are labeled as Watson and Crick in the context of DNA damage repair. The three models are aligned by the largest subunit (Rfc1 or Rad24). Only the regions within 15 Å of the 5′-end are shown for clarity. The left panels are cartoon views, and the right panels are electrostatic surface views. The last base pair (dG-1:dC-30) is in sticks, and the DNA 5′ moiety in spheres.
Figure 4.
Figure 4.. RFC/PCNA affinity for DNAs with different gap sizes.
(a) Scheme for the affinity assay of RFC +/-PCNA for gapped DNAs. The top strand is composed of two constant length DNA oligonucleotides, that are hybridized to a variable length bottom strand to generate different sized gaps. The left most oligonucleotide had a 3′ fluorophore. (b) Histograms for KD measurements of RFC binding assays to each DNA template +/-PCNA in the presence of ATPγS. The histograms in the absence of PCNA are shown to the left, and in the presence of PCNA are shown to the right. The raw titration data are shown in Figure 4—figure supplements 3 and 4. The data are obtained from analysis of independent triplicate assays, and the error bars show the standard deviation. The arrows indicate that the larger the KD value, the weaker the binding.
Figure 4—figure supplement 1.
Figure 4—figure supplement 1.. SDS-PAGE of proteins used in this report.
The molecular weight (mw) markers are to the left, and each protein factor is indicated above its corresponding lane.
Figure 4—figure supplement 2.
Figure 4—figure supplement 2.. Sequence of DNA oligonucleotides used for in vitro DNA binding assays using fluorescence.
Figure 4—figure supplement 3.
Figure 4—figure supplement 3.. Binding of RFC to gapped DNA.
(a) Reaction scheme as described in Materials and methods. (b) The plots represent fluorescence titrations of RFC (0.01–200 nM) with different DNA templates (10 nM), as noted above each plot. Fluorescence intensity was normalized (I/I0) to compare each fluorescent DNA template in the presence of DNA to that in the absence of RFC (see Materials and Methods). Experiments were performed in three independent trials and the mean values (filled circles), the standard deviation (error bars) and apparent KD are shown.
Figure 4—figure supplement 4.
Figure 4—figure supplement 4.. Binding of RFC/PCNA to gapped DNA.
(a) Reaction scheme as described in Materials and methods. (b) The plots represent fluorescence titrations of RFC/PCNA at equimolar ratio (between 0.01 and 200 nM) with different DNA templates (10 nM), as noted above each plot. Fluorescence intensity was normalized (I/I0) to compare each fluorescent DNA template in the presence of DNA to that in the absence of RFC/PCNA (see Materials and methods). Experiments were performed in three independent trials and the mean values (filled circles), the standard deviation (error bars) and apparent KD are shown.
Figure 4—figure supplement 5.
Figure 4—figure supplement 5.. Binding of RFC to 10-nt gap DNA in the absence of nucleotide compared to use of ATPγS.
(a) Reaction scheme described in Materials and methods section. (b) Titrations reactions of RFC (between 0.01 and 240 nM) with a 10-dT gapped DNA template (10 nM) in the presence of either ATPγS (black), or ‘no nucleotide’ (red). Experiments were performed in three independent trials and the mean values (filled circles), the standard deviation (error bars) and apparent KD are shown.
Figure 4—figure supplement 6.
Figure 4—figure supplement 6.. A 5′ P at a 10-nt gap has no effect on RFC or RFC–PCNA binding.
The experiments were performed as described in Materials and methods. (a) Scheme to examine the effect on RFC binding to DNA containing a 10-nt gap having either a 5′ OH or 5′ P. (b) Results of a titration of RFCPCNA binding to DNA having a 5′ OH at the gap. (c) Results of a similar titration but having 5′ phosphate group at the gap. Experiments were performed in three independent trials and the mean values (filled circles), the standard deviation (error bars) and apparent KD are shown.
Figure 4—figure supplement 7.
Figure 4—figure supplement 7.. RFC binds a gapped DNA tighter than a mutant RFC lacking the 5′-DNA domain in Rfc1.
(a) Reaction scheme as described in Materials and methods. (b) The plots represent fluorescence titration reactions (0.01–200 nM) of RFC, or (c) truncated RFC (t-RFC) lacking the N-terminal 275 residues in Rfc1 of the RFC pentamer. Fluorescence intensity was normalized (I/I0) to compare each fluorescent DNA template in the presence of DNA to that in the absence of RFC or t-RFC. Experiments were performed in three independent trials and the mean values (filled circles), the standard deviation (error bars) and apparent KD are shown.
Figure 5.
Figure 5.. Efficiency of RFC loading PCNA onto gapped DNAs versus singly primed DNA.
(a) Scheme of the PCNA loading assay. The DNA template strand contains a 3′ biotin and a 5′ Dig moiety. The DNA’s were bound to streptavidin magnetic beads, then incubated with antibody to DIG to prevent PCNA sliding off DNA. Then RFC and 32P-PCNA were added with ATP for 30 s, quenched with EDTA, and beads were washed two times and 32P-PCNA that had been loaded onto DNA was counted by liquid scintillation. (b) Amounts of 32P-PCNA loaded by RFC onto either a singly primed DNA, a 10-nt gap DNA, or a 30-nt gap DNA in the presence or absence of RPA. All experiments were performed by independent triplicate assays and the error bars represent the SEM.
Figure 5—figure supplement 1.
Figure 5—figure supplement 1.. Sequence of DNA oligonucleotides used to load DNA onto streptavidin magnetic beads for in vitro PCNA loading.
The 5’ DIG is at the opposite end from the biotin-bead attachment in order to bind Dig antibody and block the ability of PCNA to slide off DNA.
Figure 6.
Figure 6.. Model of RFC using both 3′ and 5′ DNA sites to load PCNA at a gap.
(a–b) The ATPγS bound RFC opens PCNA and causes a conformation change that opens the A gate and PCNA, as well as exposing the shoulder 5′-DNA2 site (Gaubitz et al., 2022). (c) Once the A gate (for 3′-DNA1) and shoulder site (for 5′-DNA2) are exposed, either of two paths may be taken for RFC–PCNA binding to the 3′ and 5′ ends of a ssDNA gap. The top path shows 3′-DNA binding first, followed by 5′-DNA binding. The bottom path shows 5′-DNA binding followed by 3′-DNA binding. Regardless of which path is taken, after DNA binds in one site, filling of the remaining site is intramolecular and thus is probably very rapid. (d-e) Upon fully binding to the gapped DNA, RFC hydrolyzes ATP and dissociates from the clamp, enabling downstream enzymes, such as DNA Pols (not illustrated), to bind the PCNA encircling the gapped DNA.

Similar articles

Cited by

References

    1. Aboussekhra A, Biggerstaff M, Shivji MK, Vilpo JA, Moncollin V, Podust VN, Protić M, Hübscher U, Egly JM, Wood RD. Mammalian DNA nucleotide excision repair reconstituted with purified protein components. Cell. 1995;80:859–868. doi: 10.1016/0092-8674(95)90289-9. - DOI - PubMed
    1. Adams PD, Afonine PV, Bunkóczi G, Chen VB, Davis IW, Echols N, Headd JJ, Hung L-W, Kapral GJ, Grosse-Kunstleve RW, McCoy AJ, Moriarty NW, Oeffner R, Read RJ, Richardson DC, Richardson JS, Terwilliger TC, Zwart PH. PHENIX: a comprehensive Python-based system for macromolecular structure solution. Acta Crystallographica. Section D, Biological Crystallography. 2010;66:213–221. doi: 10.1107/S0907444909052925. - DOI - PMC - PubMed
    1. Allen BL, Uhlmann F, Gaur LK, Mulder BA, Posey KL, Jones LB, Hardin SH. DNA recognition properties of the N-terminal DNA binding domain within the large subunit of replication factor C. Nucleic Acids Research. 1998;26:3877–3882. doi: 10.1093/nar/26.17.3877. - DOI - PMC - PubMed
    1. Altieri AS, Kelman Z. DNA sliding clamps as therapeutic targets. Frontiers in Molecular Biosciences. 2018;5:87. doi: 10.3389/fmolb.2018.00087. - DOI - PMC - PubMed
    1. Anderson SG, Thompson JA, Paschall CO, O’Donnell M, Bloom LB. Temporal correlation of DNA binding, ATP hydrolysis, and clamp release in the clamp loading reaction catalyzed by the Escherichia coli gamma complex. Biochemistry. 2009;48:8516–8527. doi: 10.1021/bi900912a. - DOI - PMC - PubMed

Publication types

MeSH terms